
N-linked glycoproteomic profiling in esophageal squamous cell carcinoma
2022-08-12 08:10QiWeiLiuHaoJieRuanWeiXiaChaoMengXiangLiYeLinJiaoDouglasWardSheGanGaoYiJunQi
World Journal of Gastroenterology 2022年29期
Qi-Wei Liu, Hao-Jie Ruan, Wei-Xia Chao, Meng-Xiang Li, Ye-Lin Jiao, Douglas G Ward, She-Gan Gao, Yi-JunQi
Abstract
Key Words: Esophageal squamous cell carcinoma; N-linked glycoprotein; Post-translational modification;Lectin; Cathepsin D; Haptoglobin; 14-3-3ζ
lNTRODUCTlON
Esophageal cancer is a severe global health issue with 572000 new cases and 509000 deaths in 2018, half of which occur in China[1]. The two most common histological subtypes of esophageal cancer are esophageal squamous cell carcinoma (ESCC) and esophageal adenocarcinoma, with ESCC being the predominant histological subtype both in China and worldwide[2,3]. The long-term outcome of ESCC is correlated with clinical stage at diagnosis with the best outcome in the early stages[4-6]. Unfortunately,the current endoscopic screening for ESCC suffers from low patient compliance and high cost despite the fact that an early detection rate of 70% was achieved in a high-risk region in northern central China[7]. Furthermore, serum biomarkers for ESCC, including squamous cell carcinoma antigen, carcinoembryonic antigen, CYFRA21-1, and carbohydrate antigen 19-9, lack sufficient sensitivity and specificity for early detection[8-11]. The overall 5-year survival rate ranges from 15% to 25% because most cases of ESCC present at an advanced stage[6,12]. It is well accepted that novel biomarkers would hold great promise to improve the clinical outcome of ESCC.
Recent large-scale “omics” studies in ESCC have identified a myriad of aberrations at the levels of genome, epigenome, transcriptome, proteome,etc., revealing the high molecular heterogeneity of ESCC[13-17]. Beyond the scope of other techniques, mass spectrometry (MS)-based proteomics has the ability to measure post-translational modifications that provide additional significant biological insights, for example, therapeutically targetable signaling proteins and pathways[18,19]. To date, comprehensive glycoproteomic studies of ESCC are lacking. Glycosylation is present on more than 50% of human proteins and aberrant glycosylation has been implicated in the development and progression of various cancers[20-24]. The sugar chains of glycoproteins are involved in numerous physiological and pathological functions including cell growth, adhesion, differentiation, migration, signal regulation,immune responses, and tumor invasion[20,25,26]. Notably, the clinical prognosis of cancer has been correlated with certain structures of glycans attached to proteins[27,28]. The bisecting GlcNAc structure catalyzed by N-acetylglucosaminyltransferase Ⅲ plays crucial roles in suppression of cancer metastasis,which contrasts with the tumor-promoting role of β1, 6-branched N-glycan catalyzed by N-acetylglucosaminyltransferase Ⅴ[29]. It has been reported that E-cadherin modified by complex N-glycans exhibits weakened adherens junctions, whereas high mannose or less N-glycans attached to E-cadherin produces stable adherens junctions[30]. Furthermore, N-acetylglucosaminyltransferase Ⅲ modified α3β1 integrin suppresses cell spreading and migration and focal adhesion kinase activity[31]. The fraction of ConA-binding procathepsin D in the serum of hepatocellular carcinoma patients is significantly increased and shows a sensitivity of 85% and specificity of 80% for hepatocellular carcinoma diagnosis[24]. Not surprisingly, over 50% of current cancer biomarkers are glycoproteins, such as AFP, AFP-L3,CA19-9, CA125, and CEA[32-35].
In this study, we used MS-based proteomic analysis to identify N-linked glycoproteins associated with ESCC after isolation of N-linked glycoproteins using tandem multilectin affinity chromatography.Our study unraveled a comprehensive landscape of N-linked glycosylation dysregulation associated with ESCC and bioinformatics analysis provided insights into the functional significance of such aberrant glycosylation. The glycosylated fractions of procathepsin D, clusterin, 14-3-3ζ, proline-argininerich end leucine-rich repeat protein (PRELP), and haptoglobin may play important roles in malignant progression of ESCC and are potential diagnostic biomarkers for ESCC, suggesting that N-linked glycosylation aberrations may promote the malignant progression of ESCC.
MATERlALS AND METHODS
Clinical samples
All patients provided written informed consent, and the study was approved by the Ethics Committee of the Medical School, Henan University, China (ethics ref: 108) and conducted in accordance with the ethical guidelines of the 1975 Declaration of Helsinki. Forty-seven pairs of resected ESCC and adjacent normal esophageal mucosa tissue samples, and ten pre-operative serum samples were collected at Linzhou Cancer Hospital, Henan, China between 2010 and 2011 and stored in liquid nitrogen or at-70 ℃ prior to protein extraction. Among the tissue samples, 15 pairs served as a discovery set and the other 32 pairs as a validation set. All tissues were histopathologically confirmed as normal esophageal mucosa or ESCC. The adjacent non-cancerous samples were at least 3 cm distant from the edge of neoplastic mass. No patient in this study had received preoperative radiotherapy or chemotherapy.
Isolation of N-linked glycoproteins by lectin affinity chromatography
Extraction of total tissue proteins and N-linked glycoproteins was performed as previously reported with modifications[24]. Briefly, the esophageal tissue was homogenized in lysis buffer (50 mmol/L Tris,150 mmol/L NaCl, 1% NP-40, pH 7.2) supplemented with complete proteinase inhibitor cocktail (Roche Diagnostics GmbH, Mannheim, Germany) followed by centrifugation and supernatant collection.Enrichment of N-linked glycoproteins for three pairs of pooled protein samples from 15 ESCC and adjacent non-tumor tissues (five samples for each pair) was performed by tandem lectin affinity chromatography. The multilectin affinity chromatography used a combination of three agarose-bound lectins, Con A (Vector Laboratories, AL-1003), lentil lectin (LCH, Vector Laboratories, AL-1043), and snowdrop lectin (GNA, Vector Laboratories, AL-1243), and a combination of wheat germ agglutitin lectin (WGA, Vector Laboratories, AL-1023) and elderberry lectin (SNA, Vector Laboratories, AL-1303)for the first and second affinity chromatography, respectively. Sixty milligrams of pooled proteins were diluted with binding buffer (30 mmol/L Bis-Tris, 150 mmol/L NaCl, 1 mmol/L CaCl2, 1 mmol/L MnCl2, pH 7.2) and incubated with the lectins in the first affinity chromatography columns at room temperature for 2 h. After incubation, 200 mmol/L methyl-α-D-mannopyranoside was used for elution of high-mannose N-linked glycoproteins. The flowthrough of the first three-lectin column was subjected to the second chromatography for isolation of GlcNAc/sialic acid-containing N-linked glycoproteins using 200 mmol/L N-Acetyl-D-glucosamine as elution buffer. The eluted samples were desalted and concentrated by acetone precipitation.
Two-dimensional gel electrophoresis and image analysis
Two-dimensional gel electrophoresis (2-DE) was performed as previously reported[24,36]. Fifty micrograms of glycoproteins were used for the first-dimension isoelectrofocusing electrophoresis using IPG strips with a linear pH range of 3-10, followed by the second dimension separation using 15% SDSPAGE gels. Silver stained gels were scanned with an ImageScanner. Image analysis was carried out with ImageMaster 2-D Elite software 4.01.
In-gel digestion and MS identification
The excised protein spots with differential expression were reduced with DTT, alkylated with iodoacetamide, dried in a speedvac, and digested with trypsin (12.5 μg/mL in 50 mmol/L ammonium bicarbonate). LC-MS/MS analysis of tryptic peptides was performed using a Maxis Impact Q-TOF mass spectrometer (BrukerDaltonics, Bremen, Germany). The MS/MS data were searched against the SwissProt human sequence database using MASCOTviaProteinscape (BrukerDaltonics, Bremen,Germany) and reverse database searching was used for estimating the false discovery rate. All proteins were identified by ≥ 2 unique peptides.
Isobaric tags for relative and absolute quantification labeling and MS identification
Isobaric tags for relative and absolute quantification (iTRAQ) labeling of tryptic peptides was performed according to the protocol provided by the supplier. The iTRAQ labeled peptides derived from pooled protein samples of ten ESCC and adjacent non-tumor tissues as previously described in duplicate[37]were separated into 16 fractions by mixed-mode anion exchange/reverse-phase chromatography. Each fraction was dried, dissolved in 0.1% formic acid, and analyzed by LC-MS/MS using a Maxis Impact QTOF mass spectrometer (BrukerDaltonics, Bremen, Germany). Data were searched against the SwissProt human sequence database using MASCOT and expression ratios calculated by WARP-LCviaProteinscape (BrukerDaltonics, Bremen, Germany). The false discovery rate was estimated using a reverse database search strategy. All proteins were identified by ≥ 2 unique peptides. The data have been deposited at https://www.iprox.cn/ with Project ID IPX0004371000.
Functional enrichment analysis
Gene-set enrichment analyses of differentially expressed glycoproteins (DEGs) and previously identified differentially expressed proteins (DEPs)[37] were performed using Enrichment Map, which organizes the enriched gene-sets into a network with links representing the overlap of member genes[38]. The gene-sets with aPvalue < 0.001 and false discovery rate < 5% were selected for display in the enrichment map. To gain an insight into the functional makeup of DEGs and DEPs, Proteomap was used to visualize the functional distribution of DEGs or DEPs in cellular processes, including genetic information processing, metabolism, cellular processes, signaling, and others[39].
Western blot analysis
Total tissue proteins were extracted using radioimmunoprecipitation assay lysis buffer, and glycoproteins were isolated by lectin affinity chromatography. Total proteins or glycoproteins were separated by SDS-PAGE and then transferred to PVDF membranes. The blots were blocked in 5% nonfat milk, incubated with primary antibodies and then corresponding secondary antibodies, and visualized using Supersignal West chemiluminescent substrate (Pierce Biotechnology, Rockford, IL,United States). Semi-quantitation of the band intensity was performed using image analysis software and corrected by reference to GAPDH. The antibodies used in this study were: Haptoglobin (1:2000,16665-1-AP, Proteintech), cathepsin D (1:2500, ab75852, Abcam), clusterin (1:5000, 12289-1-AP,Proteintech), SOD3 (1:1500, T1799, Epitomics), PRELP (1:2000, AP6665b, Abgent), and 14-3-3-ζ (1:2500,ab85268, Abcam).
Statistical analysis
All statistical analyses were performed with SPSS 24.0 software (SPSS, Chicago, IL, United States).Comparisons of quantitated protein band density between ESCC and adjacent non-cancerous tissues were done by paired Student’st-tests or Wilcoxon signed-rank sum tests. All statistical tests were twosided, andP< 0.05 was considered statistically significant.
RESULTS
N-linked glycoprotein profiling by two-dimensional gel electrophoresis
This study utilized two rounds of multilectin affinity chromatography to isolate N-linked glycoproteins.The first multilectin affinity column comprised Con A, LCH, and GNA lectins to isolate high-mannose N-linked glycoproteins, and the second affinity column included WGA and SNA lectins for GlcNAc/sialic acid-containing glycoprotein enrichment. 2-DE was used to separate the isolated Nlinked glycoproteins. Figure 1A and B shows the representative 2-DE images of high-mannose glycoproteins isolated from ESCC and non-cancerous tissues. An average of 742 ± 45 protein spots could be detected on each 2-DE gel analyzed by Image Master 2-D Elite. A total of 35 differential protein spots with ≥ 1.5 fold-changes in protein spot intensities (P< 0.05) were identified, including 20 up-regulated and 15 down-regulated protein spots in ESCC compared with corresponding non-cancerous tissues,respectively. For GlcNAc/sialic acid-containing glycoprotein profiling, the patterns of protein spots on 2-DE gels were markedly different compared with those of high-mannose glycoproteins (Figure 1C and D). There were 23 protein spots with differential expression, including 5 up-regulated and 18 downregulated protein spots in ESCC compared to non-cancerous tissues.
These protein spots were identified by LC-MS/MS of the trypsin-digested spots excised from preparative gels. The identities of proteins are shown in Tables 1 and 2, in which 22 proteins and 23 proteins were derived from the first and second lectin affinity chromatography, respectively. Therewere six proteins in common between these two isolated fractions. In agreement with our previous reports[24,36], many gel spots were identified as the same protein, indicating the presence of different proteoforms due to post-translational modifications. Using NetNGlyc (http://www.cbs.dtu.dk/services/NetNGlyc) to predict the glycosylation sites on proteins, 72.7% (16/22) of high-mannose Nlinked glycoproteins and 56.5% (13/23) of GlcNAc/sialic acid-containing glycoproteins were found to have potential glycosylation sites, indicating some non-specific binding to lectins by non-glycosylated proteins.

Table 1 Summary of high-mannose N-linked glycoproteins in esophageal squamous cell carcinoma by 2-dimensional gel electrophoresis

(M:1206.2)932 TRFE_HUMAN Serotransferrin precursor (77/7)3.8 (↓)0.004187.0 (M:187.0)41 (630)936 HPTR_HUMAN Haptoglobin-related protein (39/6.7)1.5 (↓)0.002226.4 (M:226.4)41 (149)1000 A1AT_HUMAN Alpha-1-antitrypsin (46.7/5.3)15.2 (↓)0.0061091.2(M:1091.2)203 (70, 107, 271)1001 HPT_HUMAN Haptoglobin (45.2/6.1)9.8 (↓)0.0091054.6(M:1054.6)182 (207, 241)
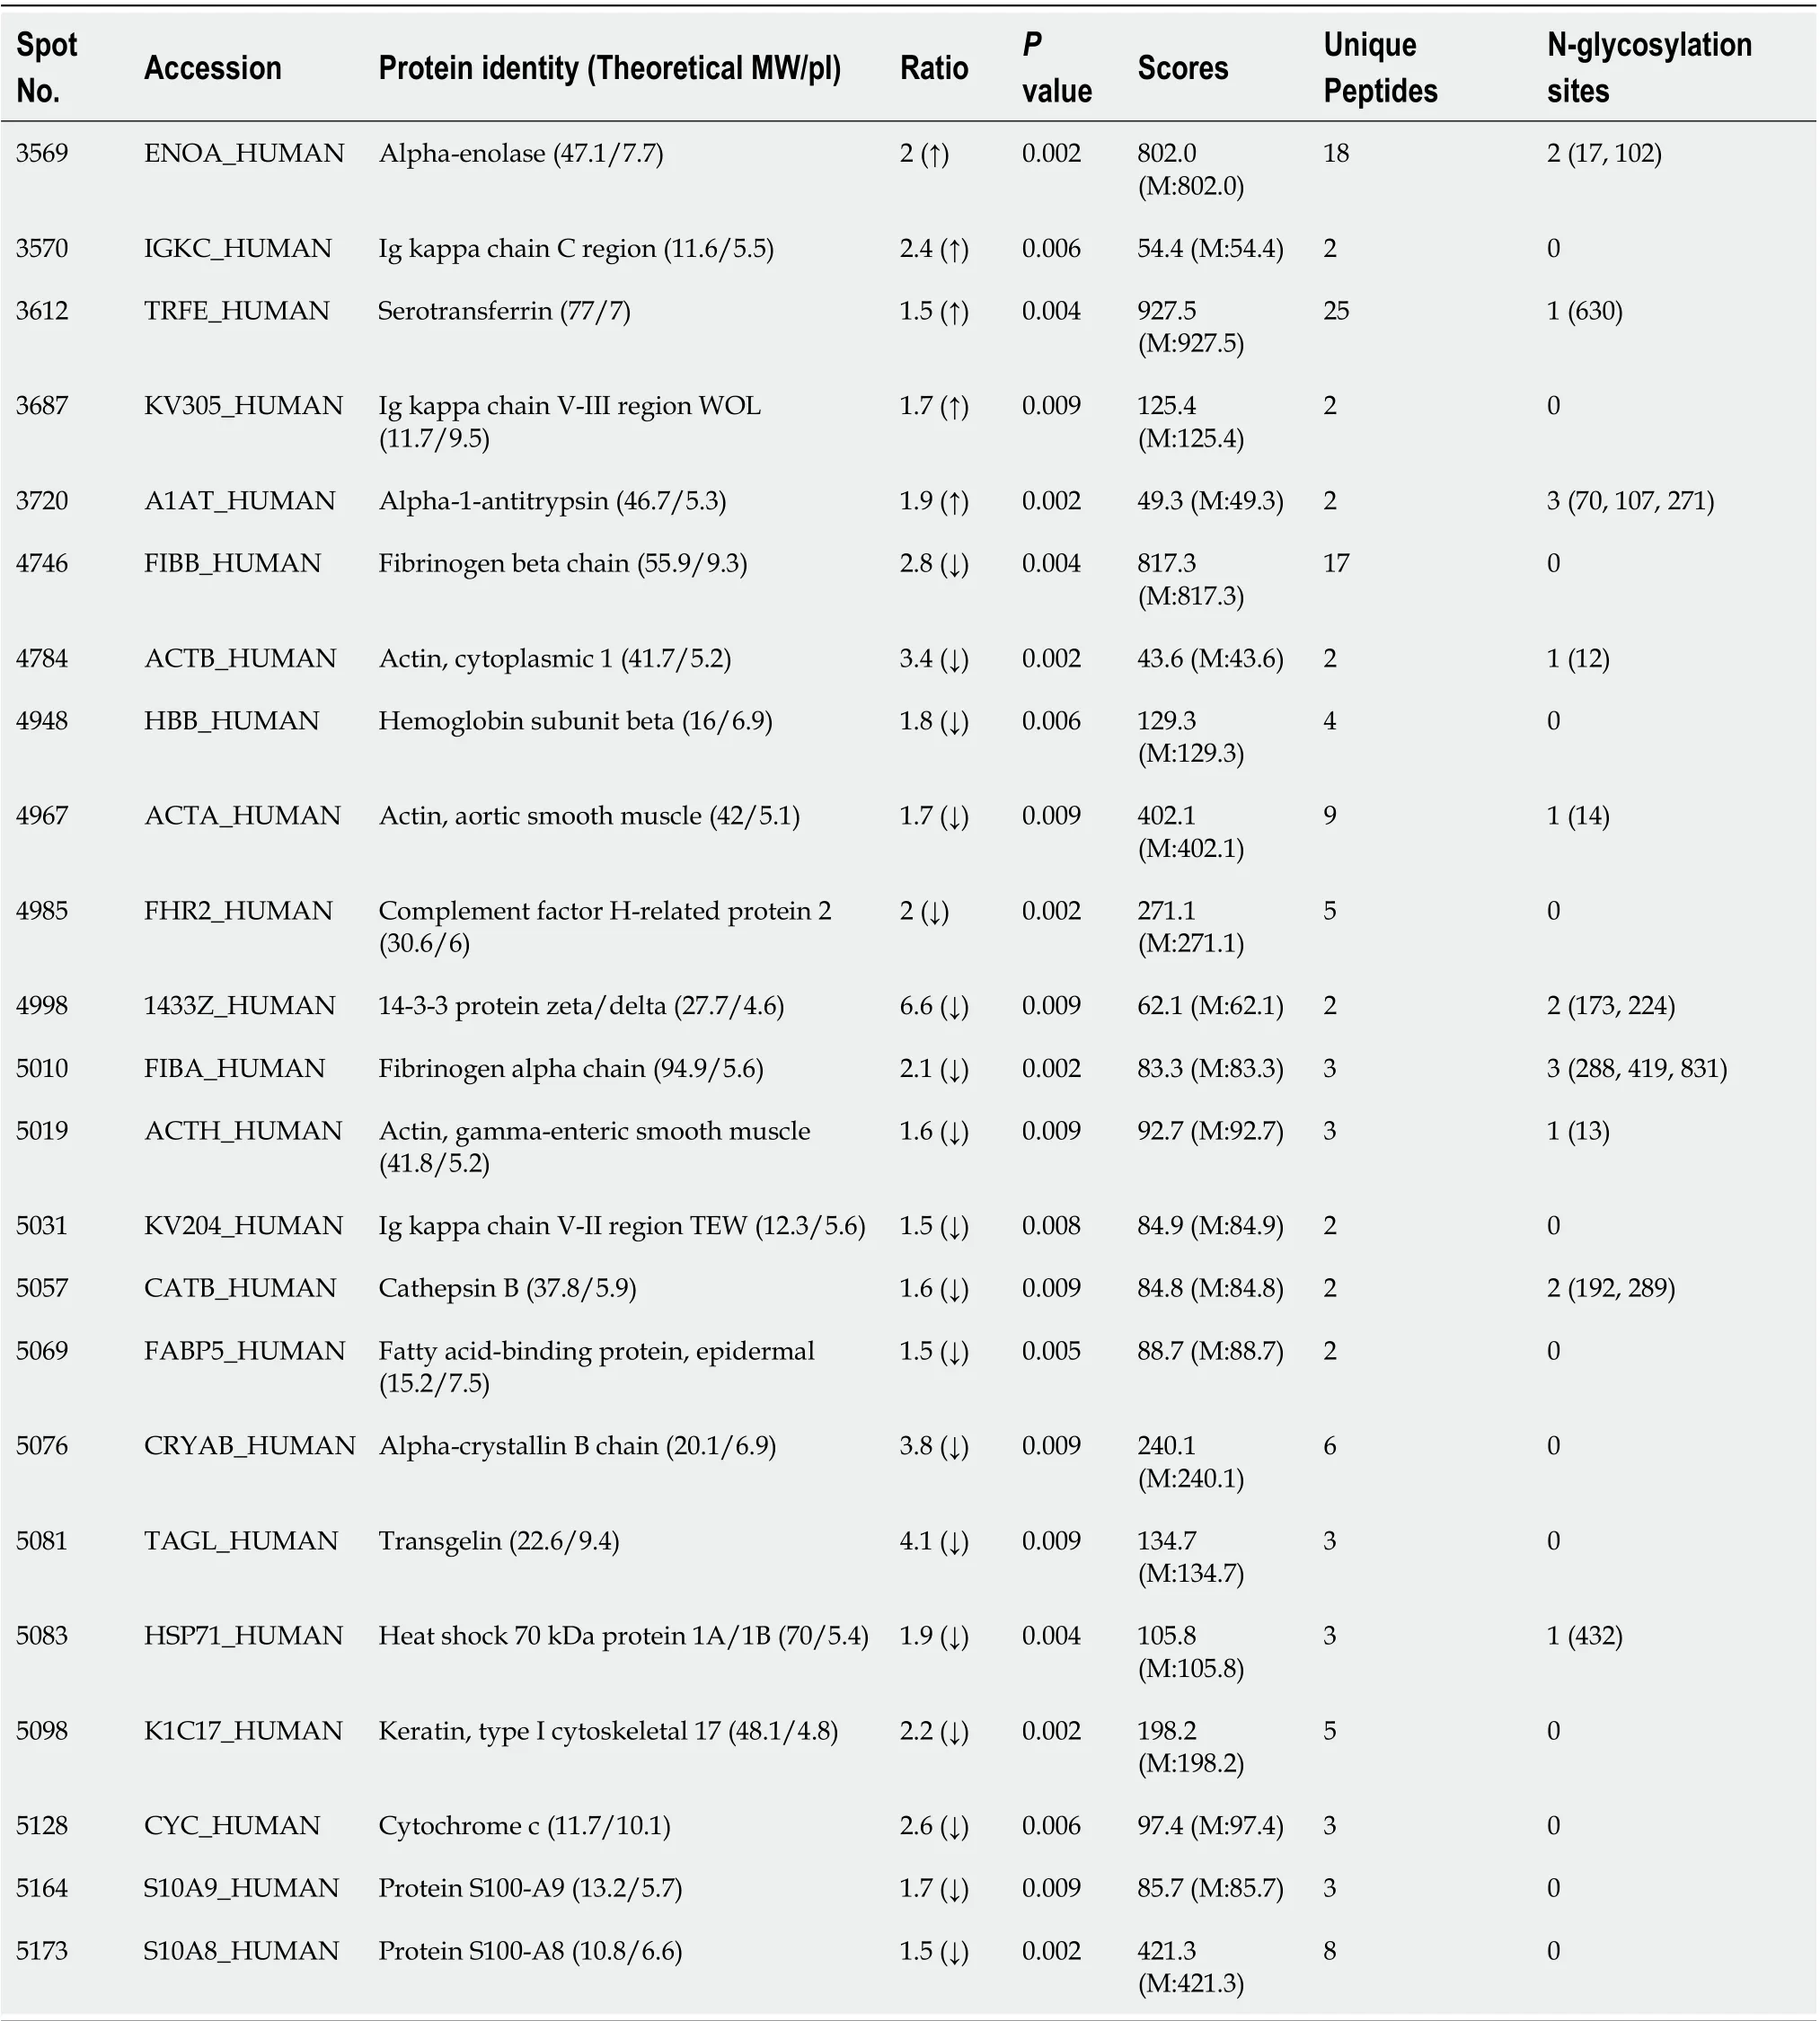
Table 2 Summary of sialic N-linked glycoproteins identified in esophageal squamous cell carcinoma by 2-dimensional gel electrophoresis
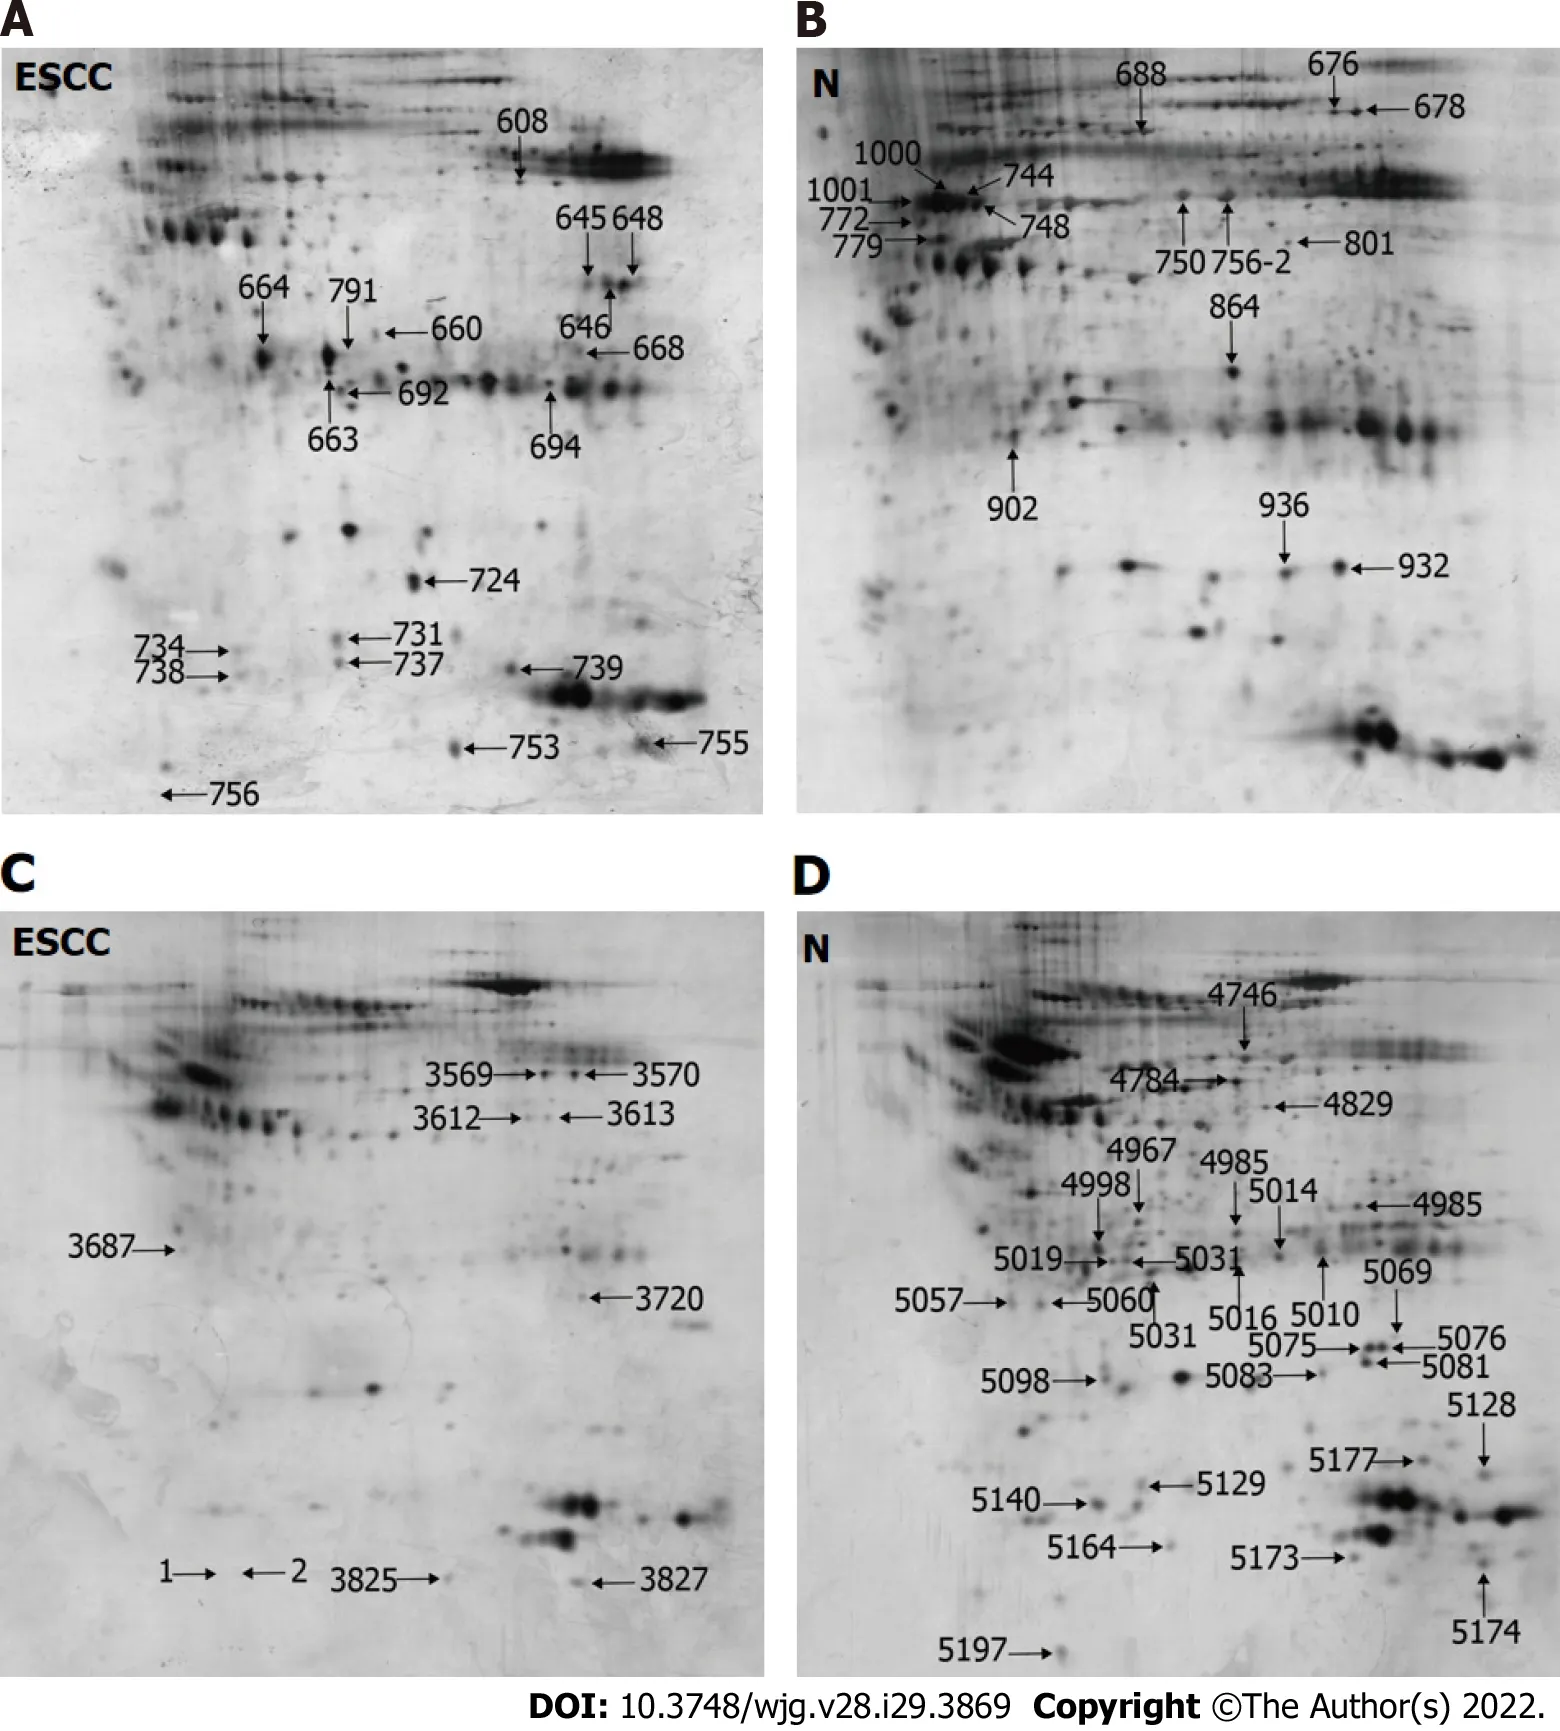
Figure 1 Representative two-dimensional gel electrophoresis images of N-linked glycoproteins from esophageal squamous cell carcinoma (ESCC) and adjacent non-cancerous tissues (N), in which the denoted numbers represent protein spots with differential expression. A and B: Representative two-dimensional gel electrophoresis (2-DE) images of high-mannose glycoproteins from ESCC (A) and N (B); C and D:Representative 2-DE images of GlcNAc/sialic acid-containing glycoproteins from ESCC (C) and N (D). ESCC: Esophageal squamous cell carcinoma; N: Noncancerous tissues.
N-linked glycoprotein profiling by iTRAQ labeling
To comprehensively characterize the N-linked glycoproteome in ESCC, we further performed iTRAQbased analysis of the N-linked glycoproteome in ESCC and non-cancerous tissues. One pair of protein pools from ten ESCC and matched non-cancerous tissues, respectively, were subjected to tandem lectin affinity chromatography enrichment, in-solution digestion with trypsin, iTRAQ labeling, and LCMS/MS identification in duplicate. In total, 1464 and 1298 proteins from the first affinity column were identified in the two technical replicates (Figure 2A, Supplementary Tables 1 and 2). Using the cut-off criteria of ≥ 2 unique peptides and a fold-change of 1.5, 189 and 138 proteins with differential expression were identified from the first and second independent pools, respectively, with 65 proteins in common,resulting in identification of 262 differentially expressed proteins in total from the high-mannose binding lectin affinity chromatography, of which 203 (77.5%) have predicted N-linked glycosylation sites (Figure 2B). For N-linked glycoproteins enriched by the downstream GlcNAc/sialic acid binding lectin chromatography, two independent iTRAQ-labeled pools produced 1174 and 936 proteins following isolation of high-mannose glycoproteins (Figure 2C, Supplementary Tables 3 and 4). There were 237 of 1174 and 154 of 936 proteins with differential expression, respectively, with 74 proteins in common (Figure 2D). A total of 317 unique proteins, of which 246 (77.6%) were predicted to be N-linked glycoproteins, were identified from the GlcNAc/sialic acid binding lectin chromatography enrichment.There were 58 overlapping glycoproteins found between 262 high-mannose glycoproteins and 317 GlcNAc/sialic acid-containing glycoproteins.
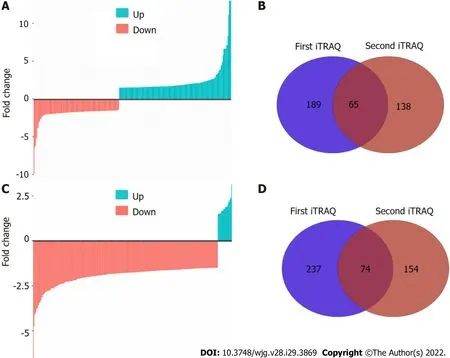
Figure 2 N-linked glycoprotein profiling by isobaric tags for relative and absolute quantification labeling and liquid chromatography electrospray ionisation tandem mass spectrometry/mass spectrometry identification. A: Waterfall plot shows the differentially expressed highmannose glycoproteins; B: Venn diagram depicts the unique and overlapped high-mannose glycoproteins identified from two independent replicates; C: Waterfall plot shows the differentially expressed GlcNAc/sialic acid-containing glycoproteins; D: Venn diagram depicts the unique and overlapped GlcNAc/sialic acid-containing glycoproteins identified from two independent replicates. iTRAQ: Isobaric tags for relative and absolute quantification.
Comparison of two-dimensional gel electrophoresis-based and iTRAQ labeling-based profiling
In this study, two protocols for identifying N-linked glycoproteins based on different quantitative methods yielded quite different results. There were only 11 high-mannose glycoproteins and 4 GlcNAc/sialic acid-containing glycoproteins in common between 2-DE-based and iTRAQ-based glycoproteomic profiling. Our results demonstrate that iTRAQ-based quantitative proteomic profiling outperformed protein spot intensity quantification by 2-DE. There were, however, common glycoproteins found by both approaches. Therefore, the combination of these four fractions produced 411 unique N-linked glycoproteins. These findings indicate that a combination of these two complementary protocols could generate a more comprehensive landscape of N-linked glycoproteome implicated in ESCC because iTRAQ-based and 2-DE-based methods were able to isolate unique glycoproteins, thus providing a good representation of the N-linked glycoproteome.
Functional analysis of differentially expressed glycoproteins
To explore the biological function of the 411 DEGs associated with ESCC, KEGG pathway enrichment analysis was initially performed using Enrichment Map. Figure 3A-C shows the 64 enriched pathways,which include complement and coagulation cascades, focal adhesion, ECM-receptor interaction, cellular interactions, immune response and infection, metabolism of fructose and mannose, glycolysis and gluconeogenesis, splicesome, and PI3K-Akt and HIF-1 signaling pathways. In addition, proteomaps were constructed to visualize the composition of these DEGs in the five functional categories, which comprise genetic information processing, environmental information processing, cellular processes,metabolism, and organismal systems. Figure 4A-C shows that the genetic information processing accounts for the largest component of the DEGs, with protein processing, translation, and transcription being the biggest contributors to this functional category. In the category of signaling events, both the up-regulated and down-regulated DEGs were involved in PI3K-Akt, MAPK, Ras, Rap1, and HIF-1 signaling pathways (Figure 4A and B). The layouts of cellular process between up-regulated and downregulated DEGs were different, with common components of exosome, lysosome, phagosome,cytoskeleton, and cell cycle, whereas the down-regulated DEGs are implicated in focal adhesion, tight junction, endocytosis, and p53 signaling pathway (Figure 4A and B). In glycolysis, there were more upregulated than down-regulated DEGs. Notably, the complement and coagulation cascades in the immune system include exclusively down-regulated DEGs (Figure 4A and B).
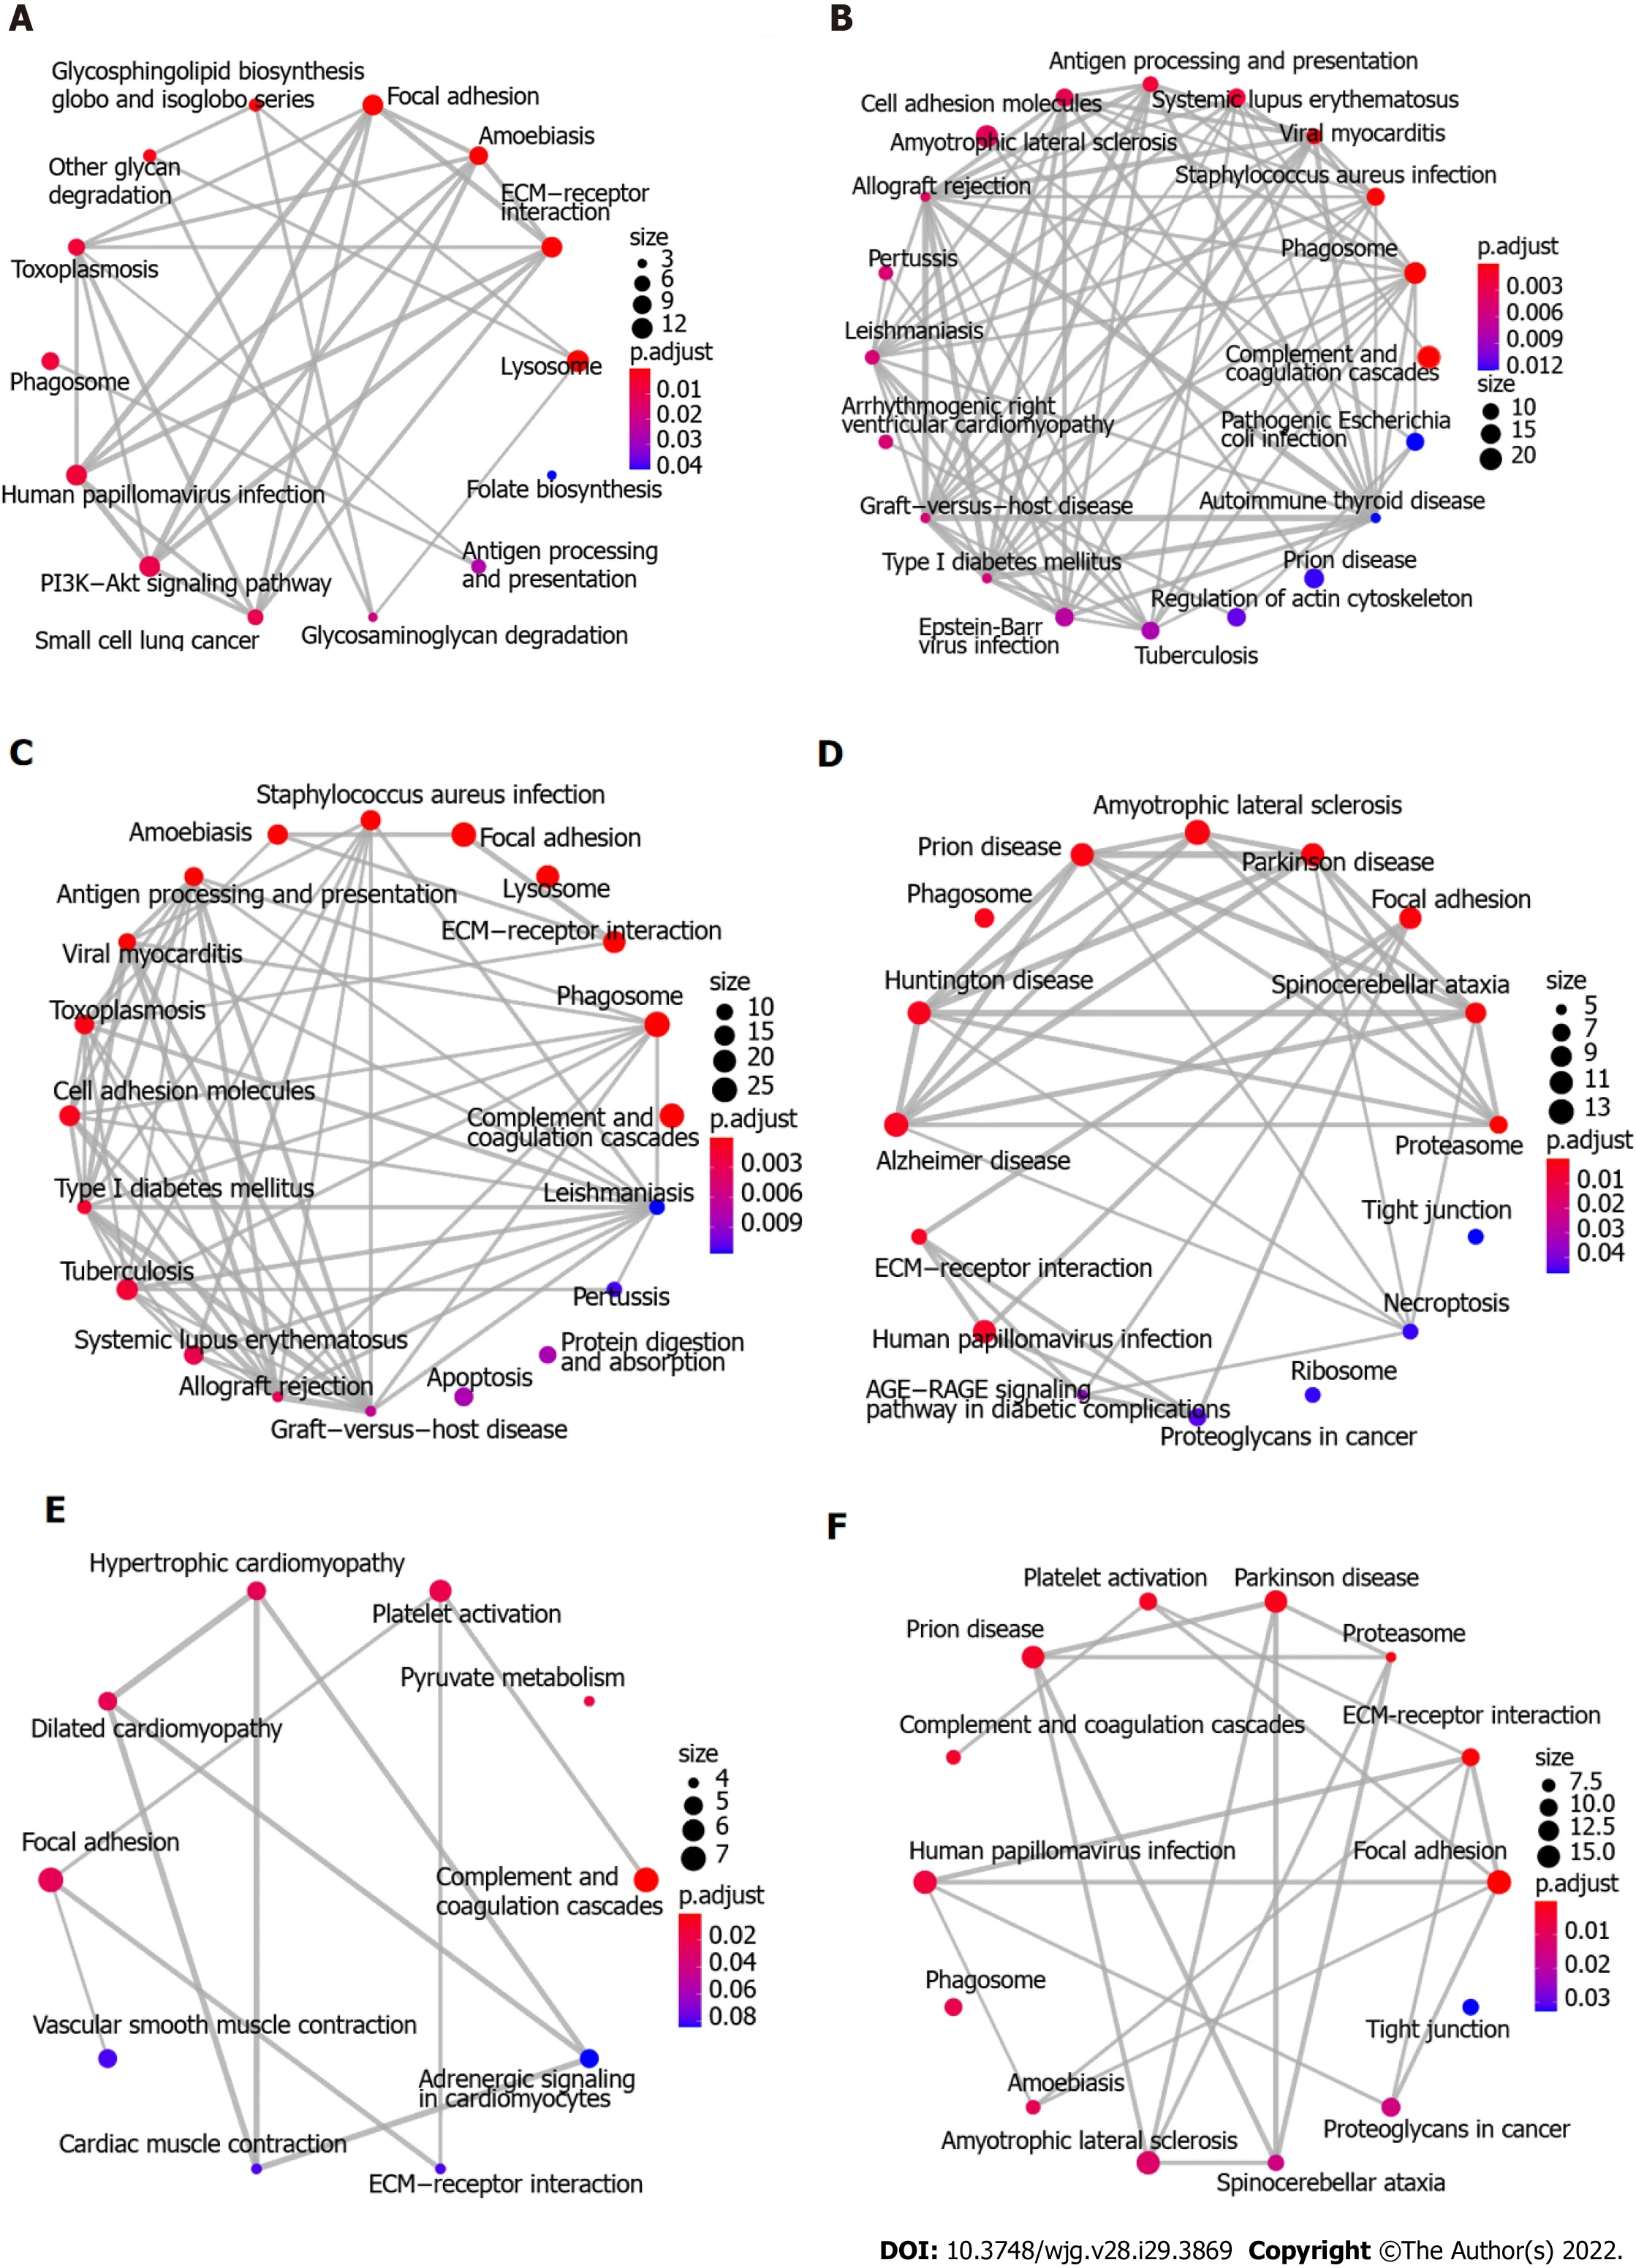
Figure 3 Functional analyses of proteins and glycoproteins with differential expression using enrichment map. A-C: Kyoto encyclopedia of genes and genomes (KEGG) pathway enrichment analysis using enrichment map shows the significantly enriched biological pathways of up-regulated differentially expressed glycoproteins (DEGs), down-regulated DEGs, and total DEGs, respectively; D-F: KEGG pathway enrichment analysis using enrichment map shows the significantly enriched biological pathways of up-regulated DEPs, down-regulated DEPs, and total DEPs, respectively. KEGG: Kyoto encyclopedia of genes and genomes; DEGs: Differentially expressed glycoproteins; DEPs: Differentially expressed proteins.

Figure 4 Functional analyses of proteins and glycoproteins with differential expression using Proteomap. A-C: Kyoto encyclopedia of genes and genomes (KEGG) pathway enrichment analysis using Proteomap shows the significantly enriched biological pathways of up-regulated differentially expressed glycoproteins (DEGs), down-regulated DEGs, and total DEGs, respectively; D-F: KEGG pathway enrichment analysis using Proteomap shows the significantly enriched biological pathways of up-regulated DEPs, down-regulated DEPs, and total DEPs, respectively. KEGG: Kyoto encyclopedia of genes and genomes; DEGs:Differentially expressed glycoproteins; DEPs: Differentially expressed proteins.
Functional comparison between glycoproteins and proteins with differential expression
Because there were only 82 overlapping proteins between DEGs and DEPs, the distinct subproteomes in each functional category may affect the structure of proteomaps. As shown in Figure 4, the compositions of proteomaps differ. In the category of genetic information processing, the chaperones, spliceosome,and peptidases are the predominant components in DEGs whereas the spliceosome, proteasome, and ribosome are the main contributors in DEPs. Although there are some signaling pathways (PI3K/Akt,MAPK, HIF1, Ras, and Rap1) in common in DEGs and DEPs, distinct components (neuroactive ligandreceptor interaction, calcium signaling pathway, GPT-binding signaling proteins, steroid hormone biosynthesis, and cytokines in DEPsvsNF kappa B pathway, FoxO pathway, ECM-receptor interaction,CD molecules, lectins, and enzyme-linked receptors in DEGs) are present in environment interaction(Figure 4C and F). Along with these differences, distinct compositions of the other three categories were found as well, in agreement with uniquely characterized proteomes. Likewise, Enrichment Map analysis showed that marked differences were found between DEGs and DEPs (Figure 3C and F). In the same line, there were remarkable distinctions between DEGs and DEPs identified using iTRAQ-based quantitation of Indian ESCC samples (data not shown)[40].
Validation of potential glycoprotein biomarkers
Western blot analysis was performed to validate the differential expression of potential glycoprotein biomarkers for ESCC, including haptoglobin, cathepsin D, clusterin, superoxide dismutase 3 (SOD3),PRELP, and 14-3-3ζ. Consistent with the corresponding protein spots of 748 and 1001 on 2-DE images,haptoglobin expression in ESCC was significantly down-regulated in tumor compared with adjacent non-cancerous tissues (Figure 5A). In contrast, the expression of procathepsin D instead of mature cathepsin D was remarkably enhanced in ESCC compared with the corresponding non-cancerous tissues (Figure 5B). There were no significant differences in the expression levels of the other four selected proteins (Supplementary Figure 1). These data suggest that the differential expression of glycoproteins identified in this study could be caused by up-regulation of protein expression, or upregulation of N-linked glycosylation due to aberrant expression or activities of certain glycosyltransfereases.
To assess the contribution of high-mannose or GlcNAc/sialic acid components attached to the selected glycoproteins, enrichment of corresponding glycoproteinsviaglycan chain binding to specific lectins was performed followed by Western blot detection. Consistent with the up-regulation of procathepsin D protein, the high-mannose subtype of procathepsin D was pronouncedly increased in ESCC as well (Figure 5C). In contrast to the expression pattern of total clusterin protein, the highmannose fraction of clusterin was markedly down-regulated in ESCC as compared with non-cancerous tissues (Figure 5C). However, the glycosylated fractions of SOD3, PRELP, and haptoglobin did not show significant differences between ESCC and non-cancerous tissues after enrichment of high-mannose glycan structure of glycoproteins using lectin affinity chromatography. In agreement with the quantitative result of glycosylated 14-3-3ζ, the GlcNAc/sialic acid-containing fraction of 14-3-3ζ was strongly reduced in ESCC (Figure 5C).
Serum levels of potential glycoprotein biomarkers
As isolation of N-linked glycoproteins from serum reduces the high-complexity of the serum proteome,we characterized the serum levels of potential glycoprotein biomarkers in patients with ESCC. As expected, the total protein levels of the six selected proteins were not significantly different in the serum of ESCC patients and healthy controls (Supplementary Figure 2). In contrast, the serum levels of glycosylated forms of clusterin, PRELP, and haptoglobin in ESCC patients were much higher than those of healthy controls (Figure 5D).
DlSCUSSlON
Aberrant glycosylation of proteins, which is not correlated with mRNA levels, has been linked to a variety of cancers and reflects disease status and progression[20,41-44]. MS-based proteomics and glycomics hold considerable potential to identify novel glycosylation-based biomarkers. To the best of our knowledge, this study is the first to use tandem lectin affinity chromatography to enrich N-linked glycoproteins, followed by 2-DE-based and iTRAQ labeling-based proteomic quantitative profiling, and protein identification by MS. In total, 411 differentially expressed N-linked glycoproteins were identified, including 128 up-regulated and 283 down-regulated DEGs. These DEGs provide the scientific community a dataset of glycoproteins associated with ESCC for in-depth investigation.
Depending on the linkage of carbohydrate to the protein backbone, glycoproteins fall into two main types, N-glycosylated and O-glycosylated, in which glycans are covalently attached to the amide nitrogen of asparagine residues and to the hydroxyl group of serine or threonine residues, respectively[45]. Lectins are defined as proteins that bind to the particular oligosaccharide epitope structures attached to proteins or lipidsviaselective affinities[46]. Due to these natural features, lectins are frequently used to isolate glycoproteins from a variety of origins, in particular from blood, to reduce sample complexity and to enrich low-abundance proteins. Using three lectins in parallel,i.e., ConA,WGA, and Jacalin, a total of 423 proteins were fractionated from membrane proteins, among which 202(71%) have predicted N-linked glycosylation sites[47]. As expected, there were unique and shared proteins enriched by these three lectins. To comprehensively isolate N-linked glycoproteins involved in ESCC, five lectins allocated to two sequential affinity chromatographies were used in this study to increase the coverage of captured N-linked glycoproteins. In addition, two complementary methods for quantitative profiling of enriched glycoproteins were used. In total, 262 and 317 nonredundant DEPs were identified by iTRAQ labeling-based profiling from the first and second lectin affinity chromatography, respectively. 2-DE-based MS/MS profiling led to fewer DEPs being identified compared with the iTRAQ labeling-based approach. Under a high stringency of selection criteria (foldchange ≥ 1.5,unique peptides ≥ 2), 519 proteins were identified in total, of which 402 (77.5%) carry predicted N-linked glycosylation sites. Identification of a large number of proteins without predicated glycosylation sites indicates the existence of non-specific binding to certain lectins needing further in-depth study to elucidate.
Functional analysis based on KEGG pathway annotations by Proteomap revealed that there were striking differences in the compositions of DEGs distributed in five functional entities. In line with previous findings, the DEGs in genetic information processing account for the largest fraction of Nlinked glycoproteome, supporting the survival and rapid growth of cancer cells[39]. In further support of this, a number of signaling pathways, including PI3K-Akt, MAPK, Rap1, and HIF-1 pathways, which play important roles in oncogenesis and progression, were significantly enriched. In metabolism,glycolysis was significantly enriched in DEGs identified in this study. The increased rate of glucose metabolism and aerobic glycolysis, also known as the Warburg effect, are recognized hallmarks of cancer[48]. In agreement with this, HIF signaling proteins were over-represented in ESCC and may contribute to increased glycolysis. Besides energy generation, aerobic glycolysis enhances rapid growth and unlimited proliferation of cancer cells through providing precursors for certain biosynthetic processes as well as alteration of the tumor microenvironment[49]. Moreover, extracellular lactate has inhibitory effects on human cytotoxic T lymphocytes[50,51]. Furthermore, metabolic phenotype of cancer stem cell seems distinct from bulk cancer cells and is characterized by glycolysis and/or XoPhos[49]. The increased expression of fructose-bisphosphate aldolase A, triosephosphate isomerase, alphaenolase, all-trans-retinol dehydrogenase [NAD(+)] ADH1B, and glyceraldehyde-3-phosphate dehydrogenase in ESCC may contribute to the progression of ESCCviaincreased glycolysis and could serve as therapeutic targets for the management of ESCC. All together, these distinct functional categories and related effector molecules may represent potential therapeutic targets in ESCC.
Cathepsin D, a lysosomal protease, is expressed in nearly all cells and tissues of mammals. However,pro-cathepsin D but not mature cathepsin D is reportedly associated with the development and progression of a variety of cancers[52]. In line with up-regulation of ConA-binding cathepsin D and procathepsin D, glycosylated procathepsin D was increased in ESCC as well, suggesting it as a potential biomarker for ESCC. In addition, we also demonstrated that both total haptoglobin and N-linked haptoglobin in serum were differentially expressed in ESCC, as seen in other malignancies[41,53,54].Although there were no alterations in the levels of total protein expression, the high-mannose clusterin and sialic acid glycoforms of 14-3-3ζ were down-regulated in ESCC but need further study to characterize their glycan moieties. After probing the serum levels of these candidate biomarkers, we provide several potential biomarkers for ESCC diagnosis. Additionally, our findings reveal that differential protein expression is a confounding factor for identification of aberrant glycosylation.
The current study has several limitations. First, the main limitation is that sample pooling used in this study may cause a loss of inter-individual information. However, this is partly compensated by the validation of candidate biomarkers using individual tissue samples. Second, affinity chromatography comprising multiple lectins for glycoprotein isolation yielded different subglycoproteomes. Further studies should characterize the composition and structure of glycans associated with proteins.Nevertheless, our study represents, to our knowledge, the first study to characterize the glycoproteome associated with ESCC, and thus provides the scientific community a resource of glycoproteins for indepth investigation.
CONCLUSlON
In conclusion, this study catalogued a total of 411 N-linked glycoproteins implicated in ESCC after glycoprotein enrichment using two stage multilectin affinity chromatography and MS/MS identification. Proteomap analysis revealed the distribution of differential glycoproteins in five functional categories. A preliminary validation demonstrated the differential expression of glycoprotein biomarker candidates, including total procathepsin D and haptoglobin in ESCC, high-mannose fractions of procathepsin D, clusterin and sialiated 14-3-3ζ in ESCC, and glycosylated fractions of clusterin, PRELP,and haptoglobin in serum. Consequently, this study yielded a comprehensive landscape of N-linked glycoproteome associated with ESCC for further characterization.
ARTlCLE HlGHLlGHTS

Research methods
N-linked glycoproteins were isolated from ESCC and adjacent non-tumor tissue samples using multilectin affinity chromatography. Two-dimensional gel electrophoresis (2-DE)-based and isobaric tags for relative and absolute quantification (iTRAQ) labeling-based mass spectrometry quantitation were performed in parallel to profile the N-linked glycoproteome in ESCC, followed by validation of candidate glycoprotein biomarkers using Western blot.
Research results
A total of 411 differentially expressed N-linked glycoproteins (DEGs) with potential glycosylation sites on proteins were identified by 2-DE-based and iTRAQ labeling-based quantitation, demonstrating the outperformance of iTRAQ labeling-based quantitation over 2-DE. These DEGs exhibited distinctive compositions in functional categories from differentially expressed proteins in ESCC. Western blot analysis validated the up-regulation of total procathepsin D and high-mannose procathepsin D, and the down-regulation of total haptoglobin, high-mannose clusterin, and GlcNAc/sialic acid-containing fraction of 14-3-3ζ in ESCC tissues. The serum levels of glycosylated fractions of clusterin, prolinearginine-rich end leucine-rich repeat protein, and haptoglobin in patients with ESCC were remarkably higher than those in healthy controls.
Research conclusions
This study identified the aberrant N-linked glycoproteome associated with ESCC, which will be a valuable resource for future investigations.
Research perspectives
In-depth characterization of the composition and structure of glycans associated with proteins can shed more lights on biological insights and clinical relevance of the identified DEGs in ESCC.
FOOTNOTES
Author contributions:Qi YJ and Gao SG designed and coordinated the study; Liu QW, Ruan HJ, Chao WX, Li MX,Jiao YL, and Ward DG performed the experiments, and acquired and analyzed the data; Qi YJ and Ward DG wrote the manuscript; and all authors approved the final version of the article.
Supported byNational Natural Science Foundation of China, No. 81072039 and No. 81872037.
lnstitutional review board statement:The study was approved by the Ethics Committee of the Medical School, Henan University, China (ethics ref: 108) and conducted in accordance with the ethical guidelines of the 1975 Declaration of Helsinki.
Conflict-of-interest statement:All authors report no relevant conflicts of interest for this article.
Data sharing statement:No additional data are available.
Open-Access:This article is an open-access article that was selected by an in-house editor and fully peer-reviewed by external reviewers. It is distributed in accordance with the Creative Commons Attribution NonCommercial (CC BYNC 4.0) license, which permits others to distribute, remix, adapt, build upon this work non-commercially, and license their derivative works on different terms, provided the original work is properly cited and the use is noncommercial. See: https://creativecommons.org/Licenses/by-nc/4.0/
Country/Territory of origin:China
ORClD number:Qi-Wei Liu 0000-0002-7874-4056; Hao-Jie Ruan 0000-0002-3201-3864; Wei-Xia Chao 0000-0003-0700-658X; Meng-Xiang Li 0000-0002-6987-545X; Ye-Lin Jiao 0000-0002-4920-0738; Douglas G Ward 0000-0002-2328-1445; She-Gan Gao 0000-0002-7720-8729; Yi-Jun Qi 0000-0003-0239-5862.
S-Editor:Ma YJ
L-Editor:Wang TQ
P-Editor:Qi WW
 World Journal of Gastroenterology2022年29期
- World Journal of Gastroenterology的其它文章
- Mechanistic and functional extrapolation of SET and MYND domain-containing protein 2 to pancreatic cancer
- Clinical challenge for gastroenterologists-Gastrointestinal manifestations of systemic mastocytosis: A comprehensive review
- Structural changes of proteins in liver cirrhosis and consequential changes in their function
- Epidemiologic and socioeconomic factors impacting hepatitis B virus and related hepatocellular carcinoma
- Enhanced endoscopic ultrasound imaging for pancreatic lesions: The road to artificial intelligence
- Qingyi decoction attenuates intestinal epithelial cell injury via the calcineurin/nuclear factor of activated T-cells pathway