
Involvement of nitrergic neurons in colonic motility in a rat model of ulcerative colitis
2022-08-12 08:10YanRongLiYanLiYuanJinMangXuHongWeiFanQianZhangGuoHeTanJingChenYunQingLi
World Journal of Gastroenterology 2022年29期
Yan-Rong Li, Yan Li,Yuan Jin, Mang Xu, Hong-Wei Fan, Qian Zhang, Guo-He Tan, Jing Chen, Yun-Qing Li
Abstract
Key Words: Nitrergic neurons; Nitric oxide; Nitric oxide synthase; Ulcerative colitis; Colonic motility;Colonic myenteric plexus
lNTRODUCTlON
Ulcerative colitis (UC) is a nonspecific inflammatory disorder of the intestine that primarily involves the rectum, sigmoid colon, and/or, the whole colon, in severe cases. Clinical features include recurrent episodes of abdominal pain, diarrhea, and mucopurulent stools[1]. Unfortunately, the disease course is permanent and causes great suffering to the patients. UC can occur at any age (mainly in young adults),and in recent years, its incidence has increased worldwide[2]. The etiology of UC is complex, and its pathogenesis might be related to genetics[3], immunological factors, psychiatric depression and anxiety[4], environmental factors[5], dietary allergy, intestinal flora[6], and other factors. Therefore, it leads to treatment difficulty and a prolonged treatment course, and recurs easily. Although current pharmacological treatments in the clinic might improve patient’s symptoms, they still cannot achieve satisfactory results. In recent years, the research on the aspects of gastrointestinal (GI) motility disorders in UC patients has advanced, and the abnormal intestinal dynamics has become a focus of research on the pathogenesis of UC [7-9].
The enteric nervous system (ENS), including the submucous plexus (SP) and myenteric plexus (MP)[10,11], as an essential component of the peripheral nervous system (PNS), is independent of the central nervous system (CNS) and is involved in the regulation of intestinal secretion, absorption, and motility[12]. Neurons in the ENS, depending on their neurotransmission function, are divided into sensory neurons, motor neurons, and interneurons. Further, motor neurons are divided into excitatory and inhibitory ones, regulating the systolic and diastolic function of the intestine, respectively. Typically, the ENS plays a vital role in maintaining gut homeostasis; however, gut motility gets impaired once the relaxation and contraction functions of the gut become imbalanced.
As the primary inhibitory gas neurotransmitter within the ENS, nitric oxide (NO) regulates several GI functions, such as vascular permeability, mucosal defense, immune regulation, and GI motility[13].Nitric oxide synthase (NOS), the rate-limiting enzyme of NO synthesis, is widely distributed in endothelial cells, macrophages, neuro-phagocytes, and neuronal cells. NOS can be divided into neural NOS (nNOS), endothelial NOS (eNOS), and inducible NOS (iNOS). Out of these, nNOS is located within the nervous tissue of both the CNS and PNS. NO is one of the major inhibitory neurotransmitters of non-adrenergic noncholinergic (NANC) nerves in the ENS and its release by NOS-positive neurons plays an essential role in stimulating GI secretion and relaxing GI smooth muscle. Changes in the NOS expression level cause alterations in GI motility; however, the impact of such changes in UC on colonic motility has not been clearly defined. Therefore, this study aimed to observe the changes of NOS within the colonic MP in dextran sulfate sodium (DSS)-induced UC rats, to further understand the underlying mechanisms of colonic motility in UC for delineating a new direction for the treatment of UC.
MATERlALS AND METHODS
Reagents
Dextran sulfate sodium (DSS; PC-99017), NG-monomethyl-L-arginine monoacetate (L-NMMA; PC-45273), and thrombin derived polypeptide 508 trifluoroacetic acid (TP508TFA; PC-50991) were purchased from PlantChemMed Co., Ltd (Shanghai, China). Rabbit Anti-HuD + HuC (ab184267) and Goat Anti-nNOS (ab1376) were purchased from Abcam (Cambridge, United Kingdom). Donkey Anti-Goat Alexa Fluor 488 (a11055) and Donkey Anti-Rabbit Alexa Fluor 594 (A21207) were purchased from Invitrogen Co., Ltd (Carlsbad, United States). Mouse Anti-β-Actin monoclonal antibody (A1978) and Immobilon Forte western HRP substrate (Cat. No. WBLUF0020) were purchased from Merck KGaA(Darmstadt, Germany). HRP-Labeled Goat Anti-Rabbit IgG (H + L) (ZB-2306) and HRP-Labeled Goat Anti-Mouse IgG (H + L) (ZB-2305) were purchased from ZhongShan GoldBridge Biotechnology Co., Ltd(Beijing, China). SDS-PAGE Gel Preparation Kit (P0012A) was purchased from Beyotime Biotechnology Co., Ltd (Shanghai, China). BCA Protein Concentration Assay Kit (AR0146) was purchased from BOSTER Biological Technology Co., Ltd (Wuhan, China). NOS1/nNOS ELISA Kit (E-EL-R1438C) were purchased from Elabscience Biotechnology Co., Ltd (Wuhan, China). All other reagents and chemicals used in this study are commercially available.
Animals and animal tests
Thirty-two 8-wk-old male Sprague-Dawley rats weighing 200 ± 20 g were housed in a specific pathogenfree animal house. The animals were kept at a standard room temperature of 24 °C, with 40%-60%relative humidity, 12 h light-dark alternation, and a standard laboratory diet containing 23% protein and water. All animals were provided by the Animal Center of the Fourth Military Medical University and divided into four major groups. All experimental procedures were conducted in accordance with the Principles of Laboratory Animal Care and approved by the University Ethics Committee and performed as per institutional guidelines. Efforts were made to minimize the number of animals used.The rats were randomly divided into four groups (n= 8/each group), including the control (CG), UC(EG1), UC + NOS agonist TP508TFA (EG2), and UC + NOS inhibitor L-NMMA (EG3) groups. The CG group was housed as described above, whereas the animals in the three experimental groups (EG1-3)were given tap water containing 5.5% DSS. The CG group was fed in the same way as the experimental groups except that DSS was not added in the tap water. All animals were given free access to water for 7 d, and the water was changed to tap water at day 15. Further, EG2 rats were treated with 3 mL of 0.01 mmol/L TP508 TFA i.g. daily for 15 d and EG3 rats were treated with 3 mL of 0.01 mmol/L L-NMMA i.g. daily for 15 d. Animals were regularly monitored for the general conditions, body weight, stool characteristics, occult blood, and hematochezia for the evaluation of the disease condition. The scoring criteria of the disease activity index (DAI) were as follows[14]: Body weight: No loss, 0 points; loss by 1%-5%, 1 point; loss by 6%-10%, 2 points; loss by 11%-15%, 3 points; loss by more than 15%, 4 points;stool characteristics: Normal (well-shaped), 0 points; bondless (mushy and semi-formed stool that does not adhere to the anus), 2 points; loose (watery stool that can adhere to the anus), 4 points; fecal occult blood or macroscopic hematochezia: Normal, 0 points; occult blood (+), 2 points; macroscopic hematochezia, 4 points. DAI score was calculated as equal to the average value of the sum of the above scores.
Rats in each group were individually subjected to the open field test on day 14 of the experiment. The rats were randomly placed into boxes with a height of 30-40 cm and a length of 100 cm on the bottom side. The box's inner walls were darkened, and the bottom surface was divided on the average 25 squares (4 cm × 4 cm) with a digital camera set 2 m above each side. The data was acquired automatically and recorded for 15 min. This technique was used to test the spontaneous activity of the animals and their anxious behavior in an open environment.
On the 15thday of the experiment, rats in each group were anesthetized with an intraperitoneal injection of 7% chloral hydrate (0.4 mL/100 g). The whole colon was removed to compare the colon length for rats in each group.
Histological evaluation of the colon
Eight rats in each group were used for histological evaluation of the colon. Following the whole colon removal, the intestinal lumen was flushed using 0.01 mmol/L PBS buffer, and transected 6-9 cm from the anus. Colons were fixed in 4% paraformaldehyde, dehydrated in graded alcohols, and then embedded in the paraffin. The block was cut into 5 μm thick sections and hematoxylin-eosin stained.Afterwards, the slides were mounted with neutral gum and dried at 37 °C overnight. A whole slide was observed under a scanning biomicroscope (SLIDEVIEW VS200, Olympus, Tokyo, Japan). Histological changes were recorded based on the staining results, and the histological index (HI) scoring was performed, with the following criteria[15]: 0 points for no damage; 1 point for disappearance of basal 1/3 crypts; 2 points for disappearance of basal 2/3 crypts; 3 points disappearance of crypts with intact epithelial cells; and 4 points for crypt and epithelial cell disappearance.
Immunofluorescence histochemical staining
The distal colons of eight rats in each group were dissected separately. The intestinal lumens were flushed in 0.01 mol/L PBS buffer, then a colonic strip with a width of approximately 0.5-1.0 cm was cut along the travel direction of the circular muscle (CM). Afterwards, the dissected colon was fixed in 4%paraformaldehyde. The mucosal layer was fixed upward and horizontally in PBS buffer (pH = 7.4). The mucosal, submucosal, and CM layers were removed with the help of filament forceps to preserve the longitudinal muscle (LM) layer. The tissues were blocked in 10% donkey serum for 30 min and then incubated with Rabbit-Anti-HuD + HuC (1: 500) and Goat-Anti-nNOS (1: 300) in a shaker overnight at 4°C. Slides were incubated with Donkey Anti-Goat Alexa Fluor 488 (1: 500) and Donkey Anti-Rabbit Alexa Fluor 594 (1: 500) for 4 h. Eight different fields (approximately 1.0 cm × 1.0 cm) of the specimens were observed using confocal microscopy (FV-1000, Olympus, Tokyo, Japan) with the appropriate laser beams and filter settings for Alexa 488 (excitation, 488 nm; emission, 510-530 nm) and Alexa 594(excitation, 543 nm; emission, 590-615 nm). Digital images were captured with an FV10-ASW 4.2 from Olympus, and these images eventually saved as TIFF files to calculate changes in the proportion of colon nitrergic neurons.
Western blot analysis
Four rats in each group were anesthetized and perfused with pre-cooled PBS buffer, and the terminal colon was transected. The mucosa and submucosa were separated with silk tweezers. The muscle layer was put into a pre-cooled EP tube. The tissue was homogenized using an ultrasonic grinder, in the lysis buffer (RIPA: protease inhibitor: phosphatase inhibitors = 100:1:1). After standing for 10 min on ice, the supernatant was centrifuged at 12000 rpm (10008 ×g) for 10 min. The protein concentration was measured using a BCA protein concentration assay kit and FC microplate reader (1410101, Thermo Fisher Scientific, Shanghai, China). The protein samples were kept at -80 °C for further use.
Gels were made using the SDS-PAGE gel preparation kit, and the samples were electrophoresed at a constant voltage of 80 and 120 V. Membrane transfer was achieved at a constant current of 300 mA.First, the PVDF membranes were blocked with Western blocking solution (P0252, Beyotime Biotechnology Co., Ltd., Shanghai, China) for 15 min and then incubated with Rabbit Anti-nNOS (1:1000) and Anti-β-Actin antibody (mouse monoclonal; 1:5000) on a shaker overnight at 4 °C. The PVDF membranes were then incubated with HRP-labeled Rabbit Anti-Goat IgG (H + L) (1:10000) and HRP-labeled Goat Anti-Mouse IgG (H + L) (1:10000) for 2 h. After three rinses (10 min each) in TBST, the membranes were probed by ImmobilonTMWestern chemiluminescent HRP substrate (WBKLS0050, Merck KGaA,Darmstadt, Germany) and placed into ECL for the detection. The proteins were analyzed using Image-Pro Plus software (Image-Pro Plus Version 6.0, Media Cybernetics, Maryland, United States).
ELISA
Whole blood from four rats in each group were kept for 2 h at room temperature and then centrifuged at 3800 rpm (1000 ×g) for 20 min, followed by the removal of supernatant. Next, the terminal colon tissues were grounded and disrupted with an appropriate volume of PBS (usually at a weight to volume ratio of 1:9), homogenized using a glass homogenizer, and then centrifuged at 8460 rpm (5000 ×g) for 5 to 10 min. Afterwards, the supernatant was collected. The NOS1/nNOS ELISA kit was used to determine the concentration of NOS in the colon as well as in the serum.
In vitro gut colonic tension detection
Four rats in each group were used to explore the changes ofin vitrogut colonic tension, including eight circular and eight longitudinal colon muscle strips. Rats were anesthetized, and the abdominal cavity was exposed. Then, the intestinal tube was carefully separated with the forceps and quickly freed. The colon was excised and placed in Krebs' fluid at 37 °C with a continuous supply of 95% O2and 5% CO2mixture. Then, 3 mm × 10 mm circular and LM strips were cut, where both ends were anchored to tension receptors and platinum rings at the lower end, respectively. The signals acquired by the tension receptors were recorded and processed with a multi-channel physiological signal acquisition and processing system (RM6240E, INSTRUMENT FACTORY, Chengdu, China). The mean amplitude of spontaneous contractions was recorded in circular and LM strips obtained from control and UC rats at rest, when the muscle strips were allowed to rest in the incubation solution for 30 min. After 10 min of recording, TP508TFA (1 × 10⁻⁴mol/L) was added to the bath of the UC group, and the mean amplitude changes of circular and LM strips were recorded, respectively. The liquid in the bath was replaced after 10 min, and the bath was washed. After resting for 30 min, L-NMMA (1 × 10⁻⁴mol/L) was added, and the corresponding mean amplitude changes were re-recorded.
Statistical analysis
SPSS version 23.0 statistical software (SPSS Inc, Chicago, United States) was used for statistical analyses.Data are expressed as the mean ± SD, and comparisons between groups were performed by one-way ANOVA. APvalue of < 0.05 was considered statistically significant.
RESULTS
DAI scores
Sloth, anorexia, emaciation, decreased fur gloss, and higher stool frequency were found in all EG rats,with some developing mucopurulent bloody stools. From days 0 to 5, animals in all groups gained weight (CG group: 28.90 ± 2.43 g; EG1 group: 18.10 ± 3.23 g; EG2 group: 17.00 ± 6.17 g; EG3 group: 21.80± 3.63 g). The body weight of rats in each group was not significantly different (P> 0.05); however, the body weight of rats in the EG1-3 groups began to decrease from day 6. Until day 15, the CG group(116.60 ± 2.76 g) and EG2 group (58.60 ± 7.79 g) gained weight, while the EG1 group (26.00 ± 3.69 g) and EG3 group (60.40 ± 3.99 g) lost weight. The decrease in body weight was statistically significantly different between the EG groups and CG group (P< 0.05); the differences in weight change between the EG2-3 groups and EG1 group were also statistically significant (P< 0.05) (Figure 1A). As for the stool profiles of all the groups, two rats in the CG group exhibited bondless and loose stools without hematochezia. For the EG1 group, it took 3.25 ± 0.31 d to the occurrence of loose stools, 3.37 ± 0.37 d to fecal occult blood, and 4.12 ± 0.39 d to macroscopic hematochezia; the corresponding values in the EG2 and EG3 groups were 3.85 ± 0.50 d, 4.00 ± 0.37 d, and 4.62 ± 0.41 d, and 2.87 ± 0.29 d, 2.62 ± 0.26 d, and 3.37 ± 0.32 d, respectively. Regarding the DAI scores, no statistically significant differences was found from day 0 to day 5 for any group (P> 0.05). After day 5, the intergroup differences in DAI scores were significantly increased. The DAI scores were (0.12 ± 0.12), (3.15 ± 0.11), (2.67 ± 0.12), and (3.69 ± 0.15) for the CG, EG1, EG2 and EG3 groups, respectively, at day 15. Moreover, the scores were significantly different between the EG groups and CG group (P< 0.0001), and between the EG2-3 groups and EG1 group (P <0.05) (Figure 1B).
Comparison of colon length and behavior
The colonic morphology of rats from each group was compared during the dissection (Figure 2A).Compared with the CG group, the colon length in the EG groups showed various degrees of shortening,and the differences were statistically significant (P< 0.0001). The difference was also significant between the EG2-3 groups and EG1 group (P< 0.05) (Figure 2B).

Figure 1 Disease activity of animals in each group. A: Body weight changes of rats. The differences in body weight were statistically significant between EG groups and CG group (aP < 0.05), and between EG2-3 groups and EG1 group (cP < 0.05); B: Disease activity index scores. The differences were significant between EG groups and CG group (bP < 0.0001), and between EG2-3 groups and EG1 group (aP < 0.05). CG: Control group; UC: Ulcerative colitis; NOS: Nitric oxide synthase; L-NMMA: NG-monomethyl-L-arginine monoacetate; EG1: UC group; EG2: UC + NOS agonist TP508TFA group; EG3: UC + NOS inhibitor L-NMMA group;DAI: Disease activity index.

Figure 2 Colon length in each group and results of the open field test. A: Colon length of rats in the four groups; B: Comparison of colon length in CG(19.71 ± 0.11 cm), EG1 (16.59 ± 0.35 cm), EG2 (17.80 ± 0.19 cm), and EG3 (15.11 ± 0.44 cm) groups. There were statistically significant differences between EG groups and CG group (bP < 0.0001), and between EG2-3 groups and EG1 group (aP < 0.05); C: Movement trajectories of rats. a: CG; b: EG1; c: EG2; d: EG3; D:Results of the open field test. There were statistically significant differences between EG groups and CG group (bP < 0.0001), and between EG2-3 groups and EG1 group (aP < 0.05). CG: Control group; UC: Ulcerative colitis; NOS: Nitric oxide synthase; L-NMMA: NG-monomethyl-L-arginine monoacetate; EG1: UC group; EG2:UC + NOS agonist TP508TFA group; EG3: UC + NOS inhibitor L-NMMA group.
On the 14th day of the experiment, the behavior of rats was examined using an open field test. The number of times that the rats passed through the center of an open box within 15 min period is shown as follows: 30.75 ± 1.46 for the CG, 18.38 ± 0.98 for EG1, 23.38 ± 1.40 for EG2, and 9.50 ± 0.86 for EG3 group. Differences were statistically significant between the EG groups and CG group (P< 0.0001).Additionally, the EG2-3 groups showed statistically significant differences compared with the EG1 group (P< 0.05) (Figure 2C and D).
Colonic histological damage assessment
The results of HE staining indicated that the colonic tissue structure of CG rats was normal, with the mucosal layer showing a well-arranged monolayer of columnar epithelial cells, clear intestinal glands,morphologically normal goblet cells, and no inflammatory cell infiltration. In the colon of EG1 rats, most crypts disappeared, with some broken or disappearing epithelia, accompanied by inflammatory cell infiltration. In the colon of EG2 rats, 1/3-2/3 of basal crypts disappeared, with the occasional destruction of epithelial cells. In the colon of EG3 rats, crypts completely disappeared, with some broken or disappearing epithelia, accompanied by massive inflammatory cell infiltration (Figure 3A). The HI scores for the colons of the rats in the CG, EG1, EG2, and EG3 groups were 0.00 ± 0.00, 3.07 ± 0.25, 2.22 ±0.17, and 3.71 ± 0.14, respectively. The differences were statistically significant between the EG groups and CG group (P< 0.0001), and between the EG2-3 groups and EG1 group (P< 0.05) (Figure 3B).
Changes in proportion of NOS-positive colonic myenteric neurons
The distal rat colons were double-stained by immunofluorescence histochemistry to observe the distribution and expression of NOS-positive neurons within the colonic MP. Within the colonic MP of rats,the proportion of these neurons in each group was counted. Enteric neurons exhibited a reticular distribution in the colonic MP (Figure 4B). NOS-positive neurons accounted for 31.38 ± 0.94% in the CG group (Figure 4C) but were more distributed within the marginal side of the ganglia (Figure 4A). They were fusiform or star-shaped, and their nuclei were round with several elongated protrusions. The protrusions of these neurons were interconnected with each other to form a dense and complex neural network. In the EG1 group, the percentage of NOS-positive neurons in colonic neurons (Figure 4E)increased to 42.25% ± 0.88% under disease conditions (Figure 4F). The distribution of these neurons was no longer confined to the edges of the ganglia and began to appear elsewhere within the ganglia(Figure 4D). Moreover, the proportion of NOS-positive neurons in the EG2 group increased to 51.75% ±1.22% (Figure 4I and H). These neurons in the ganglia were disorganized and widely distributed within the ganglia (Figure 4G). Compared with the EG1 group, the proportion of NOS-positive neurons in the EG3 group decreased to 37.25% ± 1.09% (Figure 4L and K), with their distribution within the ganglia being predominantly marginal (Figure 4J). The changes in the proportion of NOS-positive neurons to colonic neurons in the EG groups were statistically significant in comparison to the CG group (P <0.0001); however, the EG2 and EG3 groups were also significantly different from the EG1 group (P<0.05) (Figure 4M).
NOS protein expression level in colonic MP
The expression level of NOS protein in the colonic MP of EG1 rats was higher than that in the CG group.The NOS expression in the EG2 rat colon was further increased, while the expression in the EG3 rat colon was lower than that in the EG1 group. The differences were statistically significant between the EG groups and CG group (P< 0.0001) and between the EG2-3 groups and EG1 group (P <0.05)(Figure 5A and B).
Concentration of NOS in colonic myenteric tissue and serum
The concentration of NOS was significantly increased in the colonic myenteric tissue in the EG groups compared with the CG group (P< 0.0001); the EG2 group had a higher NOS concentration, whereas the EG3 group had a lower concentration than the EG1 group, and the difference between the EG2-3 groups and EG1 group was also statistically significant (P< 0.05) (Figure 6A). In addition, serum concentrations of NOS were significantly increased in the EG group compared with the CG group (P< 0.0001);however, the EG2 group had a significantly higher NOS concentration, whereas the EG3 group had a significantly lower concentration than the EG1 group (P< 0.05) (Figure 6B).
Comparison of contraction tension of isolated rat colonic smooth muscle
At rest, the contraction of the LM in the colon of CG rats appeared as a regular and sine wave-like curve with relatively neat amplitude (Figure 7A). In EGs rats, the contraction was significantly more frequent,with the increased amplitude (Figure 7B-D). The contraction tension of the LM of the colon was considerably more significant in EG rats than in CG rats (P< 0.0001). However, the contraction tensions of the colonic LM were significantly weakened and increased in EG2 and EG3 rats, respectively, when compared with EG1 rats (P< 0.001) (Figure 7E).
At rest, the contraction of the colonic CM in CG rats appeared as a regular and triangular wave-like curve. The amplitude was neat, with a contraction interval between the adjacent two waves (Figure 8A).In EGs rats, contraction of the CM of the colon was significantly accelerated, and its amplitude was increased (Figure 8B-D). The contraction tension of the colonic CM was significantly larger in EG rats than in CG rats (P< 0.0001). The contraction tension of the colonic CM appeared significantly weakened and increased in EG1 rats compared with EG2 and EG3 rats, respectively (P< 0.0001) (Figure 8E).

Figure 3 Histological evaluation. A: HE stained rat colon tissues. a: CG; b: EG1; c: EG2; d: EG3. Scale bar = 100 μm; B: Comparison of colonic histological index scores showing statistically significant differences between EG groups and CG group (bP < 0.0001) and between EG2-3 groups and EG1 group (aP < 0.05). CG:Control group; UC: Ulcerative colitis; NOS: Nitric oxide synthase; L-NMMA: NG-monomethyl-L-arginine monoacetate; EG1: UC group; EG2: UC + NOS agonist TP508TFA group; EG3: UC + NOS inhibitor L-NMMA group; HI: Histological index.
DlSCUSSlON
An increase or decrease in the number of neurons and/or neuronal degeneration in the ENS can lead to various diseases. For instance, congenital dysplasia of the ENS leads to congenital megacolon(Hirschsprung disease) and primary achalasia, whereas neurodegenerative ENS alterations can lead to the disorders such as Alzheimer, Huntington, and Parkinson diseases[16,17]. The secondary alterations in the ENS also result in inflammatory infiltrates or immune system pathologies such as irritable bowel syndrome[18], idiopathic enteric gangliosidosis[19], paraneoplastic syndrome[20], slow transit constipation[21], severe acute pancreatitis[22], diabetes mellitus[23,24], and UC[25].
The different types of ENS neurons have significantly different morphology and structure associated with the synthesis and secretion of neurotransmitters. However, by forming complex synaptic connections, these neurons participate in the structural basis that mainly underlies the relatively independent reflex activity of the gut and can also regulate the diverse motor and sensory activities of the digestive tract.
Despite the unclear etiology of UC, numerous studies have shown that its pathogenesis might be associated with the interactions between genetic susceptibility, environmental provoking factors, and immune-mediated tissue damage. Additionally, the relationship between abnormal intestinal motility and UC has also gained attention. Abnormal ENS is an important mechanism contributing to the abnormal colonic motility of UC, which is an important factor causing diarrhea in UC patients.
The onset of UC has a complex genetic background. Based on the gene polymorphism and heterogeneity, the impaired local barrier function of the intestinal mucosa can be the result of a combination of factors, such as altered epithelial permeability, neuroendocrine regulation, and intestinal flora translocation[26]. This, in turn, provokes the inflammatory response with symptoms such as abdominal pain,diarrhea, and colonic motor dysfunction. As the rate-limiting enzyme of NO synthesis in the body, NOS has three sub-types: iNOS, eNOS, and nNOS. Histological studies have identified intense focal iNOS expression by the inflamed bowel epithelium and in the mononuclear cell infiltrate in the intestinal tissues of both Crohn’s disease and UC patients[27]. A great number of studies suggest that iNOS in the ENS may play a part in preventing activation of mast cells, reducing leukocyte adhesion to the endothelium and protecting the host from being invaded by colonic bacteria[28-30]. In normal and UC states, eNOS expression is limited to colonic vascular endothelium[31]. Bakeret al[32] confirmed that during DSS-induced UC, eNOS KO mice suffered less tissue damage and inflammation than wild-type mice, suggesting that eNOS is essential for maintaining the integrity of the GI mucosa. nNOS is one of the specific markers for nitrergic neurons within the ENS, the primary inhibitory neurons of the colonic MP[33]. By releasing inhibitory neurotransmitter NO, nitrergic neurons can regulate GI motility. The changes in expression of nNOS in the colonic MP of UC rats indicate that nitrergic neurons may be involved in NO-based neurotransmission and regulate GI motility in UC state.
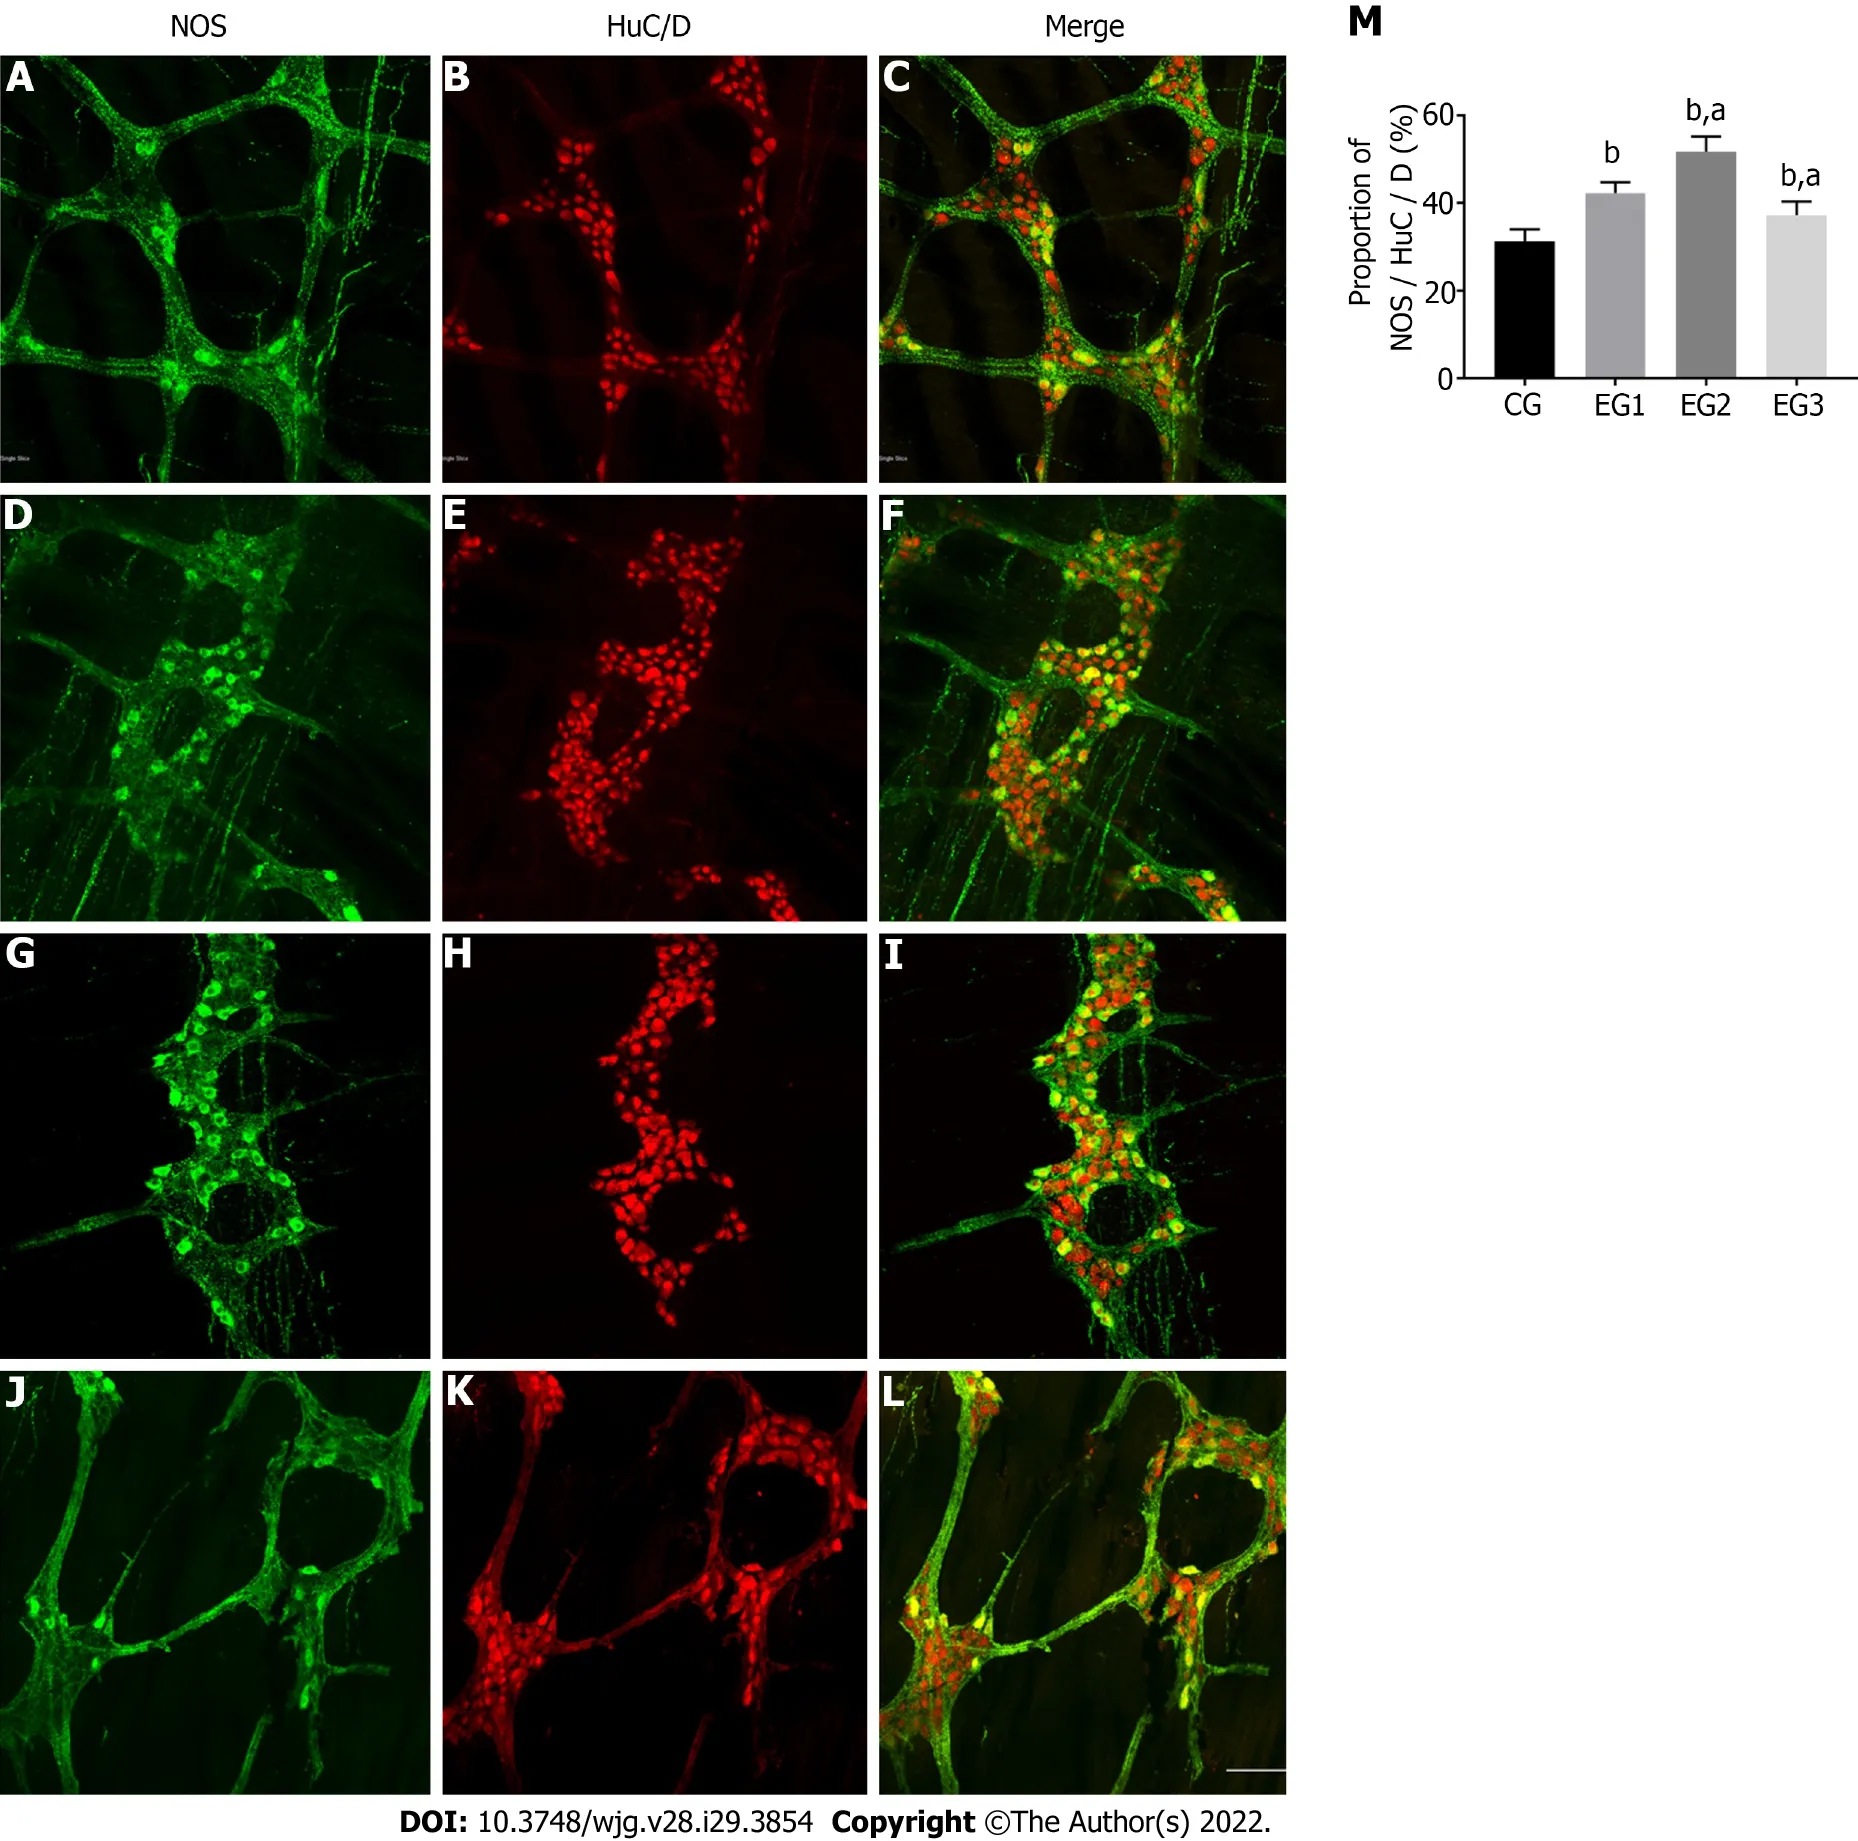
Figure 4 Changes in the number of nitric oxide synthase-positive neurons in the colonic myenteric plexus. A-L: Immunofluorescent histochemical double-staining of the rat colonic myenteric plexus (MP) for nitric oxide synthase (NOS; green) and HuC/D (red) in CG (A-C), EG1 (D-F), EG2 (G-I), and EG3 (J-L) rats. Scale bar = 30 μm; M: Comparison of the proportion of NOS-positive neurons in the colonic MP showing statistically significant differences between EG groups and CG group (bP < 0.0001), and between EG2-3 groups and EG1 group (aP < 0.05). CG: Control group; UC: Ulcerative colitis; NOS: Nitric oxide synthase; L-NMMA: NG-monomethyl-L-arginine monoacetate; EG1: UC group; EG2: UC + NOS agonist TP508TFA group; EG3: UC + NOS inhibitor L-NMMA group;MP: myenteric plexus.
Research has shown that NO is the second messenger in the smooth muscle cells (SMCs) or interstitial cells of Cajal (ICCs)[34]. NO is highly lipid-soluble and reaches target ICCs in a freely diffusible manner after synthesis. It binds to the soluble guanylyl cyclase in the cells to increase the enzymatic activity by altering its spatial configuration, which further leads to an increase in cyclic guanosine monophosphate(cGMP) within the cells, activating the cGMP protein kinase-dependent calcium pumps, and therefore finally participates in intercellular information transmission[35]. Therefore, it could be concluded that as a messenger of information transmission between the NOS-positive neurons and GI SMCs, increased NO can reduce the Ca2+influx and directly promotes smooth muscle relaxation. In addition, studies have confirmed that NO can inhibit muscle contraction by inhibiting the release of excitatory transmitters[23,36]. Therefore, NO-mediated reduced contractility of the intestinal smooth muscle might be one of the important mechanisms contributing to colonic dysmotility[9,37].
In the present study, DSS was applied to induce the UC rat model successfully. For the first time, the finding of a secondary increase in NOS expression in the colonic MP of UC rats, combined with alteredin vitrocolonic contraction tension, suggests that the increased NOS expression is associated with the altered colonic motility in UC rats. Increasing (or decreasing) the number of NOS-positive neurons might enhance (or attenuate) the diastolic function of the colonic smooth muscle regulated by these neurons. However, the change in the number of NOS-positive neurons is often due to changes in the concentration and release of neurotransmitters caused by changes in the amount of NOS contained in neurons under pathological conditions, rather than caused by neuronal degeneration and regeneration.The results ofin vitrostudies of the colon using both agonists and inhibitors of NOS further confirmed that the altered NOS expression regulate the colonic motility in UC. A previous similar study demonstrated that the NOS expression and NO concentration within the muscular layer of the stomach and small intestine were increased in an animal model of chronic pancreatitis[38]. These results suggest that the reduced contractility of the gastric CM because of NO inhibition might be an important mechanism underlying gastric motor dysfunction in chronic pancreatitis[36,38]. Moreover, these findings can provide an interesting insight into the role of the ENS during GI dysmotility.
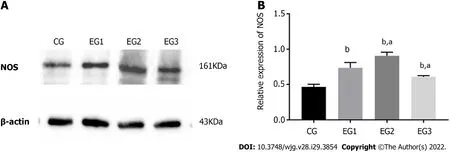
Figure 5 Relative nitric oxide synthase protein expression in the colonic myenteric plexus. A: Western blot analysis of expression of nitric oxide synthase (NOS) in the colonic myenteric plexus (MP) of rats in the four groups; B: Comparison of the relative expression of NOS protein in the colonic MP of rats in the four groups showing statistically significant differences between EG groups and CG group (bP < 0.0001), and between EG2-3 groups and EG1 group (aP < 0.05).CG: Control group; UC: Ulcerative colitis; NOS: Nitric oxide synthase; L-NMMA: NG-monomethyl-L-arginine monoacetate; EG1: UC group; EG2: UC + NOS agonist TP508TFA group; EG3: UC + NOS inhibitor L-NMMA group; NOS: Nitric oxide synthase; MP: Myenteric plexus.

Figure 6 Changes in nitric oxide synthase concentration in colonic myenteric tissue and serum. A: Comparison of nitric oxide synthase (NOS)concentration in colonic myenteric tissue of rats in the four groups showing statistically significant differences between EG groups and CG group (bP < 0.0001), and between EG2-3 groups and EG1 group (aP < 0.05); B: Comparison of NOS concentrations in the serum of rats in the four groups showing statistically significant differences between EG groups and CG group (bP < 0.0001), and between EG2-3 groups and CG group (aP < 0.05). CG: Control group; UC: Ulcerative colitis; NOS:Nitric oxide synthase; L-NMMA: NG-monomethyl-L-arginine monoacetate; EG1: UC group; EG2: UC + NOS agonist TP508TFA group; EG3: UC + NOS inhibitor LNMMA group; NOS: Nitric oxide synthase.
The initiation of colonic dysmotility in UC may be related to the structural alterations and abnormal number of ICCs, disturbed intestinal electrophysiology, changes in colonic pressure, and abnormal expression of gut-related neurotransmitters. Our present results have demonstrated that the increased NOS expression inhibits the contraction motility of the colonic smooth muscle. Therefore, appropriate adjustment of NOS levels can alter the expression of nitrergic neurons, control the motor movement of the intestinal smooth muscle, and improve the UC colonic motor function. Of note, this could improve the symptoms of UC patients, providing a basis for the screening of novel agents against UC.
CONCLUSlON
The increased number of nitrergic neurons in the colonic MP of UC rats, bothin vitroandin vivo,diminishes the colonic motor function. In contrast, activation and inhibition of NOS activity could induce and diminish the colon motor function, respectively. Further, an increased number of nitrergic neurons in the colonic MP of UC rats leads to reduced colon contractile function. Therefore, the regulation of nitrergic neurons in the colonic MP through interference with the activity of NOS might be a novel potential and prospective way to reduce diarrhea symptoms in UC patients.
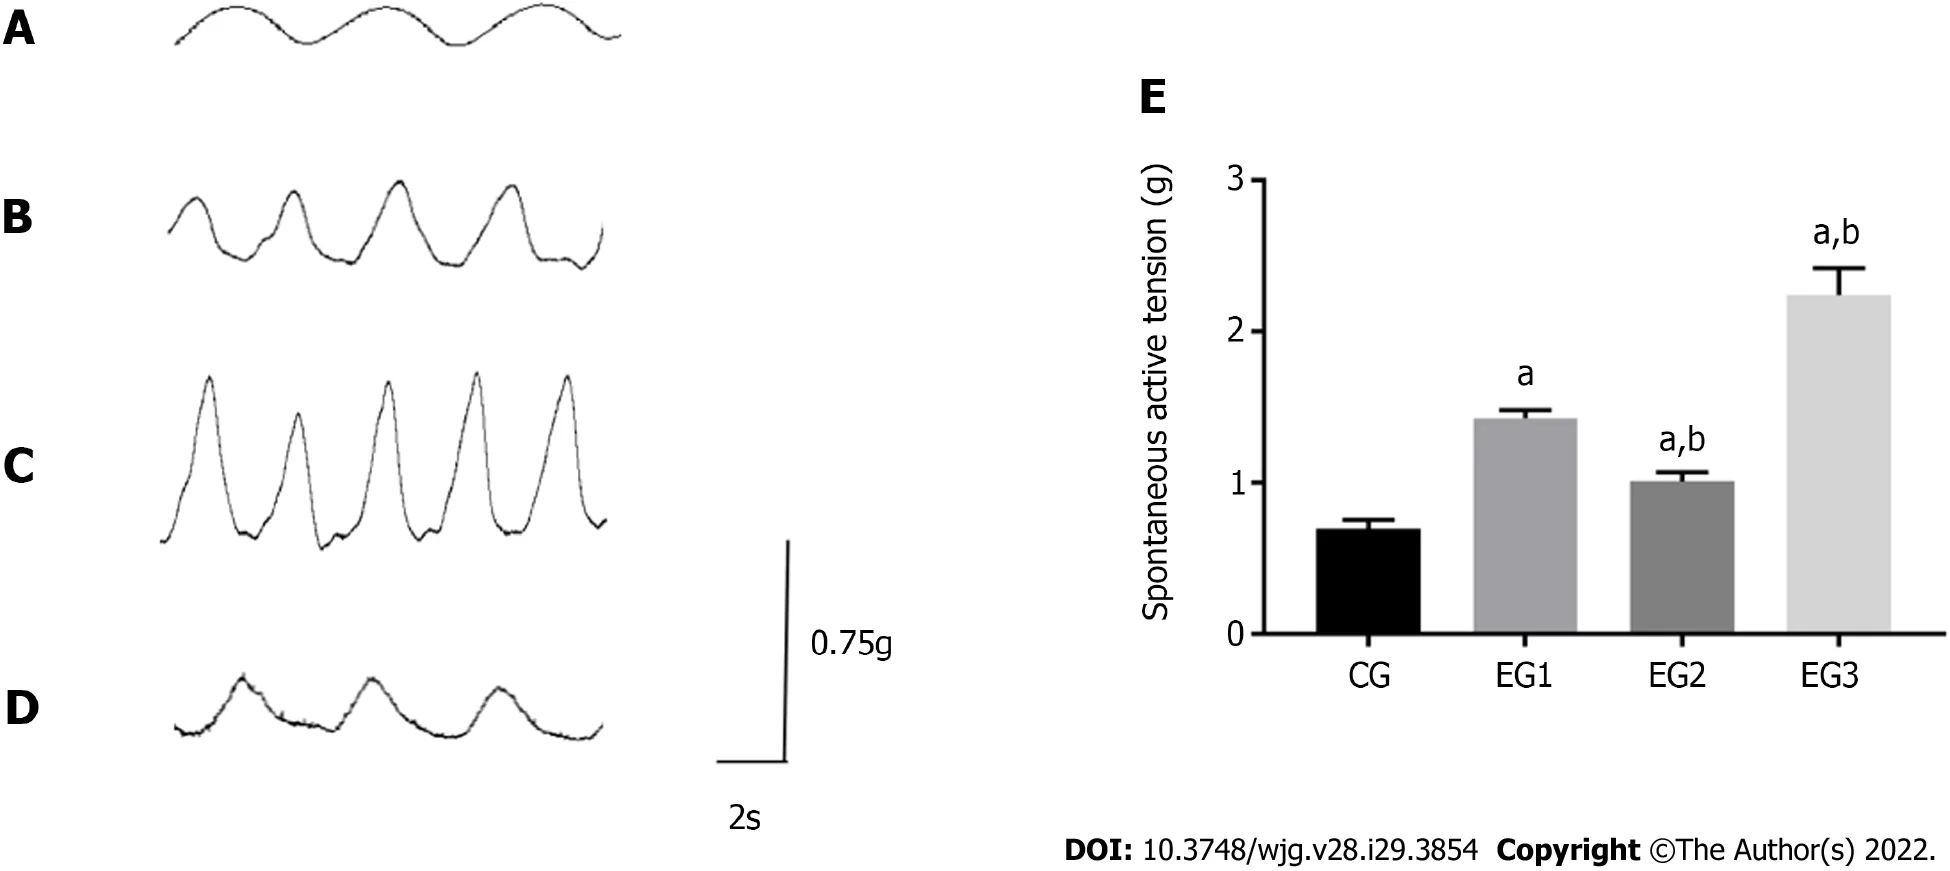
Figure 7 Comparison of isolated colonic longitudinal muscle contraction tension. A-D: Contraction amplitude of the colonic longitudinal muscle of CG (A), EG1 (B), EG2 (C), and EG3 (D) rats; E: Comparison of the contraction tension of the colonic longitudinal muscle among rats from the four groups: CG (0.69± 0.02 g), EG1 (1.42 ± 0.02 g), EG2 (2.24 ± 0.07 g), and EG3 (1.01 ± 0.02 g). All differences were statistically significant between EG groups and CG group (aP <0.0001) and between EG2-3 groups and EG1 group (bP < 0.001). CG: Control group; UC: Ulcerative colitis; NOS: Nitric oxide synthase; L-NMMA: NG-monomethyl-Larginine monoacetate; EG1: UC group; EG2: UC + NOS agonist TP508TFA group; EG3: UC + NOS inhibitor L-NMMA group; LM: Longitudinal muscle.

Figure 8 Comparison of isolated colonic circular muscle contraction tension. A-D: Contraction amplitude of the colonic circular muscle of CG (A),EG1 (B), EG2 (C), and EG3 (D) rats; E: Comparison of the contraction tension of the rat colonic circular muscle among the four groups: CG (1.46 ± 0.06 g), EG1(2.12 ± 0.49 g), EG2 (2.87 ± 0.04 g), and EG3 (1.72 ± 0.04 g). All differences were statistically significant between EG groups and CG group (aP < 0.0001) and between EG2-3 groups and EG1 group (bP < 0.0001). CG: Control group; UC: Ulcerative colitis; NOS: Nitric oxide synthase; L-NMMA: NG-monomethyl-L-arginine monoacetate; EG1: UC group; EG2: UC + NOS agonist TP508TFA group; EG3: UC + NOS inhibitor L-NMMA group; CM: Circular muscle.
ARTlCLE HlGHLlGHTS

FOOTNOTES
Author contributions: Li YQ and Chen J designed the study and edited the manuscript; Li YR, Li Y, Xu M, Jin Y, and Fan HW conducted the experiments; Li YR and Li Y completed the data analysis; Zhang Q and Tan GH provided language modification; Li YR and Li Y wrote the manuscript; all authors read and approved the final manuscript;and Li YR and Li Y contributed equally in carrying out this study and writing the manuscript.
Supported byNational Natural Science Foundation of China, No. 31971112; Natural Science Foundation of Liaoning Province, No. 2021-MS-330; and Innovation Capability Support Program of Shaanxi, No. 2021TD-57.
lnstitutional animal care and use committee statement:All animal experiments conformed to the internationally accepted principles for the care and use of laboratory animals (licence No. SCXK (Shan) 2019-001, Animal Experiment Center, The Fourth Military Medical University, China; protocol No. IACUC-20211101, The Laboratory Animal Welfare and Ethics Committee at The Fourth Military Medical University, China).
Conflict-of-interest statement:All authors report no relevant conflicts of interest for this article.
Data sharing statement:No additional data are available.
ARRlVE guidelines statement:The authors have read the ARRIVE guidelines, and the manuscript was prepared and revised according to the ARRIVE guidelines.
Open-Access:This article is an open-access article that was selected by an in-house editor and fully peer-reviewed by external reviewers. It is distributed in accordance with the Creative Commons Attribution NonCommercial (CC BYNC 4.0) license, which permits others to distribute, remix, adapt, build upon this work non-commercially, and license their derivative works on different terms, provided the original work is properly cited and the use is noncommercial. See: https://creativecommons.org/Licenses/by-nc/4.0/
Country/Territory of origin:China
ORClD number:Yan-Rong Li 0000-0001-7830-1055; Yan Li 0000-0001-5089-8574; Yuan Jin 0000-0001-7184-2844; Mang Xu 0000-0003-1017-1455; Hong-Wei Fan 0000-0002-9546-593X; Qian Zhang 0000-0001-7249-4191; Guo-He Tan 0000-0002-1101-207X; Jing Chen 0000-0001-9971-1053; Yun-Qing Li 0000-0002-3707-3348.
S-Editor:Ma YJ
L-Editor:Wang TQ
P-Editor:Cai YX
 World Journal of Gastroenterology2022年29期
- World Journal of Gastroenterology的其它文章
- Mechanistic and functional extrapolation of SET and MYND domain-containing protein 2 to pancreatic cancer
- Clinical challenge for gastroenterologists-Gastrointestinal manifestations of systemic mastocytosis: A comprehensive review
- Structural changes of proteins in liver cirrhosis and consequential changes in their function
- Epidemiologic and socioeconomic factors impacting hepatitis B virus and related hepatocellular carcinoma
- Enhanced endoscopic ultrasound imaging for pancreatic lesions: The road to artificial intelligence
- Qingyi decoction attenuates intestinal epithelial cell injury via the calcineurin/nuclear factor of activated T-cells pathway