
Anisotropic cyclic deformation behavior of an extruded Mg-3Y alloy sheet with rare earth texture
2022-07-26 11:41:10TinjioLiJinsongRoJingZhengDongiYinHogeShouYongfZhngRongShiWeihoJingLihongXi
Journal of Magnesium and Alloys 2022年6期
Tinjio Li ,Jinsong Ro,∗ ,Jing Zheng,b,∗ ,Dongi Yin ,Hoge Shou ,Yongf Zhng ,Rong Shi,Weiho Jing,Lihong Xi
a International Joint Laboratory for Light Alloys (Ministry of Education),College of Materials Science and Engineering,Chongqing University,174 Shazhengjie Street,Shapingba District,Chongqing 400044,China
bShenyang National Laboratory for Materials Science,Chongqing University,Chongqing 400044,China
c Key Laboratory of Advanced Technologies of Materials,Ministry of Education,School of Materials Science and Engineering,Southwest Jiaotong University,Chengdu,Sichuan 610031,China
d College of Mechanical Engineering,Chongqing Technology and Business University,Chongqing 400067,China
Abstract Mg-RE(magnesium-rare earth)alloys exhibit pronounced in-plane anisotropy of mechanical response under quasi-static monotonic loading resulting from the RE texture,as extensively reported.In this work,an obvious in-plane anisotropy of cyclic deformation behavior was observed in an extruded Mg-3Y alloy sheet during strain-controlled tension-compression low-cycle fatigue (LCF) at room temperature.The extrusion direction (ED) samples displayed better fatigue resistance with almost symmetrical hysteresis loops and longer fatigue life compared with the transverse direction (TD) samples.The influence of texture on the deformation modes,cracking modes,and mechanical behavior of Mg-Y alloy sheets under cyclic loading were studied quantitatively and statistically.The activation of various slip/twinning-detwinning systems was measured at desired fatigue stages via EBSD observations together with in-grain misorientation axes (IGMA) analysis.The results indicate that the activation of deformation modes in the TD sample was featured by the cyclic transition,i.e.,prismatic slip (at the tensile interval) →{10-12}tension twinning (at the compressive reversal) →detwinning+prismatic slip (at the re-tensile reversal).In the case of the ED sample,the cyclic deformation was dominated by the basal slip throughout the fatigue life.For cracking modes,intergranular cracking and persistent slip bands (PSB) cracking were the primary cracking modes in the ED sample while the TD sample showed a high tendency of {10-12} tension twinning cracking (TTW cracking).The underlying mechanisms influencin the activation of various slip/twinning-detwinning systems,as well as cracking modes and cyclic mechanical behavior,were discussed.
Keywords: Anisotropic cyclic deformation;Dislocation slip;Twinning-detwinning;Cracking modes;Mechanical behavior.
1.Introduction
Magnesium (Mg) alloys have become engineering structural materials with extremely high development potential and research prospects,which are widely used in aerospace,automotive industry,and commercial electrical appliances,due to their lightweight,high damping capacity and high specifi strength [1,2].However,conventional wrought Mg alloys,such as AZ31 and ZK60,exhibit poor ductility and formability owing to the strong basal texture and limited deformation modes [3,4].Great efforts have been made to weaken the texture [5-7].Fortunately,some Mg alloys showing more random texture,especially Mg alloys containing rare earth(RE) elements (e.g.Gd and Y) have been developed successfully [8,9].Mg-RE alloys usually show typical RE texture[10-12],i.e.the maximum basal pole symmetrically split into two lobes in extrusion direction (ED) or transverse direction(TD).This RE texture would give rise to in-plane anisotropy of mechanical properties which has been widely reported.For example,Bohlen et al.[13] reported higher yield strength but lower uniform elongation along the RD (rolling direction) than the TD in the Mg-4Zn-1Y alloy.They attributed the anisotropy in mechanical properties to the special texture characteristics which displayed a lower spread of the basal poles toward the RD compared with the TD.Moreover,Wu et al.[14] also reported a similar anisotropy in yield strength and elongation in the Mg-2Gd-1Zn alloy with RE texture.Extensive studies [13-15] were performed to understand the in-plane anisotropy of mechanical properties under monotonic loadings,such as tension and compression,in Mg alloy sheets with RE texture.
However,during actual service,Mg alloys used as structural components are often subjected to cyclic loading [16].Cyclic mechanical behaviors are of great importance in assessing the mechanical reliability [10,17-19].Therefore,a comprehensive understanding of the influenc of the texture on the cyclic deformation behavior of Mg alloys is of great interest.Extensive studies [20-23] suggested that the cyclic deformation modes showed a significan texture dependency in Mg alloys.For instance,the as-rolled AZ31B alloy sheets with symmetric strong basal texture in RD-TD plane,the RD sample showed similar cyclic transition of deformation modes to the TD sample [21].Basal slip and {10-12} tension twinning dominated deformation at the tensile and compressive reversals during fatigue,respectively.However,in the case of AZ31 alloy sheets with basal poles tilting towards RD,basal slip exhibited higher activity in the RD sample than that in the TD sample which showed higher activity of prismatic slip[24,25].Similarly,in the fatigue of AM30 alloy sheets with basal poles tilting towards TD,the ED sample showed higher activity of twinning-detwinning than that in the TD sample[26].However,the question of how texture influence the activation of deformation modes (slip modes,twinning and detwinning modes) during cyclic loading in Mg-RE alloy is still unclear.
Furthermore,deformation modes during cyclic loading display a great influenc on cracking modes [10,27-29].Wen et al.[28] reported that tension-twinning induced cracking (TTW cracking) served as the primary cracking mode in the rolled AZ31 alloy sheets with strong basal texture.They attributed this cracking behavior to twinningdetwinning-dominated cyclic deformation during fatigue.In contrast,Wang et al.[27] found the extruded Mg-8.0Gd-3.0Y-0.5Zr alloy sheets with weakened basal texture in which dislocation slip dominated cyclic deformation displayed high intergranular-cracking and persistent-slip-band (PSB) cracking tendency.It can be seen that Mg alloys with different textures show various cracking modes during cyclic loading.Nevertheless,the effect of the special RE texture on the fatigue cracking mode of Mg-RE alloys and the mechanism of the texture dependency of cracking modes remain to be clarified
In the current work,the in-plane anisotropy in cyclic deformation behavior of the Mg-3Y extruded sheet was systematically studied by analyzing the activation of deformation modes and cracking modes.The in-grain misorientation axes (IGMA) analysis [30] and intergranular misorientation analysis were adopted to quantitatively obtain activity of various slip modes and twinning-detwinning modes during cyclic loading,respectively.The mechanisms of the texturedependencies of deformation modes,cracking modes and fatigue behavior were discussed.
2.Materials and experimental procedures
The material employed in this work was Mg-3Y (wt.%,used throughout the paper unless otherwise stated).3% Y can be completely dissolved into Mg matrix so that the interference of the second phase can be eliminated.The as-received material was a 110 mm diameter cast ingot with a composition of Mg-2.79Y-0.02Al-0.05Zn measured by inductively coupled plasma (ICP).The initial cast was homogenized at 525 °C for 24 h followed by water quenching and then machined into an 80 mm diameter billet for extrusion.The billet and mold were preheated at 400 °C for 2 h,and then the billet was extruded into a 55 × 5 mm2sheet with an extrusion ratio of~18.3.Dog-bone-shaped samples with a gage length of 8 mm and a cross-section of 4.5 × 4 mm2for uniaxial tension/compression and low cycle fatigue (LCF) tests were taken from the sheet in two perpendicular orientations:ED and TD by electric discharge machine (EMD).Specimens for optical microscopy (OM) observations were mechanically polished and etched for three seconds in a solution of 2 ml HNO3and 12 ml H2O.Macro-texture was determined by Xray diffraction (XRD,Rigaku D/max-2500 PC).
Monotonic loading tests and LCF experiments were conducted at room temperature on a servo-hydraulic load frame(MTS 809 Axial/Torsional) equipped with an extensometer with a gage length of 8 mm (Epsilon3442-008M-020M-ST).The strain rate of the monotonic loading was 1.0 × 10⁻³s−1.Especially,the uniaxial compression tests were stopped when the strain reached 8% because the buckling of the specimens would reduce the accuracy of the data as the strain increased [23,31].The samples for the LCF test were carefully polished using various grit papers (400 grit,600 grit,and 1000 grit) to obtain a maximum surface roughness of 0.2 μm.The strain amplitudes of LCF tests were 0.4%,0.6%,0.8%,1.0%,1.2%,1.4%,1.6% with the strain ratio of −1 and the frequency of 0.1 Hz.All LCF experiments were performed until the stress amplitude decreased over 5% and the corresponding cycle was marked as fatigue failure cycle or fatigue life[21].At least three samples were tested for each condition to ascertain reproducibility.

Fig.1.Representative microstructures and macro-texture of the as-extruded Mg-3Y alloy (in the ED-TD plane):(a) optical micrograph;(b) (0002) pole figur measured by XRD.
The microstructure and crystallographic orientation of the deformed samples were examined by scanning electron microscope(SEM,JEOL JSM-7800F)equipped with an electron backscatter diffraction detector (EBSD,Oxford Nordlys F).All samples for EBSD analysis were mechanically ground using various grit papers (from 400 grit to 4000 grit) and then electrolytically polished in an AC2 solution (18 ml distilled water,10 ml isopropanol,80 ml absolute ethanol,75.0 g citric acid,41.0 g sodium hydrosulfide and 10.0 g 8-hydroxyquinoline) at −25 °C using a voltage of 20 V for 2 min.Additionally,the JEOL JSM-7800F operating conditions were an accelerating voltage of 20 kV,a working distance of 10 mm,and a 0.2 μm step size.The Channel 5.0 analysis package was used to process the EBSD data.
3.Results
3.1.Original microstructure
The optical micrograph of the as-extruded Mg-3Y sample(in the ED-TD plane) is shown in Fig.1(a).The recrystallized grains with an average size of 10 μm were observed,and neither obvious deformation twins nor second phases appeared.The (0002) pole figur measured in the ED-TD plane is depicted in Fig.1(b),and there is a typical RE texture with a symmetrical splitting of maximum intensity by 30° to 40°from the normal direction (ND) toward the ED.The maximum intensity of this texture is 5.76 multiples of random distribution (M.R.D),which is much smaller than that of the strong basal texture in traditional commercial AZ/AM series Mg alloys [32,33].
3.2.Mechanical behavior
3.2.1.Uniaxial tension/compression
The tensile and compressive stress-strain curves of the TD and ED samples obtained at room temperature are shown in Fig.2.The yield strength of the two samples under the monotonic loading is summarized in Table 1.The tensile and compressive yield strengths of the TD sample were 148 MPa and 110 MPa,respectively.The yield strength ratio (YSR),which is define as CYS (compressive yield strength)/ TYS (ten-sile yield strength),was 0.74,indicating a profound tensioncompression asymmetry.Note that a less tension-compression(T-C) asymmetry is exhibited with the CYS/TYS ratio tending to 1.In contrast,the TYS and CYS of the ED sample were 98 MPa and 93 MPa and the YSR was 0.95,suggesting a significantl reduced T-C asymmetry.In addition,for the TD samples,the tension and compression responses during plastic deformation also presented significan T-C asymmetry as shown in Fig.2(b).The compressive stress-plastic strain curve exhibits a sigmoidal shape while the tensile stress-strain curve shows a concave-down shape.In the ED samples,the stress-strain curves at the plastic deformation stage display concave-down shapes in both tension and compression and the two curves almost coincided.The monotonic mechanical behaviors serve as a basis for the LCF studies.
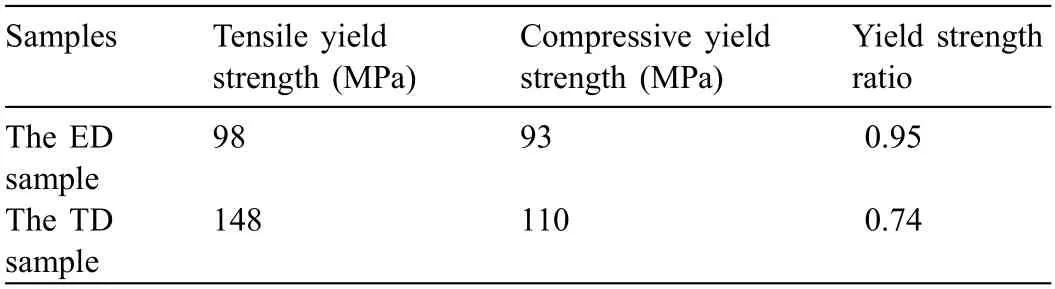
Table 1 The yield strength of the ED and TD samples under uniaxial tension and compression.

Table 2 Slip systems available in magnesium and corresponding segregation axes[30].
3.2.2.Cyclic deformation behavior

Fig.2.Tensile/compressive stress-strain curves of the extruded Mg-3Y Mg alloy along ED and TD:(a) absolute stress-absolute strain curves and (b) absolute stress-absolute plastic strain curves.Note that the absolute plastic strain, εp,can be written as: εp=|ε|−|σ|/E0 [18,22],where ε and σ are the absolute strain and the corresponding absolute stress value,respectively,and E0 is the Young’s modulus.

Fig.3.Cyclic stress-strain response of the ED and TD samples:(a) the curve of strain amplitude-number of cycles to failure (ε-N curve);representative hysteresis loops (cycle1-10,half life,and the last cycle) of the ED and TD samples at 1.0% strain amplitude;(d) peak,valley and mean stresses as functions of the cycle number of the ED and TD samples at 1.0% strain amplitude.
The strain amplitude-number of cycles to failure curves (ε-N curves) of the ED and TD samples are shown in Fig.3(a).There is an obvious difference in fatigue properties between the ED and TD samples.The ED samples always showed better fatigue resistance with longer fatigue life at the same strain amplitude (0.4%−1.6%) compared with the TD samples.For instance,At the strain amplitude of 1%,the fatigue life of the ED specimen was 316 cycles,which is~2.2 times that of the TD sample (144 cycles).Fig.3(b,c) shows the representative hysteresis loops of the 1st-10th cycles,half-life cycles (the 72nd cycle for the TD sample and the 158th cycle for the ED sample),and the last cycles at 1% strain amplitude of the ED and TD samples.In Fig.3(b),the hysteresis loops of the TD sample show manifest asymmetric shapes.Specificall,the stress-strain curve of the initial portion of the tensile interval at the 1st cycle displays a concave-down shape.In the successive compressive reversal,a plateau occurs when the compressive stress reached −130 MPa (as indicated by the black arrow).The subsequent tensile reversal exhibits a sigmoidal shape.The curve presents a concave-down shape before the tensile stress reached 78.6 MPa (as indicated by the blue arrow).After this,the curve displays a concave-up shape.Moreover,the hysteresis loops of the TD samples display similar asymmetrical shapes throughout almost the whole fatigue life.In contrast,the stress-strain hysteresis loops of the ED samples exhibit symmetrical characteristics.The curve presents concave-down and concave-up shapes in the firs tensile interval and successive compressive reversal,respectively.In the subsequent tensile reversal,the curve displays a concave-down shape.Fig.3(d)illustrates the variation of peak(the maximum tensile stress,σmax),valley (the maximum compressive stress,σmin),and mean stresses (σm=(σmax+σmin)/2) with loading cycles for the TD and ED samples.The peak/valley stress-response curves of the two can be mainly divided into three stages:(I) the rapid cyclic hardening (both peak and valley stresses) stage in the initial few dozens of cycles;(II) the moderate hardening/softening stage,which accounted for most of the total fatigue life;and (III)the apparent softening in peak/valley stress until fatigue failure.It is demonstrated that the texture shows a significan influenc on the cyclic hardening/softening behavior.For the TD sample,during the stage I (the firs 10 cycles),both the peak and valley stresses increased rapidly (peak stress increased from 159 MPa to 176 MPa,valley stress increased from 130 MPa to 143 MPa (absolute value,all compressive valley stresses are of absolute value unless otherwise stated)),indicating a high cyclic hardening behavior.Then,during the stage II (the 10th −114th cycle),the tensile peak stress decreased slightly (i.e.,decreased from 176 MPa to 166 MPa)until the 114th cycle (79.2% of the fatigue life),displaying a moderate cyclic softening behavior.In contrast,the compressive valley stress still increased in this stage (increased from 143 MPa to 149 MPa during the 10th −114th cycle) indicating a marginal cyclic hardening behavior.Finally,during the stage III(from the 114th cycle-fatigue failure),the peak stress decreased rapidly(decreased from 166 MPa to 87 MPa)while the valley stress decreased slightly (decreased from 149 MPa to 141 MPa) until fatigue failure.For the ED sample,during the stage I (the firs 6 cycles),it showed obvious cyclic hardening in both peak and valley stresses (peak stress increased from 110 MPa to 119 MPa,valley stress increased from 105 MPa to 111 MPa) which was similar to that of the TD sample.Then,during the stage II (the 6th −293rd cycle),both peak and valley stresses showed moderate cyclic hardening until the 293rd cycle (92.7% of the fatigue life,(peak stress increased from 110 MPa to 121 MPa,valley stress increased from 111 MPa to 114 MPa).In the end,during the stage III (from the 293rd cycle-fatigue failure),similar to the TD sample,the peak stress displayed an obvious cyclic softening behavior (decreased from 121 MPa to 58 MPa) while the valley stress showed a moderate cyclic softening behavior until fatigue failure (decreased from 114 MPa to 110 MPa).Due to the asymmetry of the stress-strain hysteresis loops of the TD sample,the mean stress reached maximum(20.1 MPa)at the 5th cycle and decreased gradually to 0 at the 122nd cycle (84.7% of the fatigue life).In the case of the ED sample,the mean stress reduced to around zero during most of the fatigue life resulting from the significantl reduced asymmetry of the stress-strain hysteresis loops.
3.3.Deformation modes
The activation of deformation modes,including various slip/twinning modes,of the TD and ED samples under monotonic loadings was analyzed at a tensile/compressive strain of 5%.Moreover,the evolution of deformation mechanism during cyclic loading was monitored at various fatigue stages of the two samples,including the tensile peak strain (T1),compressive valley strain (C1) of the 1st cycle,tensile peak strain of the 2nd cycle (T2),and the half-life cycle (the 72nd cycle for the TD sample and the 158th cycle for the ED sample).
3.3.1.Deformation modes under monotonic loading
Dislocation slip plays an important role in the plastic deformation of Mg alloys at room temperature [34-37].In-grain misorientation axes (IGMA) analysis is an effective method to study dislocation slip and is widely used in close-packed hexagonal (HCP) metals [38-40].It’s based on slip-induced lattice rotation to determine the activated slip systems.For example,a lattice rotation around the 〈0001〉 axis is caused by the onset of prismatic slip so a concentration of the IGMA toward the 〈0001〉 axis is observed when prismatic slip accommodates the main deformation in the grain.Moreover,the axes for various slip systems in Mg are summarized in Table 2.Fig.4 displays the representative microstructures of TD and ED samples at the tensile/compressive strain of 5%.For brevity,the TD and ED samples,which were strained to a tensile strain of 5% and a compressive strain of 5%,were marked as TD-T5%,TD-C5%,ED-T5%,and ED-C5%,respectively.Fig.5 shows Grains1-4 selected from ED-T5%,ED-C5%,TD-T5%,and TD-C5% inverse pole figur (IPF)map of Fig.4,respectively.Both Grains1 and 2 presented high segregation of the IGMA toward 〈1-100〉 axis with M.R.D>2.0 (M.R.D>2.0 is considered to be the indicator of the IGMA segregation).In addition,according to the IGMA and activation stress criterion,the activated slip system was identifie as the basal slip in both Grains1 and 2.Similarly,prismatic slip was activated in Grain 3 while no obvious segregation was detected in Grain 4.

Table 3 The evolution of TVFs in the TD and ED samples during cyclic deformation at 1% strain amplitude.
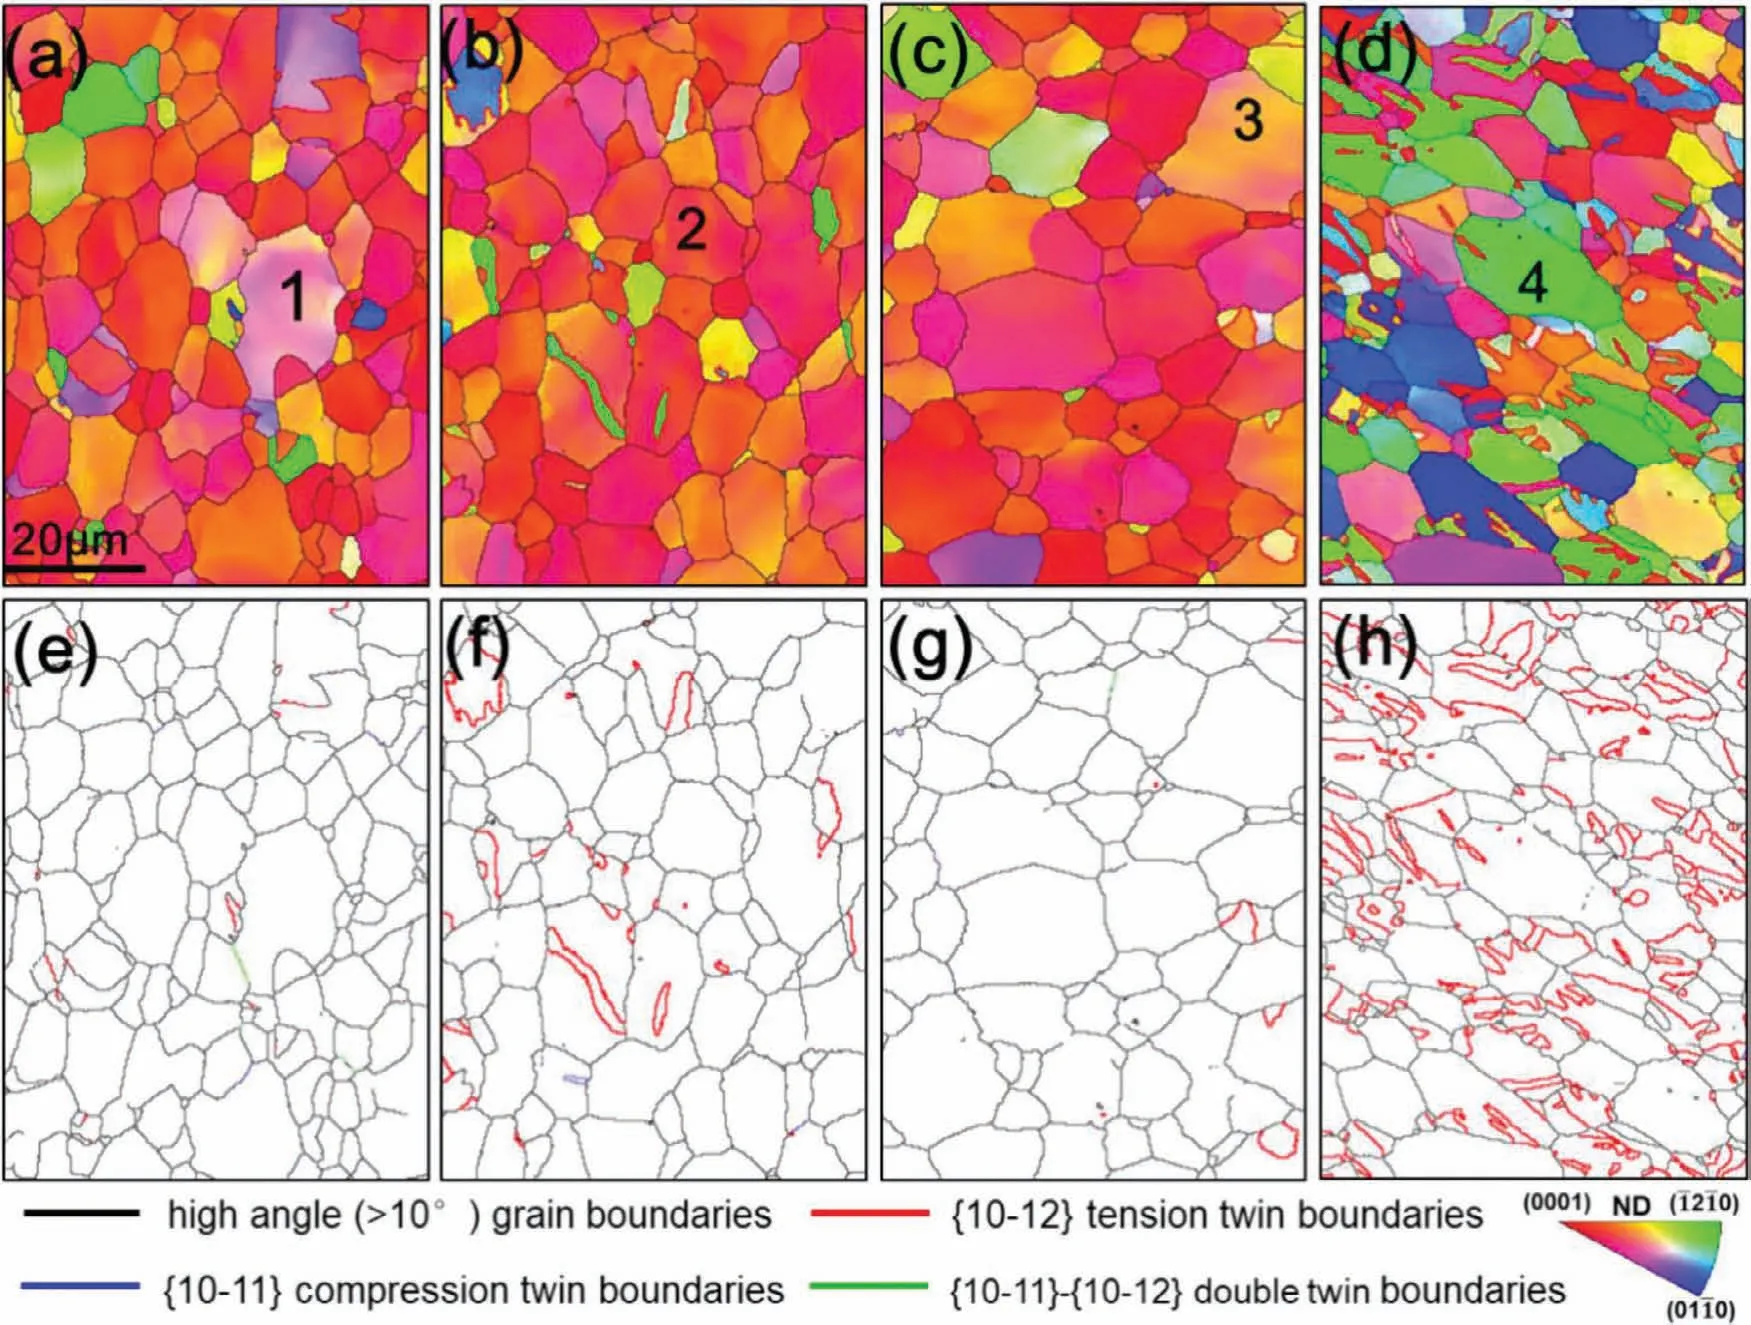
Fig.4.Representative microstructures of the Mg-3Y alloy sheet after 5% tensile/compressive strain taken for the ED-TD plane:the firs line:the IPF (inverse pole figure map along the ND;the second line:the boundary map illustrating twinning activity.(a,b) ED-T5%;(c,d) ED-C5%;(e,f) TD-T5%;(g,h) TD-C5%.The black and red solid lines represent high-angle (>10°) grain boundaries and {10-12} tension twin boundaries,respectively.
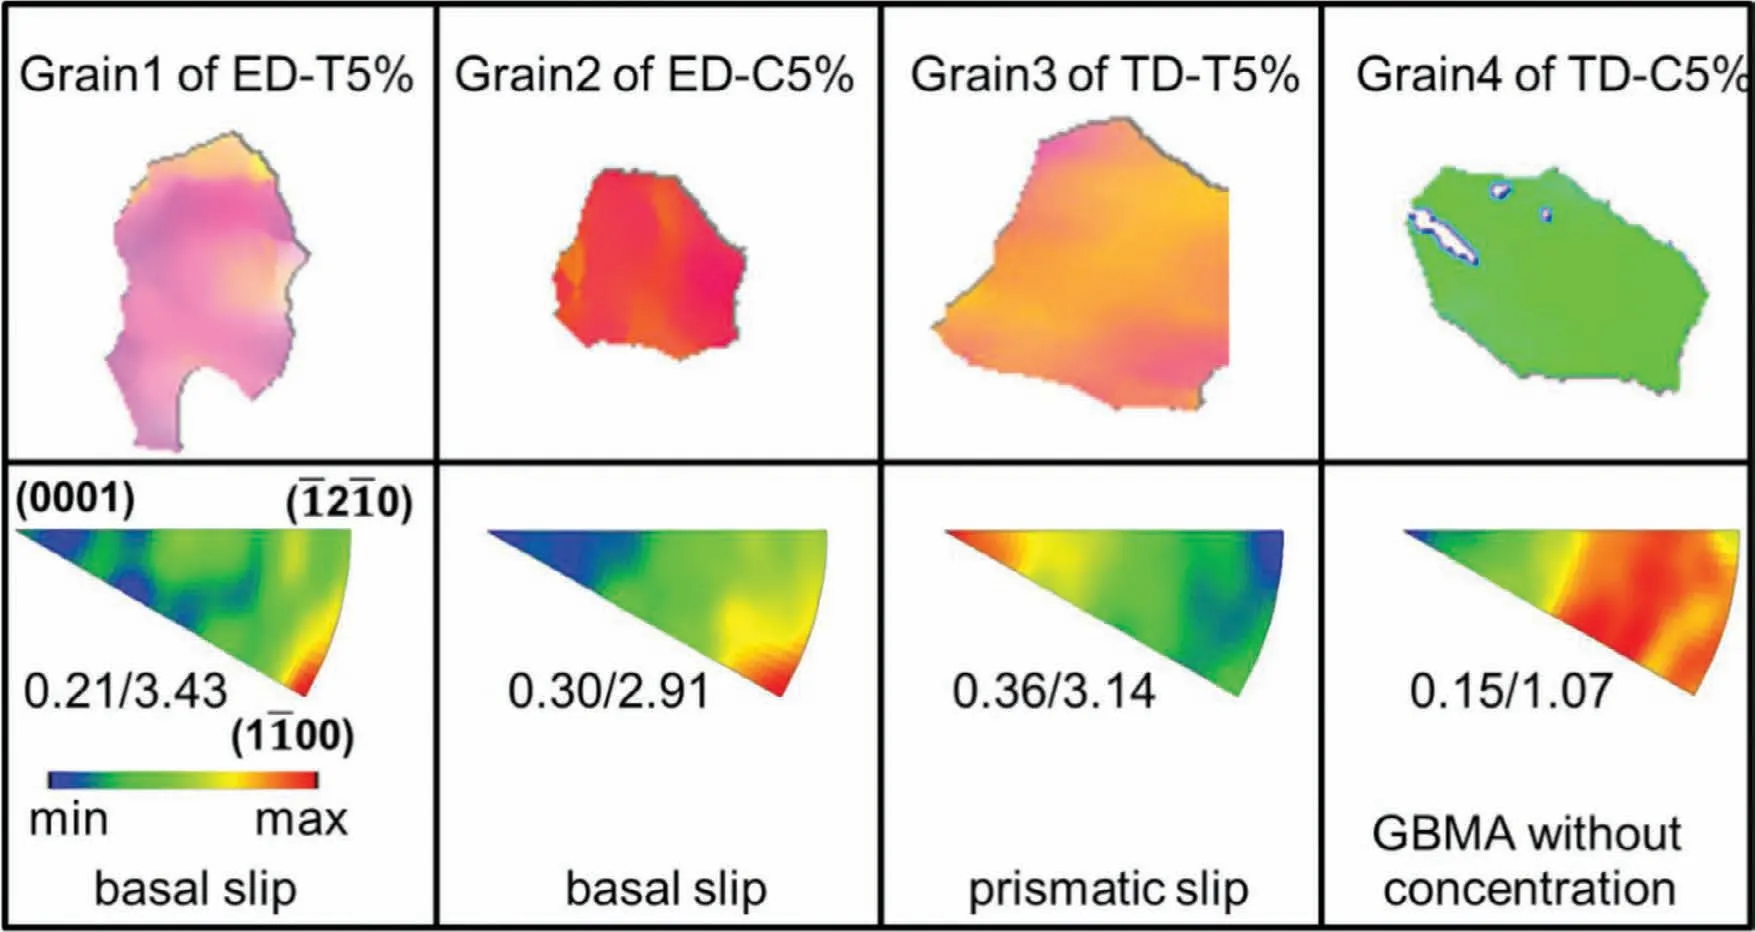
Fig.5.Grain1-4 selected from Fig.4 and corresponding IGMA distribution used to identify the activated slip systems.In the IGMA distribution map,the numbers before and after the slash represent the minimum and maximum M.R.D values of the IGMA concentration,respectively.M.R.D >2.0 is considered to be the indicator of the IGMA segregation.

Fig.6.Statistical histograms of the activated slip systems in terms of global SF distribution in ED/TD sample under monotonic loading:(a) ED-T5%;(b)ED-C5%;(c) TD-T5%;(d) TD-C5%.
To ensure statistical significance~120 grains in each sample were probed to identify the activated slip systems.The statistics of the activated slip systems of the four samples are summarized in Fig.6.For the ED-T5% sample,activation of dislocation slip was detected in 22 grains (18.3% of the 120 grains) by IGMA analysis.Among these grains,18 (81.8%)grains presented basal slip.Among these 18 grains,15 grains showed soft orientations (SF ≥0.3),which accounted for 83%of the grains displaying basal slip.Only 3 grains showed prismatic slip and 1 grain presented pyramidal slip.Moreover,the ED-C5% sample displayed similar activity of dislocation slip compared with the ED-T5% sample.Among the total 21 grains showing dislocation slip in the ED-C5% sample,17 grains (81.0% of the 21 grains) displayed basal slip.Basal slip dominated both tensile and compressive deformation of the ED sample.In contrast,for the TD-T5%sample,20 grains(16.7% of the 120 grains) displayed dislocation slip.Among these grains,14 grains (70%) showed prismatic slip,and 12 grains (86% of the 14 grains) exhibited soft orientations.In addition,basal slip was observed in 4 grains and pyramidal slip was activated in only 2 grains.Prismatic slip was the primary deformation mode during tension of the TD sample.Under compression,in the TD sample,merely 3 grains displayed basal slip and no non-basal slip was detected.
In addition to dislocation slip,twinning is also an important deformation mode for Mg alloys to accommodate c-axis strain [41-43].Especially,{10-12} tension twinning is the main twinning mode at room temperature owing to its relatively low critical resolved shear stress (CRSS) value [41].Among the four samples,only the TD-C5% sample exhibited abundant twins as shown in Fig.4 and the corresponding twin volume fraction (TVF) was 55.2%.In addition,most twinned grains showed soft orientations for twinning.Few twins were observed in the other three samples.The TVF of the ED-T5%,ED-C5%,and TD-T5% was 1.3%,2.7%,and 1.8%,respectively.It’s worth noting that only {10-12} tension twins were observed among these four samples.
In summary,the analysis of deformation modes indicates that basal slip dominated the plastic deformation of the ED sample in both tension and compression.Prismatic slip served as the primary deformation mode under the tension in the TD sample while {10-12} tension twinning dominated plastic deformation under the compression in the TD sample.Furthermore,the activation of the dominant deformation modes in the four samples followed Schmid’s law,i.e.,most deformation modes were activated in grains with soft orientations.
3.3.2.Deformation mechanism during cyclic loading

Fig.7.The evolution of representative microstructures of the ED and TD samples during various cyclic deformation stages at 1% strain amplitude:the firs row:the IPF map of the ED sample at (a) T1,(b) C1,(c) T2,and (d) half life;the second row:the IPF map of the TD sample at (e) T1,(f) C1,(g) T2,and(h) half life.Note that (f) and (g) illustrate the twinning-detwinning deformation mode during the fatigue of the TD sample by quasi-in-situ EBSD observation.
Unlike monotonic loading,the activation of deformation modes in many wrought Mg alloys was featured by the cyclic transition during cyclic loading [20,21,46].For example,in the fatigue of ZK60 alloy sheets,{10-12} tension twinning dominated the plastic deformation in the compressive interval while detwinning was the primary deformation mode in the tensile reversal.Fig.7 shows the representative microstructures of the ED and TD samples at various cyclic deformation stages (at T1,C1,T2,and half-life).It illustrates the evolution of morphology of twins during fatigue.The statistics of the evolution of TVFs in the two samples during fatigue were summarized in Table 3.Only {10-12} tension twins were observed throughout the whole stages.For the TD sample,no twins were observed at T1 while abundant twins appeared at C1 and the TVF reached 17.3%.Then,most twins were removed by detwinning in the tensile reversal and the volume fraction of the residual twins was only 1.8% at T2.The volume of residual twins increased with cycle number.At half life,many residual twins were observed and the TVF reached 26.2%.This typical twinning-detwinning deformation was widely reported in wrought Mg alloys with RE elements free such as AZ31 [46],and ZK60 [47,48].In addition,twinning behavior during the fatigue also meets the Schmid law and most twinned grains presented soft orientations for twinning.Conversely,in the case of the ED sample,no twins were found at T1,C1,and T2.Even at half life,the TVF was only 1.2%.The contribution of twinning to deformation was limited during cyclic loading of the ED sample.Therefore,it can be inferred that dislocation slip dominated the plastic deformation during fatigue of the ED sample.120 grains in ED/TD sample were monitored to analyze the activation of slip systems by the IGMA method during cyclic deformation.Fig.8 displays the number of grains showing dislocation slip at different cyclic deformation stages (T1,C1,T2,and half life) in terms of the corresponding global SF.
In the TD sample,4 grains (3.3% of the 120 grains) displayed dislocation slip at T1.Among these 4 grains,3 grains(75%) showed prismatic slip and all of them were in the soft orientation of prismatic slip.The other 1 grain presented basal slip but it was in the hard orientation of basal slip.At C1,the sample did not show more grains displaying dislocation slip compared with that at T1.At T2,the number of grains showing prismatic slip increased to 5.At half life,15 grains(12.5% of the 120 grains) showed dislocation slip.Among these 15 grains,11 grains (73.3%) displayed prismatic slip,and 9 grains (81.8% of the 11 grains) were with SFs higher than 0.3.Moreover,3 grains with hard orientations showed basal slip and 1 grain displayed pyramidal slip.For the ED sample,6 grains(5%of the 120 grains)displayed basal slip at T1.Under compressive reversal,the number of grains showing basal slip increased to 9 at C1.Then,13 grains showed basal slip at T2.During these stages,only basal slip was detected and 12 grains (92.3% of the 13 grains) showed soft orientation for basal slip.With increasing cycle number,at half life,the number of grains displaying dislocation slip was 26 which was~1.7 times that of the TD sample.Among these 26 grains,21 grains (80.8%) presented basal slip,and 18 grains (85.7% of the 21 grains) were in the soft orientations for basal slip.3 grains showed prismatic slip and all of them were in the soft orientation for prismatic.2 grains displayed pyramidal slip showing corresponding SFs higher than 0.3.

Fig.8.SF distributions of the activated slip systems identifie by IGMA in the (a) TD and (b) ED samples during different fatigue stages (T1,C1,T2,and half life).The four numbers in parentheses represent the total number of grains showing a particular slip system at T1,C1,T2,and half life in sequence.Percentages outside the parentheses represent the proportion of grains showing a particular slip system in the total grains showing dislocation slip.
In general,the activity of various deformation modes of ED and TD samples during cyclic deformation can be summarized as:
(1) ED samples:basal slip (at the initial tensile interval) →basal slip (at the successive compressive reversal) →basal slip (at the second tensile reversal.Basal slip served as a dominant deformation mode throughout the fatigue life.
(2) TD samples:prismatic slip (at the initial tensile interval) →{10-12} tension twinning (at the firs compressive reversal) →detwinning+prismatic slip (at the second tensile reversal).The transition of cyclic deformation modes in the subsequent cycles followed the above sequence.
3.4.Cracking mode during fatigue
Fig.9 shows secondary electrons (SE) SEM images of the ED and TD samples after fatigue failure.In the ED sample,slip traces (marked by the magenta dashed lines) concentrated inside most of the grains and few twins were observed.Conversely,abundant twins appeared in the TD sample while there were few slip traces.To reveal the cracking modes in the ED and TD samples,the crack morphologies of the two after fatigue failure were analyzed statistically.In addition,as illustrated in Fig.9,the detected micro-cracks could mainly be classifie into three categories:
(1) Intergranular cracks (marked by blue arrows);
(2) Transgranular cracks formed at persistent slip bands(PSB cracks,marked by red arrows);
(3) Transgranular cracks formed at tension twins (TTW cracks,marked by yellow arrows).
To ensure accuracy,the crack morphologies in an area containing~200 grains were analyzed statistically and the results are summarized in Fig.10.In the ED sample,there were 32 cracks in total.19 intergranular cracks (59.4% of the total 32 cracks) and 13 PSB cracks (40.6%) were observed while no TTW cracks appeared.For the TD sample,there were 46 cracks in total which were 1.4 times that of the ED sample.31 TTW cracks (67.4% of the total 46 cracks) were detected and the number of intergranular cracks and PSB cracks was 9(19.6%) and 6 (13.0%),respectively.Compared with the ED sample,much more TTW cracks but much fewer PSB cracks were detected in the TD sample.In summary,the cracking modes in the two samples were characterized as follows:
(1) In the ED sample,intergranular cracks,as well as PSB cracks,were the primary cracking modes during fatigue.
(2) For the TD sample,TTW cracks served as the dominant cracking modes,suggesting a high TTW-cracking tendency.
4.Discussion
4.1.Effect of texture on deformation modes
4.1.1.Effect of texture on deformation modes under monotonic loading
For conventional wrought Mg alloys with strong basal texture such as AZ31 [21],no obvious in-plane anisotropy of deformation modes was found due to in-plane texture symmetry.The in-plane loads were nearly perpendicular to the c-axes of most of the grains.As a result,basal slip and {10-12} tension twinning dominated the tensile and compressive plastic deformation,respectively.However,for the Mg-3Y alloy sheets with a typical RE texture,the texture exhibited a significan effect on the deformation modes,as shown in Fig.6.Basal slip dominated the deformation of the ED samples in both tension and compression.Prismatic slip mainly accommodated the tensile deformation of the TD samples,while {10-12} tension twining served as the main deformation mode in compression.It was reported that the deformation mechanism displayed significan in-plane anisotropy in Mg alloys with RE textures [13-15].Bohlen et al.[13] reported that,for the Mg-4Zn-1Y alloy with a RE texture,the TD sample showed higher activity of basal slip than the RD sample.They attributed the anisotropy to the special texture which displayed a higher spread of the basal poles toward the TD than toward the RD.

Fig.9.Secondary electron (SE) SEM micrographs showing crack morphology after fatigue failure of the (a) ED and (b) TD sample at 1% strain amplitude.

Fig.10.Statistical histogram of cracking modes for the ED and TD samples after fatigue failure.
The slip/ twinning systems would be activated when the applied stress exceeds the corresponding activation stress (σ)of a particular deformation mode.According to the Schmid law,theσcan be written as:

where CRSS is the critical resolved shear stress for a slip/twinning system and SF is the corresponding Schmidt Factor.Therefore,the activation of deformation modes is jointly governed by CRSS and SF [44,45].

Fig.11.Distribution of SF of different deformation modes (slip/twinning systems) for the ED and TD samples.
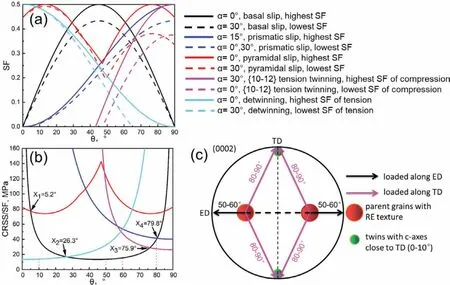
Fig.12.Deformation mode analysis based on minimum activation stress (CRSS/SF):(a) SF as a function of θ (the angle between the loading direction and the c-axis of a grain) and α (the rotation angle around the c-axis).Note that the dashed and the solid line represents the lower and upper limit of the SF of a particular deformation mode,respectively;(b) Distribution of activation stress as a function of θ in the ED and TD samples.Note that the light blue solid line in (b) represents the activation stress-θ curve of detwinning under reverse tension if {10-12} tension twins were activated during the preceded compression;(c) Schematic diagram showing the distribution of θ of the TD and ED samples with the RE texture as shown in Fig.1(b).
Fig.11 displays the SF distributions of various deformation modes in the ED and TD samples.Both the ED and TD samples show favorable orientations for pyramidal slip,and the mean SF values in the ED and TD samples are 0.41 and 0.43,respectively.Moreover,the ED sample displays favorable orientation for basal slip (the mean SF value is 0.38) and prismatic slip (the mean SF value is 0.30) while the TD sample shows favorable orientation for prismatic slip (the mean SF value is 0.42) and {10-12} tension twinning under compression(the mean SF value is 0.36).It’s well-established that the SF value is determined by the angle between the loading direction and the c-axes of grains (θ),as well as the rotation angle around the c-axis (α) [37,49].For the symmetry of the HCP crystal structure,the value ofθalters in the range of 0-90°andαvaries in the range of 0-30° Accordingly,the values of SF as a function ofθandαare calculated and the results are displayed in Fig.12(a).It can be seen thatθplays a dominant role in the value of SF while the varyingαat a particularθonly leads to a slight change in the SF value.Due to the characteristics of the RE texture displayed in Fig.1(b),the ranges ofθfor the ED and TD samples were 50°−60°and 80°−90°,respectively,as illustrated in Fig.12(c).In addition,it should be noted that only the compressive loading was considered for {10-12} tension twinning due to the polarity of the twinning.A CRSS ratio of 1:2:1:3:5.6 (Table 4) for basal slip,{10-12} tension twinning,detwinning,prismatic slip,and pyramidal slip was used in the calculation of activation stress [50].Notably,detwinning is the shrinking motion of the existing twin and nucleation does not occur during detwinning [51-53].Consequently,the CRSS value of detwinning is much lower than twinning.Based on the criterion of the lowest activation stress [44,45],the activated deformation modes of the ED and TD sample under monotonic loading were summarized in Table 3.For the ED sample,theθalters in the range of 50-60° as shown in Fig.12(c),so basal slip is preferentially activated both in tension and compression.Pyramidal slip with the highest average SFs value is difficul to be activated owing to its high CRSS value.Similar activation of deformation modes was widely reported in other Mg-RE alloys [31,54,55].Wang et al.[31] found that basal slip dominated tensile and compressive deformation in GW83K Mg alloy resulting from the greatly weakened basal texture.Yin et al.[55] observed highly reduced tension-compression asymmetry in Mg-Y alloys and they attributed it to the RE texture,the basal poles split from ND toward ED,which produced more soft-oriented grains for basal slip and promoted the onset of basal slip as the loading direction was parallel to the ED.Accordingly,basal slip served as the dominated deformation mode in both tension and compression.In contrast,in the case of the TD sample,theθvaries in the range of 80-90° as shown in Fig.12(c).The prismatic slip and{10-12} tension twinning displayed the smallest activation stress during tension and compression,respectively.As a result,the primary deformation mode was prismatic slip under tension while the dominant deformation mode was {10-12}tension twinning in compression.This difference in deformation modes under tension and compression is similar to that of the conventional wrought Mg alloys,such as AZ31,ZK60[56,57] with strong basal texture.

Table 4 CRSS values for various deformation modes of the Mg-3Y alloy [50].
4.1.2.Effect of texture on deformation modes under cyclic loading
The deformation mechanism under monotonic loading is a basis for that under cyclic loading.It’s worthy noting that the activation of deformation modes in the TD sample was featured by the cyclic transition under cyclic loading compared with that under monotonic loading,i.e.,tension twinning (at the compressive reversal) →detwinning+prismatic slip (at the tensile reversal).In the ED sample,the twinningdetwinning-dominated transition was suppressed due to the reduced twinning-detwinning activity,and resultantly basal slip dominated the cyclic deformation throughout the fatigue life.Based on the above analysis,for the ED sample,basal slip served as the primary deformation mode throughout the fatigue life owing to its lowest activation stress as shown in Fig.12 and Table 5.Basal slip-dominated cyclic deformation was also reported in the fatigue of GW83 [31] Mg-RE alloy.However,in the case of the TD sample,the activation of deformation modes during cyclic loading was featured by the cyclic transition.Similar to monotonic loading,prismatic slip and {10-12} tension twinning dominated the deformation in the firs tensile interval and subsequent compressive reversal.In addition,the activation of the {10-12} tension twinning would cause the matrix to rotate 86° around the〈11-20〉 axis as shown in Fig.13(e).Therefore,the c-axes of twins are almost parallel to TD (i.e.loading direction) and theθdecreased to 0-10° as illustrated in Fig.12(c).In the second tensile reversal,detwinning would preferentially oc-cur in the existing twins resulting from favorable orientation and low CRSS value as shown in Table 5.With increasing tensile strain,the detwinning would be exhausted at the inflectio point,as displayed in Fig.13(f).Therefore,prismatic slip dominated the tensile deformation.The cyclic transition of the deformation modes in the subsequent cycles followed the above sequence.This cyclic transition was also widely reported in wrought Mg alloys.Dong et al.[58] found twinning dominated the deformation in the compressive interval while detwinning and basal slip accommodated deformation in the tensile reversal during the fatigue of ZK60 Mg alloy.In addition,the contribution of non-basal slip to cyclic deformation of ZK60 was limited owing to the too high ratios of CRSSprismatic/CRSSbasaland CRSSpyramidal/CRSSbasal.The addition of Y greatly reduced the ratios of CRSSnon-basal/CRSSbasal[50].Consequently,the prismatic slip could exhibit high activity to accommodate deformation during the fatigue of the TD samples of Mg-3Y alloy sheets.

Table 5 The dominant deformation modes of the ED and TD samples under various loadings.The bold words represent the corresponding dominant deformation modes.
4.2.Effect of texture on cracking modes

Fig.13.Quasi-in-situ observation of the evolution of deformation modes of twinning-detwinning-prismatic slip of Grain A and Grain B in the TD sample during C1 and T2 in cyclic deformation:IPF map and IGMA distribution of Grain A at (a) C1 and (b) T2,PA,TA4,and TA2 represents parent Grain A,the 4th and the 2nd {10-12} tension twin variant of Grain A,respectively;IPF map and IGMA distribution of Grain B at (c) C1 and (d) T2,PB,and TB1 represent parent Grain B,the 1st {10-12} tension twin variant of Grain B,respectively;scattered (0002) pole figur of the two grains and their twins at (e)C1 and (f) T2 showing the lattice rotation during twinning-detwinning.
Based on the above analysis,the texture had an appreciable effect on the deformation modes of Mg alloys under cyclic loading.Numerous studies have shown that the deformation modes significantl influence the cracking modes.For example,Wang et al.[27] reported intergranular cracking and PSB cracking were the primary cracking modes in the fatigue of GW83 with basal slip-dominated cyclic deformation.In contrast,Wen et al.[28] reported TTW cracking dominated the cracking mode in the cyclic deformation of AZ31 where twinning-detwinning served as the primary deformation mode.It can be seen that the deformation modes played an important role in governing the cracking modes.In the current work,the analysis of cracking modes indicates that the texture had an appreciable effect on the deformation modes of Mg alloys under cyclic loading.Therefore,the texture-dependency of cracking modes can be attributed to the texture-dependency of deformation modes.Fig.14 depicts the kernel average misorientation (KAM) map of the two samples at half life.The KAM map can be used to assess the degree of plastic deformation,a higher value indicates greater plastic deformation or higher local stress concentration [58-60].Fig.15 illustrates the evolution of deformation modes and corresponding stress concentration of the two samples during cyclic deformation.For the ED sample,basal slip was continuously activated during cyclic loading in both tension and compression.Grain boundaries as barriers would obstruct the movement of dislocations.Therefore,dislocations piled up around the boundaries and give rise to lattice distortion,as shown in Figs.14(a) and 15.It would produce stress concentration and resultantly induce intergranular cracking[10,61].On the other hand,the continuous to-and-fro glide of dislocations in the PSB would lead to stress concentration in the PSB with the increasing cycle number.Consequently,micro-cracks formed at the PSB[54].As for the TD sample,prismatic slip together with twinning-detwinning in soft grains made most contribution to the cyclic deformation.The to-and-fro movement of the twin boundaries due to twinning-detwinning behavior,as well as the sustained interaction between twin boundaries and dislocations,gave rise to lattice distortion at the vicinity of twin boundaries,as shown in Figs.14(b) and 15.Therefore,the TD sample showed a great number of TTW-cracks.

Fig.14.KAM maps of (a) the ED sample and (b) the TD sample at corresponding half life.White arrows in (a) and (b) indicate stress concentration around grain boundaries and twins,respectively.The red lines represent the{10-12} twin boundaries.
4.3.Anisotropic mechanical behavior
4.3.1.Tension and compression asymmetry under monotonic loading
As illustrated in formula (1),the required applied stress to activate a particular deformation mode is jointly governed by corresponding CRSS and SF.Basal slip dominated the deformation in both tension and compression for the ED sample.Consequently,no apparent tension-compression asymmetry was found in the ED sample,as shown in Fig.2.Similarly,reduced tension-compression asymmetry can be found in Yin’s work [10-12].In the case of the TD sample,prismatic slip and {10-12} tension twinning dominated the deformation in tension and compression,respectively.The average SFs of the two deformation modes are very close as displayed in Fig.11 (0.42 for prismatic slip and 0.36 for the twinning).The CRSS of prismatic slip (20.1 MPa) is much higher than that of the {10-12} tension twinning (13.2 MPa).Therefore,higher applied stress is required to activated prismatic slip-dominated tension deformation.As a result,the TD sample shows a significantl tension-compression asymmetry.This tension-compression asymmetry was widely reported in AZ31,ZK60 alloys [46,47,62].
4.3.2.Anisotropic mechanical behavior under cyclic loading
Dislocation-dominated deformation usually produces a concave-down shape in the stress-strain curve [27,31].Basal slip dominated the cyclic deformation in both tension and compression,so the stress-strain curves of the tensile interval and compressive reversal are highly coincident,leading to more symmetrical hysteresis loops in the ED sample.For the TD sample,prismatic slip was the primary deformation mode at the tensile interval.Accordingly,the corresponding stress-strain curve displays a concave-down shape.The plastic deformation in the compressive reversal is dominated by{10-12}tension twinning and the curve shows a plateau shape due to the low work hardening of the twinning.At the subsequent tensile reversal,detwinning and prismatic slip dominated the deformation.The curve presents a sigmoidal shape curve owing to the difference in work hardening caused by the two deformation modes.Thence,the TD sample shows obvious asymmetry in hysteresis loops like AZ31 Mg alloy,etc.

Fig.15.Schematic diagram illustrating the evolution of deformation modes and stress concentration of ED and TD samples during cyclic deformation.

Fig.16.Strain energy density during cyclic deformation of the ED and TD samples:(a) general definitio of the plastic/elastic strain energy density developed in LCF testing with the strain ratio of −1,and E1 and E2 are Young’s Modulus at loading and unloading,respectively;(b) the hysteresis loops of TD and ED samples at half life with the strain amplitude of 0.4% and 1.6%;(c) total strain energy density (Wt) and plastic strain energy density (Wp) distribution of the TD and ED samples at half life with the strain amplitude of 0.4%−1.6%;(d) corresponding distribution of elastic strain energy density (We).
It is well established that the cyclic-stress response is mainly related to the competitive processes between the hardening process resulting from the multiplication of dislocations and the formation of twins,and the softening process due to the annihilation and rearrangement of dislocations,propagation and coalescence of micro-crakes [21,47].Therefore,the different cyclic hardening/softening behavior of the ED and TD samples could be associated with the distinct deformation modes.For the ED sample,due to the multiplication of dislocations,both peak and valley stresses increased during the firs 6 cycles (stage I).Then,during the stage II,the balance between the hardening owing to the multiplication of dislocations and softening due to the annihilation and rearrangement of dislocations made the peak and valley stresses increase slightly during most of the fatigue life (until the 293rd cycle,92.7% of the fatigue life).Finally,during the stage III,initiation,propagation and coalescence of micro-crakes resulted in sharp drop in the tensile peak stress.Micro-crakes showed less impact on the compressive valley stress so it decreased slightly until fatigue failure [19].Wang et al.[27,31] also reported similar cyclic hardening/softening behavior during the fatigue of the GW83 Mg-RE alloy where basal dominated the cyclic deformation.In the case of the TD sample,twinning and detwinning contributed more to the cyclic deformation.The TVF rose with increasing cycle number which was also observed in AZ31 alloy throughin-situneutron diffraction[21].Moreover,the increasing dislocation debris would act as barriers to obstruct the twin movement [21].The above two factors together generated the moderate cyclic hardening of the valley stress (stage II,10th-114th cycle,79.2% of the fatigue life).However,the increasing twins with cycling would prolong the exhaustion of detwinning and resultantly decreased the slip-dominated deformation,which would be a key reason for the moderate softening of the peak stress.
The fatigue lives of the ED samples were higher than that of the TD samples at various strain amplitudes.It is widely accepted that the fatigue life of Mg alloys is closely related to the input energy in cyclic loading [63,64].The relation can be written as:

whereΔWtis the total strain energy density at half life,which is the algebraic sum of the plastic train energy density (ΔWp)and elastic energy density (ΔWe),as illustrated in Fig.16(a).Nfis the fatigue life,andcandmare the material constants.After the logarithmic operation,the formula can also be written as:
Clearly,a negative linear relationship exists betweenlgWtandlgNf,that is,a higherWtleads to a lowerNf.Fig.16(b)shows representative hysteresis loops of the two samples at half life at strain amplitudes of 0.4% and 1.6%.Fig.16(c,d)displays theΔWt, ΔWp,andΔWeof the two kinds of samples at various strain amplitudes.TheΔWt, ΔWp,andΔWevalues of the TD samples are higher than those of the ED samples at various strain amplitudes.As discussed in Section 4.1,the low CRSS of basal slip coupled with the high mean SF value generated the lower strain energy density in the ED sample,compared with the TD sample.Meanwhile,the mean stresses of the TD samples are higher than ED samples during cyclic loading as presented in Fig.3(d).Higher mean stress could promote the initiation and propagation of cracks,leading to the reduction in fatigue life [65].Therefore,higher strain energy density together with higher mean stress resulted in the shorter fatigue life of the TD sample compared with the ED sample.
5.Conclusions
In this work,an obvious in-plane anisotropy of cyclic deformation behavior was observed in an extruded Mg-3Y sheet with RE texture.The ED samples displayed better fatigue resistance with almost symmetrical hysteresis loops,lower mean stress and longer fatigue life compared with the TD samples.The influence of the texture on the deformation modes,cracking modes,and cyclic mechanical behaviors were systemically investigated.The key conclusions are summarized as follows:
(1) Under monotonic loading,basal slip dominated the deformation of the ED sample in both tension and compression.For the TD sample,prismatic slip and{10-12}tension twinning were the primary deformation modes in the tension and compression,respectively.
(2) The transition of cyclic deformation modes for the ED and TD samples shows significan texture dependency,which can be summarized as:(I) the ED samples:basal slip (at the initial tensile interval) →basal slip (at the successive compressive reversal).Basal slip served as the primary deformation mode throughout the fatigue life;(II) the TD samples:prismatic slip (at the initial tensile interval) →{10-12} tension twinning (at the successive compressive reversal) →detwinning+prismatic slip (at the tensile reversal).
(3) The activation of various deformation modes is jointly determined by the CRSS of the deformation mode and the corresponding SF.For the ED samples,the basal slip dominated the cyclic deformation resulting from the lower CRSS and higher SF of basal slip.For the TD samples,prismatic slip served as the primary deformation mode at the initial tensile interval due to its higher mean SF value.In the subsequent compressive reversal,the favorable orientation and low CRSS enabled the activation of twinning.At the subsequent tensile reversal,detwinning dominated the plastic deformation owing to its low CRSS and favorable orientation.Prismatic slip dominated the tensile deformation again when the detwinning was exhausted.
(4) The anisotropy in mechanical behavior can be attributed to the high texture-dependency of the activation of deformation modes.In the ED samples,the symmetrical hysteresis loops was associated with basal-slipdominated cyclic deformation at both tensile and compressive reversals.For the TD samples,the striking difference between the deformation modes at compressive(twinning-dominated deformation) and tensile reversals(detwinning and prismatic slip dominated deformation)produced the asymmetric hysteresis loops and higher mean stress.
(5) Texture displayed a great influenc on cracking modes.In the ED samples,intergranular cracking and PSB cracking were the primary cracking modes,which can be attributed to the dislocation-slip-dominated deformation.The TD sample showed the high tendency of TTW-cracking,resulting from the high activity of twinning-detwinning behavior.
(6) Compared with the TD sample,the longer fatigue life of the ED sample can be attributed to the lower total strain energy density and lower mean stress,which are derived from the basal-slip-dominated deformation throughout the fatigue life.
Acknowledgments
This work was co-supported by the National Natural Science Foundation of China (51575068 and 51501023),the State Key Research and Development Program of MOST,China(2016 627 YFB0701204),Project No.2020CDJDPT001 supported by the Fundamental Research Funds for the Central Universities,Chongqing Natural Science Foundation,No.cstc2018jcyjAX0364,the“111''Project (B16007)by the Ministry of Education for financia support,and Chongqing Natural Science Foundation,No.cstc2021jcyjmsxmX0699.We would like to thank the Electron Microscope Center of Chongqing University for assistance with SEM/EBSD characterization.
 Journal of Magnesium and Alloys2022年6期
- Journal of Magnesium and Alloys的其它文章
- EDITORIAL BOARD
- Aims and Scope
- Surface oxidation study of molten Mg-Al alloys by oxide/metal/oxide sandwich method
- Production and characterisation of new bioresorbable radiopaque Mg-Zn-Y alloy to improve X-ray visibility of polymeric scaffolds
- Quantitative study on the tension-compression yield asymmetry of a Mg-3Al-1Zn alloy with bimodal texture components
- Microstructure analyses and phase-fiel simulation of partially divorced eutectic solidificatio in hypoeutectic Mg-Al Alloys