
Corrosion behavior of Mg-Zn-Zr-RE alloys under physiological environment -Impact on mechanical integrity and biocompatibility
2022-07-26 11:40:58MrwAbdelGwdChudhryUsmnVsnthShunmugsmyIbrhimKrmnBillMnsoor
Journal of Magnesium and Alloys 2022年6期
Mrw AbdelGwd ,Chudhry A.Usmn ,Vsnth C.Shunmugsmy ,Ibrhim Krmn ,Bill Mnsoor,,∗
a Mechanical Engineering Program,Texas A&M University at Qatar,Education City,Doha,Qatar
bDepartment of Mechanical Engineering,Texas A&M University,3123 TAMU,College Station,TX 77843,United States of America
c Department of Materials Science and Engineering,Texas A&M University,3003 TAMU,College Station,TX 77843,United States of America
Abstract Benefit of RE addition on Mg alloys strength and corrosion resistance are widely reported but their effects on biodegradability and biocompatibility are still of concern.This paper investigates the effect of RE additions on biodegradability of Mg-Zn alloys under simulated physiological conditions.In this context,two commercial Mg-Zn-Zr-RE alloys,namely ZE41 and EZ33,with same RE addition but different concentrations are studied in Hank’s Balanced Salt Solution(HBSS)at 37°C and with pH of 7.4.Weight-loss,hydrogen evolution,real-time insitu drop test,electrochemical impedance spectroscopy (EIS) and potentiodynamic polarization are deployed to study corrosion characteristics.The mechanical integrity of both alloys is assessed by mechanical testing post immersion.Furthermore,in vitro biocompatibility is evaluated by indirect cytotoxicity tests using NIH3T3 cells.Results reveal that although both alloys showed similar microstructure,size and distribution of precipitates played a significan role on its corrosion response.EIS and open circuit potential results show stable fil formation on EZ33,while ZE41 showed passive layer formation followed by its deterioration,over the analyzed time period.Using real-time drop test,it was shown in ZE41 alloy that both T-phase and Zr-rich precipitates acted as micro cathodes,resulting in an unstable surface film In EZ33,Zr-rich regions did not influenc corrosion response,resulting in better corrosion resistance that was corroborated by post-immersion surface morphology investigations.The higher degradation observed in ZE41 alloy resulted in higher drop in fl xural and tensile strength compared to EZ33 alloy.In addition,cytotoxicity tests on NIH3T3 cells revealed that cell viability of EZ33 increased with increasing incubation time,contrary to ZE41,owing to its lower biodegradation behavior and despite higher concentrations of REs.Present results show that an increase in RE concentration in EZ33,relative to ZE41,had a positive effect on corrosion rate that subsequently controlled alloy mechanical integrity and biocompatibility.
Keywords: Magnesium alloy;Corrosion;EIS;Mechanical integrity;Cytotoxicity.
1.Introduction
Load-bearing orthopedic implants are intended to assist bone healing process for a limited period of time.In this regard,biodegradable implants can help eliminate the need for subsequent removal surgery and avoid complications arising from long-term presence of implants in the human body.These implants should have sufficien mechanical strength to support bone healing process and timely corrode without causing any toxic effects after serving their purpose[1,2].Furthermore,the type,dosage and,release rate of ions and byproducts during temporary implant biodegradation influence toxicity and may cause inflammatio or even local anaphylaxis [3].Thus,understanding biodegradability (that is,corrosion response of implant material in physiological environment) and its impact on mechanical integrity and biocompatibility is fundamental to enable safe,clinical use of degradable implants.Mg alloys have certain inherent characteristics which make them more attractive for biodegradable implant applications [4],in comparison to Zn [5-7] and Fe-based alloys[8-10].Mg alloy implants have been reported to promote tissue and bone growth when implanted as bone fixture in vivo,hence increasing implant stability [3,4,11,12].However,the corrosion rate of Mg alloys is much faster than what the human body can tolerate/absorb.In addition to the release of corrosion by-products,hydrogen gas is produced during corrosion of Mg and could lead to implant hydrogen embrittlement and surrounding soft tissue inflammatio [13,14].Therefore,the main challenge hindering widespread adaptation of Mg-based degradable implants remains to be their high corrosion rate accompanied with profuse evolution of hydrogen gas that results in premature loss of implant’s mechanical integrity and may lead to cytotoxicity before complete bone healing [15-20].
The above challenges have been addressed through (i) developing new Mg alloys containing biocompatible alloying elements[21-24]and(ii)investigating many existing Mg alloys with an aim to fin the ones with slower corrosion rate [25-33].Multicomponent Mg alloys with additions of Zn,Zr,Ca,Ag and rare earths (RE) among many others,have been considered for biodegradable implant applications with promising results [4].In such efforts,effective alloying and/or deformation processes have been pursued to achieve improvements in strength,corrosion resistance and mitigation of hydrogen gas evolution.Previously reported work involved adding trace amounts of Ca and Ag to Mg alloy ZK60 and investigating the effect of severe plastic deformation through equal channel angular pressing (ECAP) on mechanical and corrosion properties [29].Although ECAP succeeded in improving ultimate tensile strengths of ZK60,grain refinemen increased micro-galvanic corrosion between the secondary phases and matrix,specificall within the shear zones,and resulted in an accelerated corrosion response [29].Furthermore,Mg alloys with higher contents of alloying elements have been explored with the aim to design secondary phases or precipitates that are anodic to the alloy matrix to increase the corrosion resistance [34-36].But in case of Mg alloys,almost all known secondary phases or precipitates (except Mg2Ca) are cathodic to the Mg-rich matrix and lead to the formation of microgalvanic couples that deteriorates the corrosion performance[1,37-40].
Existing Mg alloys designed for structural applications with simpler binary or ternary systems have also been extensively investigated in order to uncover fundamental aspects and challenges associated with biodegradability [41-44].Several studies on biodegradable Mg-RE implants have reported promising results such as decreased degradation rates and enhancement of new bone formation [4,42,45,46].REs (mischmetal) are added to Mg to increase mechanical strength,creep resistance and corrosion resistance for use in the transportation industry [43,46-48,[48].Comparison of mechanical properties of different binary Mg alloy systems found that Mg-RE alloys displayed the highest strength and elongation compared with other binary Mg alloy systems [4].Zn is another important alloying component that has well established biocompatibility in the human body and is wellknown for its strengthening effect on Mg.Binary Mg-Zn alloys possess improved in vitro and in vivo corrosion resistance,and it has been shown that Zn-rich alloys formed minimal hydrogen gas [49-51].Zr is well known for its excellent grain refinemen capabilities and,when added to Mg,helps improve mechanical strength and corrosion resistance [39,52,53].Specificall,Mg-Zn-RE alloy system is reported to have superior mechanical properties and corrosion resistance [54-57].
Orthopedic implants are subjected to different loading conditions (tension,compression,bending,torsion,etc.,often multi-axial),that can be repetitive,so evaluating their mechanical integrity is crucial [20].Corrosion-driven phenomena such as stress corrosion cracking,corrosion fatigue,pitting,and hydrogen embrittlement in physiological environments can pose significan limitations.A sudden implant failure may pose serious danger to patients’ health and necessitate emergency removal and reimplantation surgeries.Mg alloys have been characterized for in-vitro mechanical integrity by performing mechanical characterization on pre-immersed or in-situ specimens [19,58-61].For example,mechanical integrity of Mg-6 Zn alloy was evaluated by performing fl xural tests on specimens immersed in physiological saline(0.9 wt.% NaCl) solution [49].Corrosion rate was evaluated using weight loss method,and fl xural testing on immersed specimens showed 40% decrease in fl xural strength after 20% weight loss i.e.,significan deterioration of mechanical integrity.An initial rapid reduction in fl xural strength was observed owing to surface defects (corrosion pits),followed by stable decrease attributed to formation of protective oxide layer.
The other important aspect which is directly influence by biodegradation kinetics is the biocompatibility of an alloy.Material biocompatibility depends on three main factors:(a) innate toxicity due to its composition,(b) extent of its absorption in the host environment linked to the release rate of its ions and corrosion byproducts,and (c) host environment’s ability to either eliminate or transform released species into less harmful substances [1].Among these factors,understanding the impact of alloy chemistry and its overall corrosion rate on biocompatibility (normally established by cytotoxicity studies) are essential from a biodegradable alloy design standpoint.Interestingly,RE elements are found in most of the patented Mg-alloys for biodegradable implant applications [61-66],and Mg-RE alloy based (WE43) cardiovascular stents have already entered the market [26,45,67,68].However,study on in vivo administration of RE elements to rat animal model has shown retention of these elements in different organs,causing multiple complications [69,70].It should be noted that these results are caused by exposure to high doses of REs.Therefore,a controlled release of these elements in the human body still requires further investigation,to be able to balance the mechanical and corrosion enhancement due to RE addition to Mg alloys while maintaining cytocompatibility.
In summary,there is strong evidence of improved mechanical and corrosion response of RE containing Mg alloys.But to justify the use of expensive REs as alloying components for temporary implant materials,their biodegradability and,as a consequence,mechanical integrity and biocompatibility needs to be further explored.The deterioration in their mechanical properties post-exposure as a function of time needs to be systematically studied to understand synergistic effect of microstructural changes on mechanical properties that occur due to exposure to corrosion medium.Therefore,the primary aim of this paper is to understand the effect of RE additions(Ce,La and Nd) on corrosion characteristics of Mg-Zn-Zr-RE alloys,known for their homogeneous,fine-graine microstructure with moderate strength and ductility.Two commercially available alloys in artificiall aged T5 condition were selected as model materials,namely ZE41 and EZ33,with similar alloying components added in different concentrations.Weightloss,hydrogen evolution,and electrochemical techniques were deployed to evaluate the corrosion response and the processes occurring at the electrode/electrolyte interface and the alloy surface,under simulated physiological environment.Later,the effect of corrosion on their mechanical integrity and biocompatibility is studied by mechanical testing on immersed materials and indirect biocompatibility testing on alloy extracts.The responses of these two Mg-RE alloys are then compared and contrasted,and mechanisms for the differences in these two alloys discussed in detail.
2.Materials and methods
Commercial as-cast plates of ZE41A and EZ33A alloys heat treated at T5 condition (as-cast followed by artificia aging) are investigated in this study.The nominal compositions of the two alloys are shown in Table 1.Samples of required dimensions were cut from the plates using electrical discharge machining (EDM) and used for the various characterization experiments.Note that throughout the manuscript the two alloys in T5 temper condition is referred to as-received-T5.
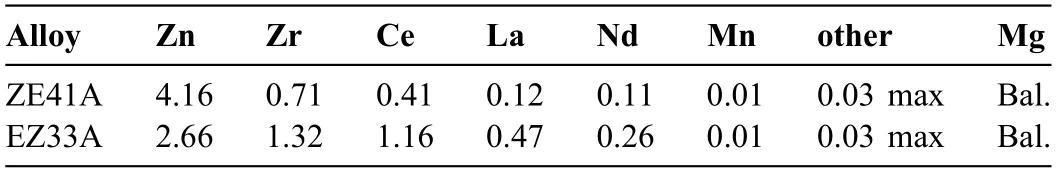
Table 1 Nominal composition of ZE41A and EZ33A alloys in T5 condition (wt.%.).
2.1.Microstructure characterization
To investigate the microstructures,disk-shaped samples were mounted in epoxy resin and mechanically ground up to 1200 grit followed by polishing using 3 μm diamond suspension.Microstructures of various samples were characterized using FEI Quanta 400 scanning electron microscope (SEM)with backscatter electron (BSE) imaging and Energy Dispersive X-ray spectroscopy (EDX) operated at 25 KeV.To analyze the grain size,samples were etched using acetic picral solution made up of 10 ml acetic acid,4.2 g picric acid,70 ml ethanol and 10 ml distilled water.Image J software was used to conduct grain size analysis for each alloy where more than 50 grain diameters were measured and averaged using optical micrographs.
2.2.Immersion tests
Weight loss and hydrogen evolution tests were carried out simultaneously following the protocol described by Shi et al.[71] in Hank’s Balanced Salt Solution (HBSS) at 37 ± 1 °C with at least two duplicates.Prior to mounting in epoxy,the sides of the EDM-machined,disk shaped samples with~1.7 cm2cross-sectional area were grinded up to 1200 grit to avoid crevice corrosion and ultrasonically cleaned in ethanol.The specimens were then cold mounted,and the exposed surfaces were grinded and polished using 3 μm diamond suspensions before being cleaned again in ethanol in an ultrasonic bath.An epoxy mount of exact dimensions to the mounted samples was prepared to serve as a reference and used to exclude any influence in weight due to the mount.
Beakers fille with HBSS were placed in a warm water bath before starting the experiments to maintain the temperature at 37 °C.Each alloy specimen was suspended under an inverted funnel inserted inside each of the beakers with a burette fi ed on top and fille with the electrolyte to collect the evolved hydrogen gas.The pH of the solution was monitored and controlled at 7.4±0.1 using BlueLab pH controller which was set to measure the pH every minute and approximately buffer the solution using a 0.1 M HEPES [4-(2-hydroxyethyl)-1-piperazineethanesulfonic acid] buffering solution.The beakers were covered with parafil to minimize evaporation and the water bath level was monitored daily to ensure there was sufficien water surrounding the beakers.The volume of hydrogen evolution was measured visually as a function of immersion time by recording the decrease in solution level inside the burette.Measurements were taken hourly for the firs 8 h and then daily up to 7 days.At the end of each experiment,specimens were cleaned in 20 wt.%CrO3and 1 wt.% AgNO3to remove corrosion products,then washed with distilled water and dried in air before being weighed.Weight loss measurements and surface morphology SEM analysis were carried out on corroded specimens after 1,4 and 7 days after the removal of corrosion products.
Corrosion rates determined from hydrogen evolution tests(CRH) were calculated in mm/yr using the following equation[71]:

whereVHis the volume of evolved hydrogen as measured from the burette (ml),Ais the exposed surface area andtis the time.The corrosion rates from weight loss (CRWL) in mm/yr was evaluated using [72]:

whereAis the exposed surface area,tis the time andρis the density of the alloy.

Fig.1.BSE micrographs of as-received (a,b) ZE41 and (c,d) EZ33 in T5 condition.Intergranular T-phases are indicated by the blue arrows and the intermetallic particles within the halo-shaped regions in the grain interior are shown by the red arrows.The average grain size was found to be~40 μm for both alloys while the volume fraction of precipitates was 4.96% and 7.09% in ZE41 and EZ33,respectively.
2.3.Electrochemical characterization
The electrochemical behavior of ZE41 and EZ33 were performed using Gamry series G 300TMPotentiostat at 37±1°C in HBSS using a Gamry MultiPortTMcorrosion cell with a typical three-electrode setup.The cell consisted of a graphite counter electrode,an Ag/AgCl reference electrode and the Mg alloy specimen encapsulated in epoxy resin with an exposed area of 1 cm2.The volume of HBSS was maintained at 800 ml and specimens used were of the same size as the samples used in the immersion tests and were prepared using the same procedure.
Electrochemical Impedance Spectroscopy (EIS) was conducted every hour for a total of 9.5 h(570 mins).Since buffering was not possible during EIS,the pH was not maintained,and the testing time was kept below 24 h (i.e.9.5 h) to minimize the increase in pH.The pH was monitored throughout the test period and was found to fluctuat between 6.5 and 8.The minimal change in pH was attributed to the large ratio of solution to exposed area and since the passivity of Mg occurs at a pH above 10.4[73],it was reasonable to compare the EIS results post 8 h of immersion with the buffered 8 h hydrogen evolution or weight loss tests.EIS testing was initiated after 10 mins of immersion to ensure the temperature was stabilized at 37 °C.At each time point,Open Circuit Potential(OCP) was conducted first followed by EIS which was performed by sweeping the frequency from 105to 10−2Hz at 10 mV amplitude of sinusoidal potential signals with respect to open circuit potential (OCP).Potentiodynamic polarization(PD) was measured by scanning the electrodes from −2.0 to+1.5 V vs.EOCPwith a scan rate of 1 mV/s and it was performed at the end of the test.Two duplicates were used for each alloy.

Fig.2.EDS spectra obtained by point and line scans for (a,b) ZE41 and (c,d) EZ33,respectively.The point scans were carried out on α-Mg matrix (marked 1),T-phase (marked 2) and intermetallic particle within halo-shaped regions (marked 3) while the line scans represent the variation of elements throughout the microstructure.

Fig.3.Average corrosion rate of ZE41 and EZ33 immersed in HBSS at 37 ± 1 °C,obtained from hydrogen evolution.Hourly readings were taken for the firs 8 h and then daily readings were taken up to 7 days.Dotted lines represent the average corrosion rates for each alloy.Inset shows same data but for the firs 15 h.
2.4.Drop test
The two alloys in T5 condition were subjected to in-situ corrosion tests also known as drop test,by wetting the exposed 1 cm2polished surface with 3.5% NaCl and monitoring the samples in real time using an optical microscope.This test was mainly aimed at capturing the effect of different microstructural features on corrosion front evolution,propagation and micro-galvanic effects.The test lasted for total time period of 420 mins and solution on the specimen surface was refreshed every 10 mins.
2.5.Mechanical testing
To evaluate the mechanical properties of the as-received alloys in T5 condition,uniaxial tension and compression tests were conducted using an electromechanical MTS Insight 30 kN machine at an initial strain rate of 10−3/s at 37 °C using a three-zone furnace [74].Tensile specimens had a gage length of 11 mm and a cross-sectional area of approx.8.5 mm2.Compression specimens were cylindrical with 3 mm diameter and about 5.5 mm height.Both tests were conducted in triplicates.To evaluate the mechanical integrity of both alloys,post-immersion mechanical tests were carried out on the ZE41 and EZ33 specimens after being immersed in HBSS at 37 °C for different durations.3-point bend tests were performed on as-received and post-immersion samples after being immersed for 1,4 and 7 days.Specimens had a span length of 30 mm and width and thickness of about 4.5 mm and 3 mm,respectively,and were prepared following the same protocol described earlier for microstructure analysis prior to immersion.After immersion,corrosion products were removed using the same cleaning procedure and three-point bending was performed at a constant crosshead displacement of 5 mm/min.Flexure stress (σf) and strain (εf) were calculated from load-displacement curves using the following equations:

wherePis the applied load,Lis the span length,Dis the maximum deflectio at the center of the specimen andbanddare the width and thickness of the specimen,respectively.Flexure tests were repeated at least once to verify the validity of the results.Post-immersion tensile testing was also performed to corroborate the results obtained through bending tests.Tensile specimens of similar dimensions were grinded and polished and immersed in HBSS maintained at 37 °C for 7 days.Post-immersion tensile tests were carried out at the same testing conditions prior to immersion and the results were compared to tensile properties of the as-received samples.In addition,Vickers microhardness measurements on the as-received and immersed alloy samples were taken at room temperature using 50 gf load and 15 s dwell time.In order to establish an understanding on the evolution of mechanical integrity,post-immersion fl xural and tensile properties were evaluated using the original cross-sectional area of the test specimens,which is consistent with existing literature[19,30,75] and discussed further inSection 3.3.
2.6.Cytotoxicity characterization
Indirect MTT (methylthiazolyldiphenyl-tetrazolium bromide) assay was used to evaluate the cytotoxicity of ZE41 and EZ33 based on the ISO-10,993-5 [76].A mouse embryonic fibroblast cell line (NIH3T3) was used in the experiments.The cells were maintained in controlled humidity incubator with 5% CO2at 37 °C in suitable culture medium.The culture medium consisted of Dulbecco’s Modifie Eagle’s Medium (DMEM) supplemented with 10% fetal bovine serum (FBS),100 units/ml penicillin and 100 μg/ml streptomycin.The control group consisted of the same DMEM culture medium,without metal extracts,for a negative control.In this study,10 mg alloy samples in powdered form were soaked in 10 ml of 10%FBS supplemented DMEM giving an initial metal to medium concertation of 1000 μg/ml.Note the Mg alloys were exposed to the cell culture media in powdered form to maximize the surface area to extraction medium ratio.Later the extraction medium with metal powders was incubated in a humidifie atmosphere at 37 °C for 3-or 8-days.Then their solution was centrifuged at 1500 rpm for 5 min and then extracted yielding the supernatant flui or the extracted mediums.

Fig.4.SEM images showing the changes in the surface morphology of ZE41 due to corrosion after different immersion times in HBSS at 37 ± 1 °C,corrosion product removed.(a) and (b) immersion for 1 day;(c) and (d) immersion for 4 days;(e) and (f) immersion for 7 days.Red arrows show unaffected Zr-rich halo-shaped regions around the intermetallic particles while the red circled area in (d) shows where grains have fallen off.

Fig.5.SEM images showing the changes in the surface morphology of EZ33 due to corrosion after different immersion times in HBSS at 37 ± 1 °C,corrosion product removed (a) and (b) immersion for 1 day;(c) and (d) immersion for 4 days;(e) and (f) immersion for 7 days.Red arrows show unaffected Zr-rich halo-shaped regions around the intermetallic particles.The red circled areas show intergranular corrosion in (a) and regions where grains have fallen off in (e).

Fig.6.Evolution of open circuit potential of ZE41 and EZ33 Mg alloys during 570 mins of immersion in HBSS maintained at 37 ± 1 °C.
The cellswere seeded in a 96-well plate with 10% FBS supplemented DMEM (100 μl/well) and the well was maintained under controlled conditions for 24hrs and then exposed to the extracted mediums for 24,48 and 72 hrs to allow cell attachment.Loss of cell viability was measured using the MTT assay,where 20 μl of MTT was added to each well and samples were incubated for 3 h at 37 °C.Each well was supplemented with DMSO (100 μl/well) as a stop solution and incubated for 20 mins before being photometrically quantifie at an absorption wavelength of 570 nm to acquire the optical density (OD).The cell viability for each case was calculated as a percentage of the OD of a particular sample versus the OD of the negative control.Note that three realizations were performed for each test condition.The data from cytotoxicity tests were expressed in terms of average values ± standard deviation.The statistical analysis was also performed using Prism 5 software (GraphPad,US) where unpaired two-tailedt-test was used to compare the difference in optical density between the controls and alloy test solution.The differences were considered statistically significan if thep-value was<0.05.
3.Results
3.1.Microstructure
The Backscattered electron (BSE) images in Fig.1 present the microstructures of ZE41 (a,b) and EZ33 (c,d),respectively.The low-magnificatio images in (a) and (c) are representative of the overall microstructure where the Mg matrix and secondary phases around the grain boundary can be easily observed.Since both ZE41 and EZ33 are from the same alloy group,their microstructures show similar features.Three main microstructural features similar in both alloys include:α-Mg matrix with equiaxed grains of~40 μm;small Zr-rich intermetallic particles distributed within the grain interior,and eutectic T-phase distributed (blue arrows) in a semi continuous manner along the grain boundaries [77].Furthermore,light-colored halo-shaped zones (red arrows) formed around the Zr-rich intermetallic particles within the grain interior are also observed in both alloys.Similar results were reported for ZE41 with T5 condition by Neil et al.in which the T-phase primarily formed at the grain boundaries and Zr-rich intermetallic particles were found inside the grains surrounded by a light contrast zone [77].During solidificatio of Zrcontaining Mg alloys,Zr-rich cores nucleate firs due to peritectic solidificatio around which Mg solidifie resulting in the formation of these lightly colored zones within the grains as well as a more refined homogenous microstructure [78].The main distinguishing microstructural features between the two alloys are the morphology and distribution of both Tphase and Zr-rich precipitates.As can be seen by comparing Fig.1(b) and (d),T-phase in EZ33 is relatively thicker due to its higher wt.% fraction of REs,more continuous and interconnected and has a higher volume fraction (7.09% versus 4.96% in ZE41).
The T-phase in Mg-Zn-RE alloy system has been observed to exhibit varying composition based on the alloy composition[77,79-81].The T-phase composition in ZE41 is Mg7Zn3RE[77,82-84] while in EZ33,the secondary phase is reported as RE(Mg,Zn)11[79,85,86].The results of EDX point and line analyses carried out on both alloys are shown in Fig.2(a)through (d).EDX results indicate that the REs are primarily located within the T-phase and not found within the grain interior.It was found that the small intermetallic particles and the halo-shaped regions around them are Zr-rich which is consistent with previous reports [77,84,87].Another important findin revealed by EDX line scan is that the concentration of Zr starts to increase throughout these halo-shaped regions and reaches its maximum at the intermetallic particles;while it decreases significantl when scan is translated towards the edges of the grain [77] (Fig.2).The SEM images and EDS line scan analysis show that the Zr-rich precipitates are more concentrated in ZE41 compared to EZ33 alloy (comparing Fig.1(c) and (d) also comparing Fig.2(b)and (d)).Coincidentally,in case of Mg,a drop in concentration was witnessed at the grain boundaries and at the Zr-rich halo-regions,although these regions are located within theα-Mg matrix.These compositional gradients play an important role in the corrosion behavior of these particular zones,as discussed later.
3.2.Corrosion behavior
3.2.1.Hydrogen evolution
Figure 3 presents the average corrosion rate in mm/yr of ZE41 and EZ33 obtained by hydrogen evolution as a function of immersion time.Hydrogen evolution samples were immersed for a total of 7 days.Hourly readings were recorded for the firs 8 h and then daily readings were recorded.This was done to capture the corrosion response during short as well as extended immersion times.In ZE41,there was an incubation period where corrosion rates were initially low during the firs few hours,followed by a sharp increase.In contrast,the response for EZ33 demonstrated a signifi cant increase in the corrosion rate for short immersion times followed by a slow decrease.Nevertheless,both alloys approached a near steady state behavior after 24 h with little variation in corrosion rate thereafter.Overall,corrosion rate of ZE41 was higher than EZ33 with an average value of 12.9 ± 1.3 mm/yr compared to 3.6 ± 0.7 mm/yr for EZ33.However,it is important to note that during the initial incubation period for ZE41,the corrosion rate was lower compared to the sharp increase in corrosion rate witnessed in EZ33 at the start of immersion experiments before approaching a steady state and this in turn had a direct effect on the corrosion morphology described later.Corrosion rates for both alloys were also determined using weight loss to validate the rates obtained through hydrogen evolution.Weight loss measurements were taken after 1,4 and 7 days and the respective average rates obtained at the end of the 7th day were 13.7 ± 0.5 mm/yr for ZE41 and 5.0 ± 1.4 mm/yr for EZ33 which are close to the data obtained via hydrogen evolution analysis.These finding are consistent with the morphological changes observed in the microstructure of the immersed samples of the two alloys shown in Fig.4 and Fig.5.
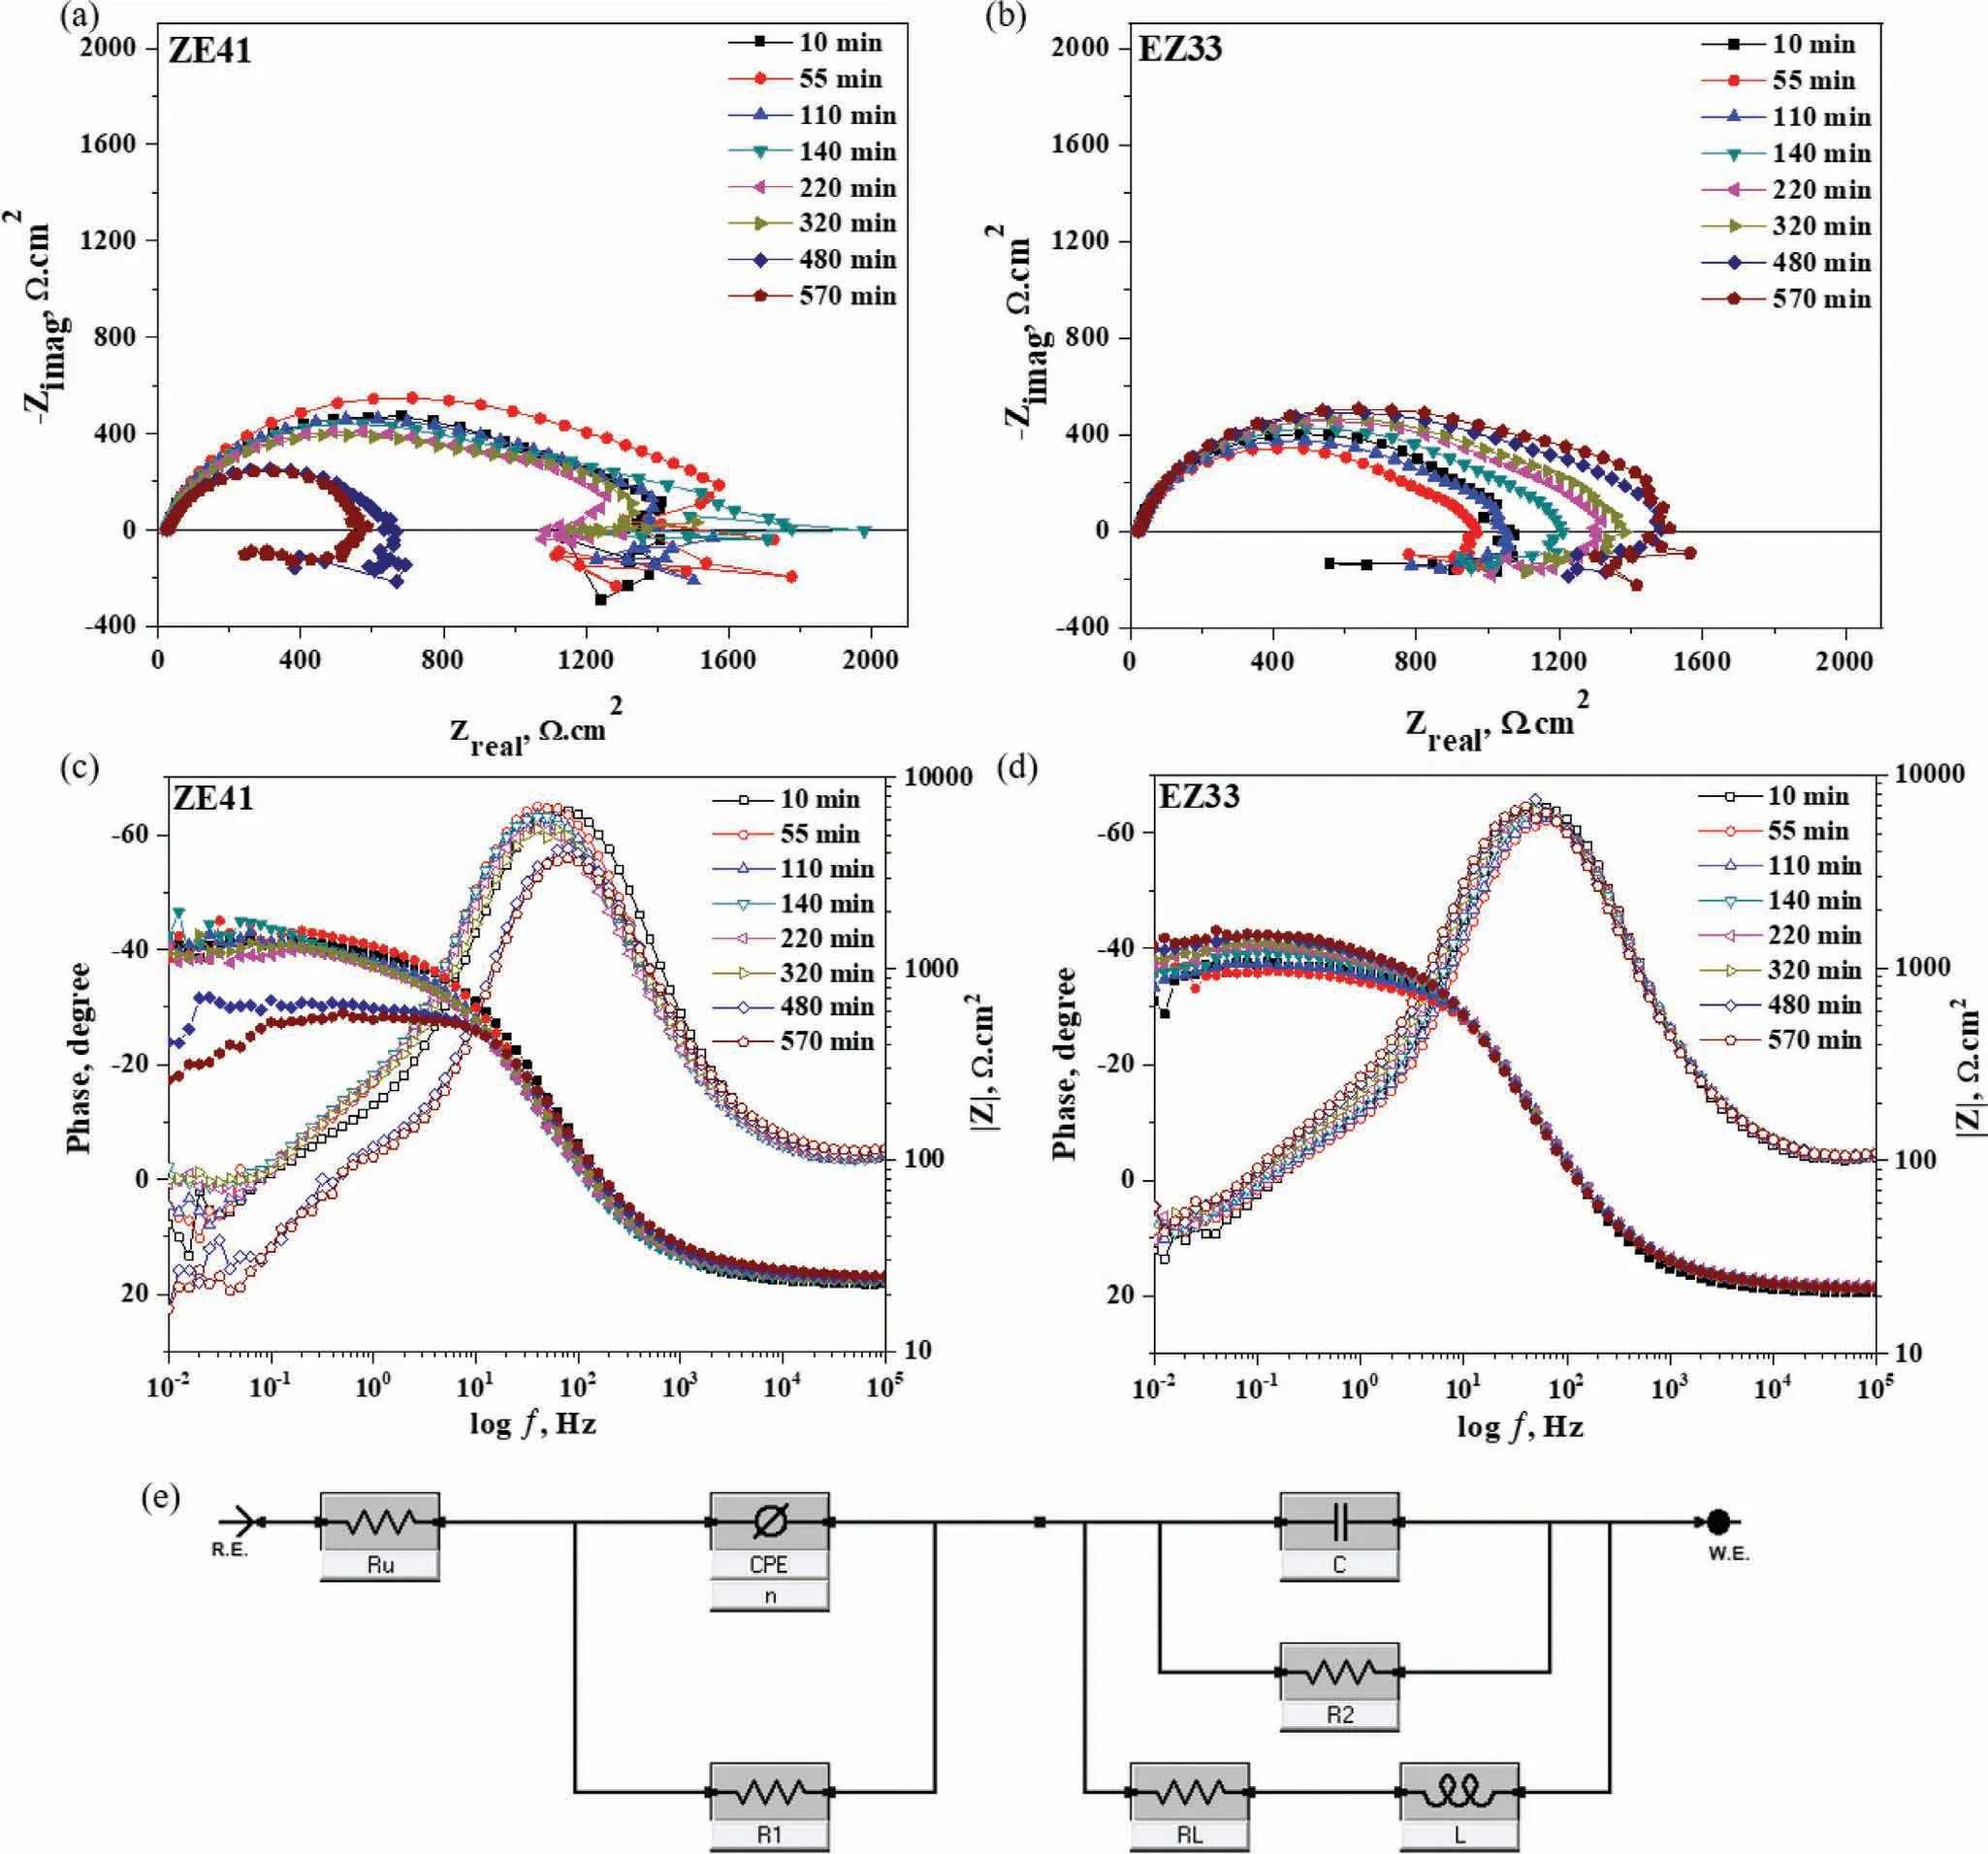
Fig.7.Evolution of (a,b) Nyquist plots and (c,d) Bode plots (phase angle) during 570 min of immersion in HBSS maintained at 37 ± 1 °C.(a,c) and (b,d) correspond to ZE41 and EZ33 Mg alloys,respectively.(e) Equivalent circuit used for the fittin the EIS data of both ZE41 and EZ33 Mg alloys obtained during 570 mins of immersion in HBSS maintained at 37 ± 1 °C.
3.2.2.Corrosion morphology

Fig.8.(a) Nyquist and (b) Bode plots (phase angle) for ZE41 and EZ33 Mg alloys after 10 and 570 mins of immersion in HBSS maintained at 37±1°C.These plots capture the progression of corrosion behavior of each alloy as immersion time increases.
Figure 4 and Fig.5 present SEM images of ZE41 and EZ33 samples after immersion for different durations following removal of corrosion products.Fig.4(a) and (b) show the surface morphology of ZE41 after 1 day of immersion where the hydrogen evolution rate was the lowest in comparison to EZ33.Corrosion was predominantly uniform with attack initiating around the secondary T-phases close to the grain boundaries,as can be seen in higher magnification while the grains’interior remains unaffected(Fig.4(b)).Since the T-phase precipitates were predominantly along the grain boundaries,the corrosion occurred intergranular across the grains.Long,empty valleys surrounding the grains indicate the trenching and eventual falling off,of the T-phases along these regions.Following the dissolution around the T-phase precipitate,dissolution also occurred in the grains with Zrrich particles acting as cathodes.This can be observed in the 4 day immersed ZE41 specimen,where aggravated localized attack were observed in the middle of grains,as shown in Figure 4(c and d).The voids resulting from the precipitate loss and further corrosion attack leads to detachment of grains.By the end of the immersion period (7 day),top surface layers of grains have detached,exposing a fresh layer of grains underneath with signs of mild corrosion already commencing (Fig.4(e)).
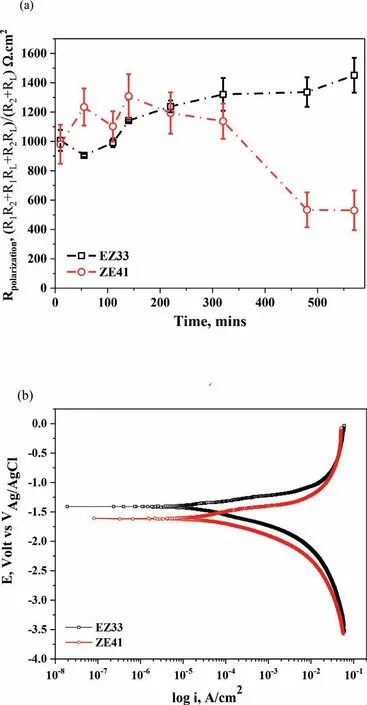
Fig.9.(a) Evolution of polarization resistance (Rp) vs.time of ZE41 and EZ33 throughout the 570 mins of immersion in HBSS maintained at 37 ± 1 °C.(b) Potentiodynamic polarization curves of ZE41 and EZ33 obtained after 570 mins of immersion in HBSS maintained at 37 ± 1 °C.
By comparison,the progression of corrosion in EZ33 is presented in Fig.5.Similar to ZE41,preferential corrosion attack is witnessed around the T-phase after 1 day of immersion (Fig.5(a)).The SEM images show evidence of matrix corrosion along the grain boundaries close to the secondary phase network,as shown in Fig.5(b).The SEM micrographs also indicate that the initial attack on EZ33 is more pronounced compared to ZE41 (comparing Fig.5(a)with Fig.4(a)).Fig.5(c)and(d)show the surface of EZ33 after 4 days of immersion where the attack on the matrix is now more apparent,however the interior of the grains is generally more intact.The Zr-rich regions are also evident in EZ33 and experience minimal attack,as shown by the red arrows in Fig.5(c).At the end of the immersion period,the immediate surrounding of the intergranular T-phase has experienced anodic dissolution resulting in trenching and falling of precipitates along with separation of the grains (Fig.5 (e and f)).
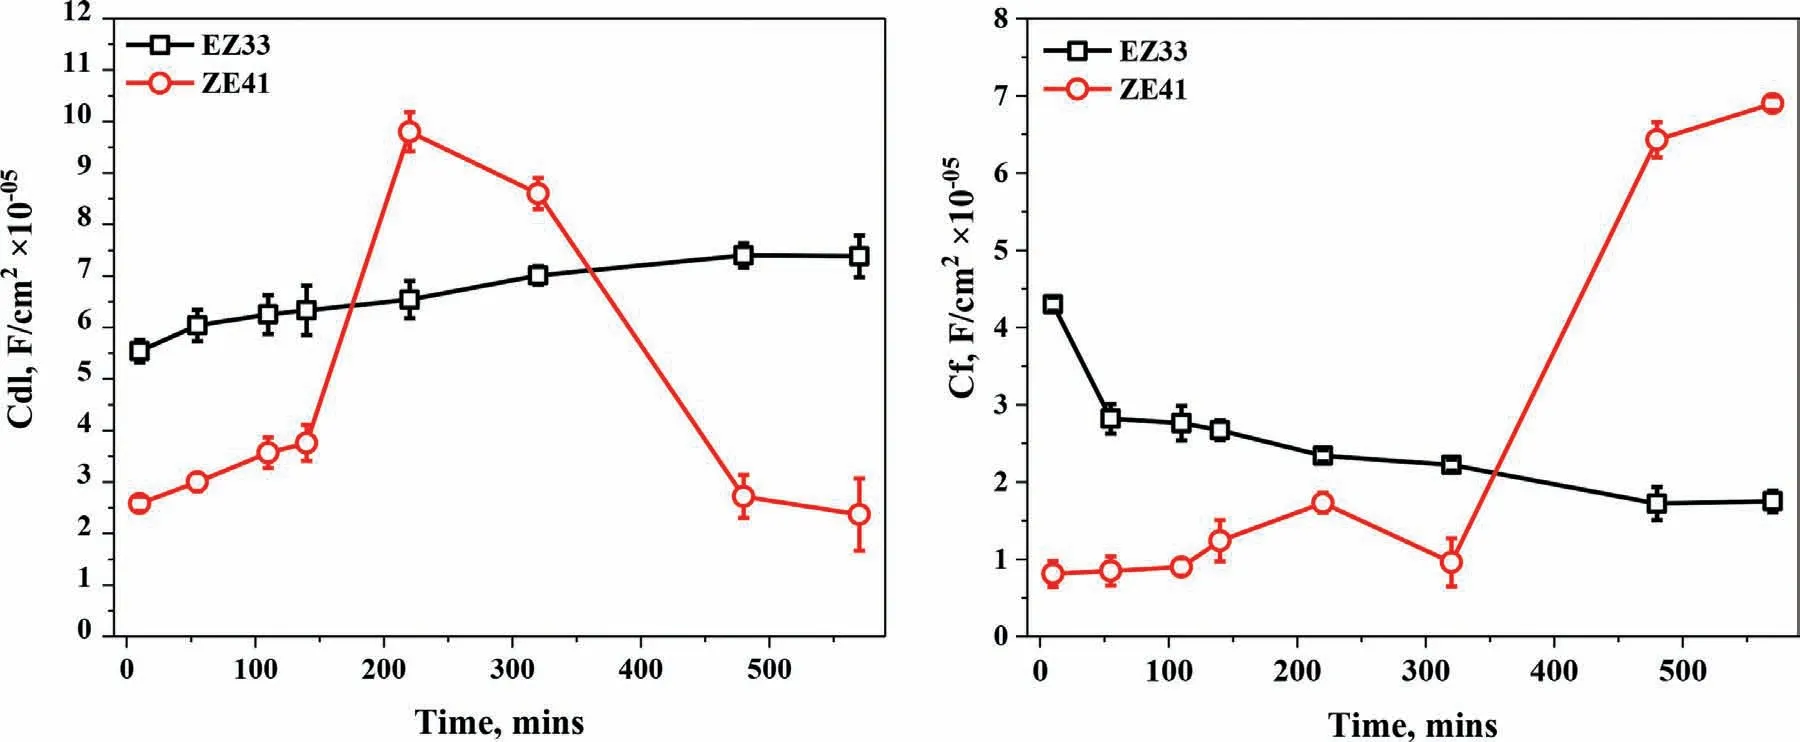
Fig.10.Evolution of (a) Double layer capacitance (Cdl) vs.time and (b) Film capacitance (Cf) vs.time of ZE41 and EZ33 alloys,during 570 mins of immersion in HBSS maintained at 37 ± 1 °C.Here,CPE and C represent the capacitances of the corrosion product layer formed on the surface and the double layer of the metal surface,respectively.
Overall,the degree of surface damage increased as immersion time of both alloys progressed.Localized corrosion had spread intergranularly throughout ZE41 causing large patches of grains to fall off.Similar features were witnessed in EZ33;however,the severity of corrosion was considerably lower and occurred at a later stage to what was witnessed in ZE41.More precisely,after 7 days of immersion,it was observed that the initial layer of grains in EZ33 was still intact (Fig.5(e)and (f)) compared to ZE41 where the firs layer of grains completely disintegrated,revealing a new layer of grains underneath (Fig.4(e) and (f)).Overall,the corrosion in EZ33 appeared more uniform in nature when compared to ZE41.
3.2.3.Electrochemical measurements
Figure 6 presents the evolution of OCP for ZE41 and EZ33 during 570 mins of immersion in HBSS at a temperature of 37 °C.Each measurement point was taken as an average of potentials recorded for a particular immersion time.Throughout the total period of immersion,EZ33 maintained a more positive OCP than ZE41 with a difference in corrosion potential of about 50 mV by the end of the 570 mins.The OCP of EZ33 started at~−1625 mV and reached a value of~−1550 mV,hence a difference of~75 mV was recorded.On the other hand,ZE41 exhibited a large change in OCPs where it started from~−1800 mV and stabilized at~−1630 mV after~330 mins of exposure.The significan difference in the intrinsic OCPs at the onset of immersion indicates different surface reactivity of the two metallic surfaces which agrees with the observations made on the microscopic level after immersion testing in vitro.The OCP of EZ33 showed a rapid rate of increase in the initial hour of exposure but it steadily increased thereafter at a constant rate.Comparatively,the OCP of ZE41 increased more rapidly and continued to rise throughout the exposure period of 300 mins before being stabilized.The trend observed for EZ33 OCP suggests that it is continuing to increase while there is an apparent decrease in the OCP for ZE41.This serves as an indication of how the corrosion resistance of these two alloys may vary as time progresses during immersion.
The EIS data for the two alloys in HBSS at 37 °C are presented as Nyquist and Bode plots in Fig.7 (a-d),while the proposed equivalent circuit model for fittin the EIS data is presented in Fig.7(e).Furthermore,Nyquist and Bode phase angle plots after 10 mins and 570 mins are plotted simultaneously in Fig.8 to present differences between short and extended immersion times.In general,the Nyquist plot of both alloys show two capacitive loops at high and intermediate frequency ranges which are typical of a Mg alloy corrosion [88],and an inductive loop at a low frequency range.The phase angle plots confirme similar behavior where the phase angle approached zero at very high frequencies,while it was approximately −60° at intermediate frequencies and approached positive values at the lower frequency range.In case of ZE41,the EIS spectra displayed larger diameter capacitive loops at higher and intermediate frequency ranges up to 320 mins when compared to EZ33,indicating better corrosion resistance.After 320 mins of immersion,the Nyquist profil of ZE41 showed a significan decrease in diameter for 480 and 570 mins exposure times suggesting a degraded surface layer while the capacitive loop in EZ33 continued to increase proving a more stable surface layer.
The trend in the Bode plots of ZE41 was consistent with the Nyquist profil where decreased phase angles at low(~40 Hz to~40 mHz) and intermediate frequency ranges were observed up to 320 min.However,after 320 min,an increase in phase angle was noticed where the phase angle at~40 Hz,for example,shifted from~−65° (10 min) to~−55° (570 min).Nyquist plots for EZ33,however,demonstrated capacitive loops of progressively increasing diameters throughout the test duration.This was also reflecte in the Bode plots where the phase angle decreased by~5° from 10 min to 570 min exposure time at the lower frequency range(Fig.7(c,d)).However,at intermediate and high frequency ranges i.e.,at~40 Hz and above,the mixed capacitive and resistive behaviors (~−65°) did not show any major change.

Fig.11.Representative tensile stress strain curves of (a) ZE41 and (b) EZ33 at different immersion times (1 day,4 days and 7 days) in HBSS at 37 ± 1 °C compared to as-received material in T5 heat treatment condition (AR-T5).The inset bar graph in (a) and (b) presents the evolution of Vickers microhardness of the alloys after exposure to HBSS for different time intervals.(c) and (d) represent fl xural stress-strain curves from 3-point bend tests of ZE41 and EZ33,respectively.The 3-point bend tests were performed at an initial strain rate of 5 mm/min.
An equivalent electrical circuit was developed in this study to model the EIS data for all immersion durations (Fig.7(e)).While developing the model circuit,the high frequency region was attributed to metal characteristics whereas the low frequency region referred to the properties of corrosion products.Zakiyuddin et al.used an identical approach to explain the corrosion response of Mg-Ca based alloys [89].The proposed circuit was able to model the EIS behavior of both alloys and is comprised of a series combination of constant phase element(CPE)resistor(R1)and capacitor(C)resistor (R2)inductor (L) and inductance resistance (RL),where“”indicates parallel.In this model,CPE and R1account for the double layer capacitance,Cdl (calculated from CPE) and the charge transfer of the metal surface,whereas Cfand R2are the corrosion product layer/fil formed on the surface,respectively.The Cdl was calculated from CPE coefficien Ydland exponent,n,usingCdl=Ydl× (ω'')(1−n) where n(0<n<1) accounts value 1 for pure capacitance and 0 for a pure resistor,andω''is the angular frequency in radian/s at which the imaginary impedance is highest.A capacitor (Cf)was used instead of a CPE as during circuit fitting the coefficien "n" of CPE attained a value of 1,recovering an ideal capacitor behavior justifying the use of capacitors in this case[88].The inductive behavior of the adsorbed/desorbed intermediates or other species on metal surface were modeled using L and RLelements and appeared at the low frequency range.


Fig.12.(a) Comparison of ultimate tensile strengths (UTS) and yield strengths (YS) of ZE41 and EZ33 at 37 ± 1 °C before immersion and after 7 days of immersion.Both the alloys showed similar reduction in YS.The%reduction in UTS for each alloy has also been indicated.(b) Comparison of ultimate fl xural strengths of ZE41 and EZ33 before (AR) and after 1,4 and 7 days of immersion in HBSS at 37 ± 1 °C
Table 2 summarizes the fittin results obtained using Echem AnalystTMsoftware for EIS (Gamry Instrument,Michigan,USA) for both ZE41 and EZ33 during different exposure times in HBSS as per the equivalent circuit shown in Fig.7(e).The fittin of the model circuit was judged by its goodness of fi based on low chi-square values[90,91]and the fitte profile of Nyquist and phase angle plots for 10 and 570 mins are shown in Fig.8.The fitte profile of the equivalent circuits fitte well with the spectra obtained from experimental tests proving the reliable simulation of EIS data.Further the system stationarity was confirme through the direct integration of the Kramers-Kronig (KK) transformations of the real and imaginary components as reported previously [92].As can be seen in Fig.1-S (see supplementary document),KK transform display good correlation and low residual noise indicating that the system can be regarded reasonably stationary [88].In addition,the reliability of impedance data for Mg has also been validated by other studies,despite its high activity and inductive response [93-95].

Fig.13.Relative cell viability of NIH3T3 cells after incubation in Mg alloys(a) ZE41 and (b) EZ33 extracts for 24,48 and 72 hrs.The Mg alloy extracts were extracted after 3 and 8 days and the data were normalized with respect to the negative control.
The overall frequency-dependent impedance response of the circuit model was determined using Eq.(5) [88]:

After circuit simplifications the total resistance,also known as polarization resistance (Rp),was calculated from Eq.(6) and can be define as the difference in the impedance between the low frequency asymptote and the solution resistance [88]:

Hence,as the frequency is approaching zero,capacitive components of a system approach infinit impedance and inductive components approach zero impedance.The Rpvs.time plot shown in Fig.9(a) indicates that ZE41 exhibited higher polarization resistance than EZ33 up to 140 min after that a slight decrease up to 320 min followed by significan drop in the resistance was observed.The Rpvalue of EZ33 showed an initial sharp rise,i.e.from 55 min to 140 min followed by a slower but continuous and steady rise with exposure time.These results corroborate the trends observed in the Nyquist and phase angle plots (Fig.7).
Potentiodynamic polarization (PD) was carried out to evaluate the corrosion behavior of both alloys under polarization condition after 570 min of exposure as shown in Fig.9(b).The icorrwas measured using Tafel extrapolation only with the cathodic branch (βc) because of negative difference effect(NDE)of the anodic branch(βa)in Mg alloys as reported earlier [96].The parameters obtained from PD curves are listed in Table 3.From the PD curves shown in Fig.9(b),it is seen that the profil of both alloys is similar in shape where the corrosion potential,Ecorr,of the alloys(EZ33~−1510 mV and ZE41~−1600 mV) moved slightly towards a positive direction from OCP values.However,the higher current density shown by ZE41 reflect the higher corrosion rate.Furthermore,the higher cathodic slope associated with ZE41 also imply that the cathodic reaction kinetics is related to the microstructural characteristics [97].The pitting potential values of EZ33 and ZE41,~−1356 mV and~−1531 mV respectively,are nobler than OCP in both cases.However,the difference between OCP values and pitting potentials of EZ33 is more than the difference observed in ZE41 indicating comparatively high pitting susceptibility in EZ33.This agrees with the surface morphology of EZ33 shown in Fig.5(a) where intergranular corrosion was seen after 1 day of immersion while not visible in ZE41.Though,after 7 days of immersion,ZE41 showed aggravated localized corrosion in which a complete layer of grains disintegrated,compared to the relatively uniform corroded surface of EZ33 which suggests the formation of a more stable surface fil as was evident in EIS plots (Fig.7).Furthermore,the corrosion current density of ZE41 was higher than EZ33 whereas the corrosion potential of EZ33 was nobler than ZE41.Table 3 summarizes the corrosion rates obtained by hydrogen evolution and weight loss measurements and EIS.Both immersion tests showed similar corrosion rates at the end of 7 days for both alloys where ZE41 values about 3 times more than EZ33.Corrosion rates calculated through EIS showed the same trend but with lower rates for both alloys since it was carried out for 9.5 h only to maintain a pH below 10.4 as explained earlier.
To understand the nature of the surface fil and double layer on the two alloy surfaces,capacitive values were also calculated from the equivalent circuit model (Table 2) and plotted vs.exposure time where Fig.10 shows the evolution of the double layer capacitance,Cdland capacitance of the corrosion layer,Cf.Except for 220 and 320 mins,Cdlvalues for EZ33 alloys increased steadily and becomes almost constant with minor fluctuation up to 570 min.However,a sharp rise was observed for ZE41 for 220 and 320 mins followed by a decline in capacitive values up to 570 min of immersion.Similarly,Cfwhich describes the properties of the surface fil developing on the alloy,exhibited lower values up to 320 min for ZE41 followed by a sharp rise for 480 and 570 min.While Cfof EZ33 sharply decreased initially,became stable with minor fluctuations and continued to stablize until 570 min.For an ideal capacitor,the fil thickness(δ) estimated from the effective dielectric fil capacitance(Table 2) can be calculated using the following equation [98]:

Table 3 Corrosion rates evaluated by hydrogen evolution,mass loss and electrochemical parameters obtained from PD in HBSS at 37 ± 1 °C.Corrosion rate by hydrogen evolution and weight loss were calculated after 7 days of immersion PD parameters obtained while EIS computed after 9.5 h.
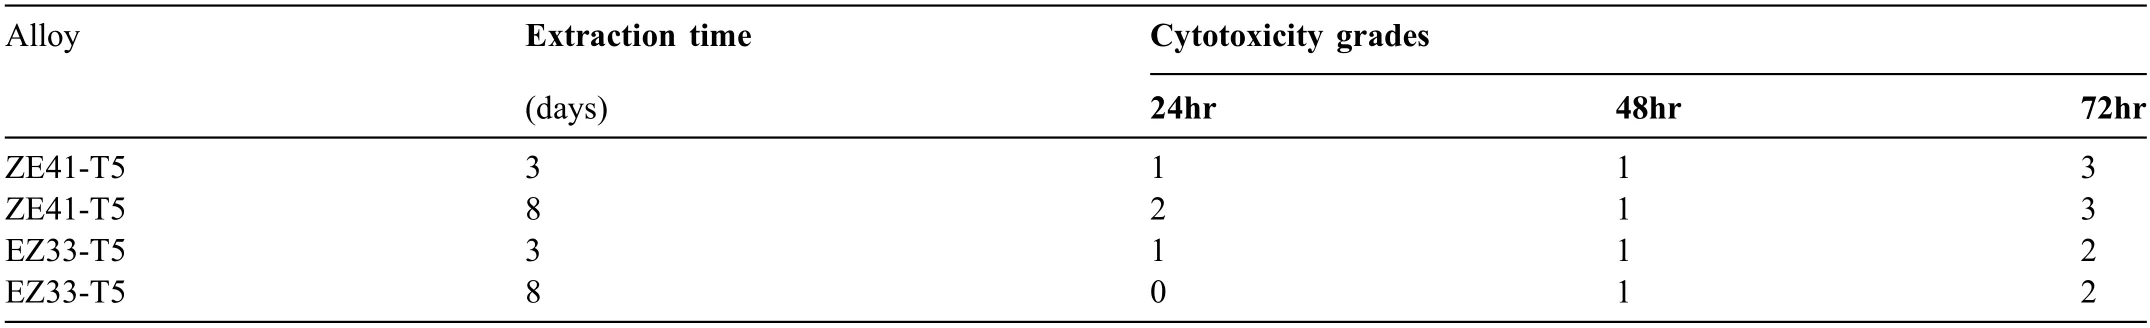
Table 4 Cytotoxicity grades∗for the two alloys.The NIH3T3 cells were incubated with ZE41 and EZ33 extracts for 24,48 and 72 hrs.The extracts were obtained using 10% FBS supplemented DMEM extraction media and an initial metal to medium concertation of 1000 μg/ml,while the extraction time was 3-and 8-days.

whereεis the relative dielectric constant of the MgO passive fil and is taken to be 9.8,εois the permittivity of free space(8.854 × 10⁻¹⁴F·cm−1),and A (cm2) is the surface area of the sample.Based on the capacitance values determined from the equivalent circuit,the fil thickness of ZE41 is greater than that of the EZ33 up to 320 min which is also supported by the R2values.
3.3.Mechanical behavior
The mechanical properties of as-received ZE41 and EZ33 in T5 condition were obtained at 37 ± 1 °C by uniaxial tension test and the stress-strain curves are shown in Fig.11(a)and (b),respectively.Among the two alloys,ZE41 presented higher yield and ultimate strengths in uniaxial tension test[74].ZE41 also had double the tensile elongation compared to EZ33.These results are largely consistent with ASM handbook mechanical property values of both alloys in T5 condition obtained at ambient temperature [99].The influenc of biodegradation on the mechanical strengths of both alloys was investigated through tension,three-point bend tests and microhardness measurements on specimens immersed for different durations in HBSS at 37 ± 1 °C.The tensile stressstrain curves of the studied two alloys for different immersion times along with that of as-received material in T5 (ART5) condition are shown in Fig.11(a) and (b),respectively.Both immersed alloys show decreased strength and somewhat increased ductility compared to the as-received T5 samples.The variation of microhardness for the alloys with respect to immersion time are also presented as bar graphs in Fig.11(a) and (b).Fig.11(c) and (d) show the fl xural stress-displacement curves of both alloys for different immersion times.The changes in tensile (yield and ultimate tensile) strengths for the alloys are presented in Fig.12(a).Figure 12(b) summarizes the loss in fl xural strengths of both alloys in their as-received T5 condition and after different immersion times.
With increase in immersion time,strength of the alloys decreased,with ZE41 alloy showing higher decrease in strength compared to EZ33 alloy.ZE41 experienced a 16% reduction in yield strength and about 14% reduction in ultimate tensile strength.A similar reduction in yield strength of 17% was seen in EZ33 but the ultimate tensile strength was reduced by 8% and this drop in strength is significantl less than the reduction seen in ZE41.Under fl xural testing,ZE41 suffered a 7% decrease in fl xural strength after 24 h of immersion and about 14% after 4 days.In contrast,EZ33 maintained its fl xural strength through the firs 24 h and lost only 8% at the end of the fourth day of immersion.By the end of the seventh day of immersion,ZE41 sustained a total of 18%loss of fl xural strength in comparison with 13% experienced by EZ33.A decrease in microhardness after 1 day of immersion was observed in both alloys,however after 7 days of immersion,increase in microhardness was observed.Overall,after 7 days,a total of 9% loss in microhardness for EZ33 was observed compared to a 17% loss for ZE41 (Fig.11(a) and(b)).
As mentioned previously,strength calculations were performed using original cross-sectional area of the specimens and not the decreased actual cross-sectional area of corroded sample.In literature,studies have utilized similar approach to calculate materials strength post immersion.Song et al.also used engineering stress-strain curves to evaluate the mechanical integrity of a Mg-2Zn-Mn-Ca-Ce alloy after subjecting it to a combined processing route of ECAP and water-annealing[30].Hou et al.studied the biodegradability and mechanical integrity of rolled and annealed ZX11 Mg alloy,by calculating the tensile and yield strengths after different immersion times using the actual post-immersion cross-sectional area[75].These“calculated strengths”were then compared to the“measured strengths”,obtained using the original crosssectional area.Hou et al.showed that for immersion times below 7 days,both values agreed,and discrepancies were observed at longer immersion times.It was also reported that,at longer immersion times,the strength values using the original area where much lower than the values obtained from calculations performed with the degraded area.Therefore,using the original cross-sectional area post exposure to a corrosive environment is a conservative approach in studying the mechanical integrity of a degraded material with localized corrosion damage,surface cracks and other inhomogeneities.
3.4.Cytotoxicity
Figure 13 shows the relative viability of NIH3T3 cells incubated in the alloy extracts after 24,48 and 72 hrs.
The four extracts reduced the viability of NIH3T3 cells to 46.4 -51.2%.Overall,higher cell viability was observed when culturing with the EZ33 extracts than the ZE41 extractsbut the two alloy extracts largely behaved in a similar manner and demonstrated cytotoxicity.In all cases,the cell viability reduced with increase in incubation time except in the EZ33 8-day extracted case,where the cell viability firs increased after 24 hrs and subsequently decreased after 48 and 72 hrs in a consistent manner.In the present study,3-and 8-days extraction durations were chosen to understand the influenc of extraction time on cytotoxicity and possibly correlate the analysis with immersion test findings However,no significan cell viability differences were observed among the extracts extracted after 3-or 8-days for both alloys,especially after incubation for more than 24 hrs.Reports in the literature on in vitro studies have shown that increasing the surface/volume ratio and incubation time prior to extracting increases the concentration of alloy ions in the supernatant flui and hence increases the sensitivity of the test [100,101].However,in this study,it was concluded that given the corrosion kinetics of the two alloys,large ratio between alloy surface and the extraction medium volume,the alloy ions concentrations were likely maximized at 3-days extraction and therefore no discernable differences were seen the cell viability with the 8-days extraction cases.
Although the four extracts were obtained in a different manner (powdered alloy,3-or 8-day incubation period),than what is prescribed in the ISO 10,993-5 standard,cytotoxicity grades were assigned using the 5-point grading system proposed in ISO 10,993-5 standard,to evaluate whether the studied alloys meet the requirement for cell toxicity [76].The grades are from 0 to 4 and are evaluated as follows:i) cytotoxicity grade 0 or 1 indicates the material is eligible for use,ii) cytotoxicity grade 2 indicates that further evaluation of the material is needed through morphological analysis,and iii) cytotoxicity grades 3 and 4 indicate that the material is not eligible for use [102].Grades were assigned to the following percentages of cell viabilities:i) grade 0 -100%,ii)grade 1 -between 80% and 100%,iii) grade 2 -between 50% and 80%,iv) grade 3 -between 30% and 50%,and v) grade 4 -less than 30%.Table 4 presents the grades assigned to the two alloys based on the cytotoxicity results of cells seeded with 10% FBS supplemented DMEM media and exposed to extracts for 24,48 and 72 h.The assigned grades demonstrate that the in vitro cytotoxicity of EZ33 was found to be between Grade 0 and 2,indicating that it is a relatively less cytotoxic for the NIH3T3 cells while ZE41 cytotoxicity with both 3-and 8-day extractions were found to be between Grade 2 and 3.
4.Discussion
4.1.Influenc of alloying additions on corrosion behavior
The corrosion behavior of multi-phase Mg alloys can be linked to the microstructure by investigating three main characteristics:a) the composition ofα-Mg matrix,b) the composition of secondary phases,and c) the morphology,amount and distribution of the secondary phases [1,34,89,103-108].In particular,the secondary phases in Mg alloys are nobler than the matrix and tend to have a dual effect on corrosion where they enhance corrosion resistance by enriching the protective fil or cause a coupled micro-galvanic effect with the matrix,and hence accelerate corrosion in different environments [1,34,58,105,109,110].In T5 condition,the matrix of both alloys was Mg-rich,contained Zr-rich particles located in the grain interior and T-phase precipitates located at the grain boundaries.As expected,the RE rich T-phase enveloped the grain boundaries due to the limited solubility of the Ce,La and Nd in Mg (0.23 wt.% for Ce,0.74 wt.% for La and 3.6 wt.% for Nd) [111].Among the two alloys,as EZ33 had about three times the total wt.% of REs than ZE41 (Table 1),its microstructure contained relatively higher volume fraction and a more continuous distribution of T-phase along the grain boundaries.
In the present study,the corrosion behavior of both alloys revealed that there are two micro-cathodes that are present:(i) a presumably eutectic T-phase concentrated at the grain boundaries,and (ii) Zr-rich intermetallic particles located inside the grains.Coy et al.,deduced that these cathodic microconstituents,namely T-phase and Zr-rich precipitates,had a relative volta potential difference of +100 mV and +180 mV,respectively,with theα-Mg matrix[112].This resulted in formation of microgalvanic couple between the precipitate andα-Mg-matrix.It was also deduced that higher concentration of Zr and Zn in the precipitates made them more nobler thanα-Mg matrix and enhanced their cathodic activities [112].Surface morphologies of ZE41 alloy shown in Fig.4 uncovered analogous corrosion behavior in agreement with Coy et al.[112] and Neil et al.[77] confirmin that the Zr-rich precipitates did indeed influenc the alloy corrosion response,by enhancing the attack within the grains.
However,contrary to the finding of Birbilis et al.[113],the increased volume fraction of REs in EZ33 did not have a negative impact on the corrosion resistance of the alloy but enhanced it.EZ33 presented lower cathodic kinetics and a more positive corrosion potential than ZE41 except at a potential close to (~−260 mV) where the limiting current density was lower.Furthermore,EIS results revealed that the fil formed on the surface of EZ33 was stabilizing and provided more protection with increased exposure time while the fil developed on ZE41 deteriorated over time (Fig.7).Fig.9 and Fig.10 showed the evolution of polarization resistance,surface capacitance and double layer capacitance.There was a clear trend in both R1and R2,where the charge transfer resistance (R1) and fil resistance (R2) were improved with immersion time.Film capacitance (Cf) for both alloys showed slight changes until 320 mins,followed by a sharp rise for ZE41 for 480 and 570 mins where the behavior for each alloy starts to differ.Cdlfor ZE41 showed a sharp rise for 220 min and 320 min followed by a sharp decline.The higher fil capacitance values in EZ33 compared to ZE41 up to 480 mins may be attributed to the availability of more surface area for corrosion reactions to occur due to the larger volume fraction of secondary phases evident in EZ33.Also the continuous slight decline observed in the double layer capacitance of EZ33 is an indication of comparatively lower exposure of the metal/hydroxide interface to the electrolyte[114].On the other hand,for ZE41,the Cfvalues comparatively showed lower values and sudden rise for 480 and 570 mins indicates larger exposed metallic surface to corrosive solution and therefore an indication that surface fil is breaking down.This phenomenon is also shown by very high values of Cdlat 220 and 320 min,indicating that more corrosive ions and water molecules are adsorbed at the solution/surface interface,resulting in surface fil destruction.Consequently,based on the response of both alloys,the larger volume fraction of REs distributed in a more continuous manner in EZ33 can be attributed to the increase in corrosion resistance due to decrease in anodic reaction kinetics thereby counteracting the increase in cathodic reaction kinetics.
The observed corrosion responses of ZE41 and EZ33 in immersion tests were also in agreement with the corrosion behavior explained above that was concluded from the fit ting parameters of the circuit model (Table 2).The hydrogen evolution corrosion rate over a period of 7 days indicated a significan difference between the two alloys over extended periods of immersion (see Fig.3).In ZE41,hydrogen evolution was divided into three stages:an incubation period where the corrosion rate was at its lowest,followed by an increase in hydrogen evolution then a decrease after 24 hrs until it reached steady state.The slow increase in hydrogen evolution after the incubation period confirme that a partially protective surface fil was formed,while the subsequent increase in corrosion rate can be attributed to the breakdown of the fil and the initiation of localized corrosion.A similar response was observed in the OCP of ZE41 (Fig.3(b)) where the initial OCP increased steadily and continuously for the firs few hours,an indication of the incubation period,before starting to decline as immersion time increased owing to the breakdown of the initial surface film The comparison between OCP and hydrogen evolution is more evident during the firs 10 h of immersion.For ZE41,the lower OCP value indicates that the fil formation process is slow due to low activity of the surface which causes a partially protective thinner fil to form in the beginning.At this stage,the rate of fil formation is lower than the rate of fil dissolution hence dynamic balance is not established.With increased immersion time,the OCP seems to stabilize indicating the dynamic equilibrium is reached.There was also a slight decrease in OCP observed after 480 min indicating that saturation of the surface fil with aggressive ions has occurred.Similar behavior can be observed in the hydrogen evolution plot (Fig.3) where a slight rise at the start of immersion was observed followed by relatively stable profile The sudden rise in the hydrogen evolution rate after 8 h,proves that the fil has broken down and cathodic sites are exposed for the reaction.This corrosion behavior was consistent with the conclusions found through EIS measurements and similar observations reported for ZE41 by other studies [41,106,115,116].
In comparison,the corrosion behavior of EZ33 was significantl different where there was no incubation period but instead a sudden increase in the evolved hydrogen,followed by a slow decrease until finall reaching steady state.The shortened incubation period was due to the faster initiation of corrosion in EZ33 than ZE41 and that was also shown in its OCP (Fig.3(b)) where the period of increase in potential was relatively short and the hydrogen evolution rate was at its maximum (Fig.3).This behavior indicates that a partially protective and thicker fil was formed quickly compared to ZE41,due to higher surface activity because of the increased number of nucleation sites.The quick formation of fil was due to the high rate of oxidation/reduction reactions occur on the surface.Once the fil reached sufficien thickness which can provide covering of reactions sites,the rate of fil dissolution and formation slow down,and a dynamic equilibrium is reached between these reactions.This behavior can be confirme from the hydrogen evolution up to firs 10 h of immersion.The potential continued to show a slow and steady increase which was translated to the slow decrease in hydrogen evolution,also verifying the development of a protective corrosion surface fil [89].The steadfast hydrogen evolution rate and OCP in addition to the trends in polarization resistance and capacitances confirme that EZ33 was able to develop a more stable surface film
Further examination of post-immersion surface morphologies at different time points confirme the enhanced corrosion resistance of EZ33 as was observed through immersion and electrochemical results (Fig.4 and Fig.5).For short immersion times,EZ33 showed higher corrosion rates and a less stable surface film This was represented by the initiation of intergranular corrosion in EZ33 (Fig.5(a)) which was not observed in ZE41 (Fig.4(a)).As immersion progressed,deep pits due to the detachment of clusters of grains resulted in further exposure of the metal surface in ZE41 to the electrolyte,as indicated in the EIS tests,causing an increase in hydrogen evolution,and hence the breakdown of the surface film While in EZ33,the larger network of REs was able to protect the grains and delayed their detachment which was observed by the seventh day of immersion while it was observed in ZE41 by the fourth day.As a result,it was concluded that EZ33 developed a more protective surface layer that was maintained throughout the testing period of 7 days in contrast to ZE41,where the fil started to break down within a few hours.
4.2.Role of microstructural features
To capture the effect of different microstructural constituents on the corrosion response of the two Mg alloys,insitu corrosion test also known as drop tests were performed.This test is aimed at capturing the effect of microstructural constituents on the alloy’s corrosion response real time and at an accelerated speed,since the chloride-containing corrosion medium is refreshed at regular time intervals.The sequence of images starting from exposure of alloy to chloride-containing corrosion medium leading to corrosion front propagation,resulting in hydrogen gas formation are shown in Fig.14(a)and(b) for ZE41-T5 and EZ33-T5 alloys,respectively.From the images it could be observed that ZE41 alloy showed faster initial corrosion response with dissolution ofα-Mg around the T-phase precipitates (Fig.14(a)).In the case of EZ33 alloy,corrosion started at a later time compared to ZE41,but once the corrosion started it continued for a longer period of time and was more widespread (up to 94 mins in Fig.14(b)).After this,a stable surface fil has formed on EZ33 and corrosion was occurring at relatively slower steady pace,with hydrogen evolution seen even during end of test at 420 mins.In the case of ZE41 alloy,although a passive layer formed and corrosion slowed as seen at 150 mins,hydrogen evolution could be observed at 300 mins,indicating the unstable nature of the passive layer.This was further accelerated since both the Tphase and Zr-rich particles acted as cathodes [112],resulting in anodic dissolution ofα-Mg around them.This is shown in Fig.14(b) by the red solid (hydrogen evolution around Tphase precipitate) and red dashed (hydrogen evolution around Zr-rich precipitate) arrows at 420 mins.This explains the response observed for both alloys in the open circuit potential as shown in Fig.3(b).Anodic dissolution ofα-Mg around both T-phase precipitate and Zr-rich particle in ZE41 alloy,results in falling of some grains and exposure of new grains beneath the surface,as seen in Fig.4(e) and (f).
Based on observed results from the drop tests,a schematic for the corrosion sequence of ZE41 and EZ33 alloys in T5 condition is proposed and is shown in Fig.15(a) and (b),respectively.In the case of ZE41 alloy,initially the T-phase precipitate followed by Zr-rich precipitate act as cathodes leading to the unstable passive layer formation.In the case of EZ33 alloy,the Zr-rich region in the middle of the grains did not influenc the alloy corrosion response and hence a more stable passive fil was formed.This could be attributed to the difference in size and distribution of Zr-rich phase in the two Mg alloys.To observe the distribution of Zr-rich phase on both alloys,EDS maps for elemental (Mg,Zn and Zr) distribution were obtained and the results are shown in Fig.16.The elemental maps show that ZE41 alloy shows a more concentrated Zr-rich phase while EZ33 showed a more diffuse distribution of Zr.The less concentrated Zr-rich phase in EZ33 alloy resulted in less effective micro-galvanic coupling leading to more uniform corrosion.EDS maps of the alloys post drop test shows falling of T-phase precipitates followed by dissolution ofα-Mg around the Zr-rich precipitates in ZE41 alloy as shown in Fig.17(a).In comparison,the EZ33 alloy shows falling of T-phase precipitates and Zr-rich phase is more widespread and does not influenc the alloy overall corrosion response,as shown in Fig.17(b).
In addition to the influenc of T-phase and Zr-rich precipitates on the alloy corrosion response,the distribution of the precipitates also plays a role.Although both ZE41 and EZ33 Mg-RE alloys show microgalvanic coupling between the secondary precipitates andα-Mg matrix,EZ33 shows a relatively more uniform corrosion compared to ZE41.This is a result of the combination of the additional effect of the Zr-rich precipitates acting a micro cathodic site in ZE41 alloy along with distribution of secondary T-phase precipitates along grain boundaries.As explained earlier,the secondary precipitates can either act as galvanic couple (lower concentration and broken distribution) or anodic inhibitor (higher concentration and continuous distribution),depending on its distribution [117,118].In the present study,EZ33 alloy shows more uniform network of secondary T-phase precipitates (Fig.1)compared to ZE41 and could possibly act as anodic inhibitor,in combination with Zr-rich precipitates not influencin the alloy corrosion response,resulting in higher corrosion resistance and relatively uniform corrosion.
4.3.Mechanical integrity
Temporary orthopedic implants are required to maintain sufficien mechanical strength and avoid sudden failure,despite continuous biodegradation,until the bone healing process has completed.The main concerns when considering materials for such load-bearing temporary implants are rapid loss of strength and premature failure of the implant.The prevalent corrosion mechanism ultimately dictates if a material will fail prematurely in-service.For example,localized corrosion such as pitting has been reported to act as initiation sites for stress-corrosion cracking thereby resulting in premature catastrophic failures [117,119,120].For this reason,in addition to understanding the general corrosion resistance,evaluating mechanical integrity of the alloys is important to understand how corrosion mechanism impact their performance.

Fig.14.Sequence of optical microscope images showing real time monitored drop test on (a) ZE41-T5 and (b) EZ33-T5 alloys for a period of 420 min.The numbers on the images indicate time in minutes.The green arrows indicate T-phase precipitate,yellow arrows indicate Zr-rich precipitate,broken green arrow indicate fallen T-phase precipitate,red arrow indicates hydrogen gas evolution from T-phase precipitate and broken red arrow indicates hydrogen gas evolution from Zr-rich precipitate.
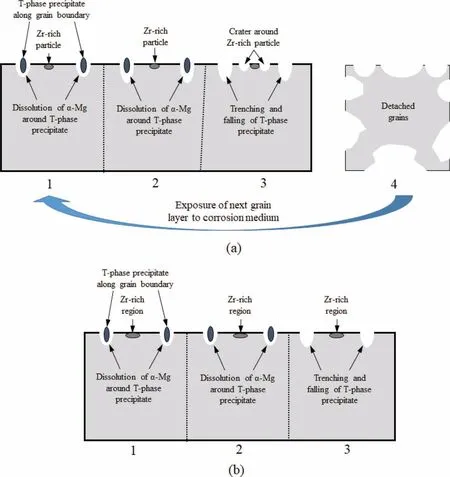
Fig.15.Schematic diagram showing corrosion sequence in (a) ZE41 and (b) EZ33 Mg alloys in T5 condition.
In the present study,microhardness,tensile,and three-point bend testing were utilized to study the changes in mechanical properties of both alloys after pre-immersion.As a measure of mechanical integrity,percent loss in tensile and fl xural strengths compared to as-received T5 counterparts were considered.As expected in the as-received T5 temper,ZE41 exhibited superior mechanical properties than EZ33 at 37 °C and predictably both alloys suffered some loss in tensile and bending strengths.The percent loss in tensile strengths was comparable to the fl xural strength in both alloys.Among the two alloys,the drop in important mechanical properties in EZ33 was less pronounced than ZE41 in both uniaxial tensile and bend tests.It was found that 7 days post immersion (the longest duration considered in this study),EZ33 was able to retain about 92% and 87% of its tensile and fl xural strengths,respectively while ZE41 retained about 86%of its tensile and 82% of its fl xural strengths.Mechanical integrity of Mg alloys evaluated under slow strain rate tensile testing (SSRT) has shown drop in mechanical strength under exposure to chloride containing medium.ZE41 Mg alloy evaluated under SSRT at strain rates of 10−6and 10−7s−1,in 0.5 wt.% NaCl medium retained 80.9% and 66.1%strength,respectively,in comparison to same material tested in air [60].The difference in corrosion behavior,as explained earlier,translated into the distinct post exposure mechanical performance of the two alloys.The corrosion rate of ZE41 was substantially higher than EZ33 consequently the severity of the corrosion damage experienced by ZE41 was greater than EZ33,which explains its inferior ability to maintain mechanical integrity i.e.,percent loss of mechanical strength post exposure.

Fig.16.EDS maps showing variation of elemental compositions,Mg,Zn and Zr for (a) ZE41 and (b) EZ33,both in as-received T5 condition.The maps show variation in distribution of Zr-rich precipitate/region between the alloys.
The increase in ductility observed on immersed specimens under tensile testing,can be attributed to the anodic dissolution around the T-phase precipitates followed by trenching and eventual falling of the brittle precipitates (Fig.4 and Fig.5).The T-phase precipitates in ZE41 and EZ33 alloys in T5 condition showed microhardness of 94.5 ± 12.9 HV and 96±15.4 HV,respectively which are significantl higher than the respective alloys (Fig.11(a) and b)).Studies on Mg alloys with brittle secondary precipitates have shown that under tensile loading,fracture initiates around the brittle secondary phases [121,122].Since the T-phase precipitates around theα-Mg matrix falls,the alloy hardness and strength go down while the ductility increases.With further exposure to the corrosion medium,the ductility and strength of the ZE41 alloy decreases owing to loss of grains due to combined action of T-phase and Zr-rich precipitates (Fig.15(a)).EZ33 alloy on the other hand showed similar ductility and strength for 4 and 7 days since the Zr-rich region in middle of grains did not influenc the alloy corrosion response(Fig.15(b)).

Fig.17.EDS maps showing variation of elemental compositions,Mg,Zn and Zr for (a) ZE41 and (b) EZ33,both post-drop test of the as-received T5 condition test specimens.
Localized corrosion occurring intergranularly was observed(marked by arrows) in ZE41 and though the corroded EZ33 samples suffered some loss of material as well,the surface appeared to be relatively evenly corroded,as seen in Fig.18.Macroscopic surface images of the bend test specimens prior to testing are presented in Fig.18.Features of corrosion damage observed here were consistent with those seen at the microscopic level in Fig.4 and Fig.5.After 1 day of immersion,minor surface changes representative of uniform corrosion was observed for both alloys,with ZE41 showing a slightly rougher surface.At 4 days,substantial localized corrosion was evident on ZE41 with areas where the material had started to degrade specificall,in the material bulk where cavities,due to the disintegration of grains,seem to line up as well as near the sample edges or free surface (indicated by the red arrows).Comparatively after four days of immersion,some minimal degree of intergranular corrosion in the bulk with an unremarkable free surface was observed in EZ33.This was again consistent with what was noted in the SEM images where larger areas of detached grains were identifie in ZE41 compared to EZ33,comparing Fig.4 with Fig.5.After 7 days,the severity of the localized corrosion in ZE41 increased with the presence of deeper pits,coverage of the entire surface,as well as some loss in the overall dimensions of the sample.The EZ33 sample also showed overall loss of material but the corrosion pits were comparatively shallower and more dispersed.In fact,the morphology and degree of damage on EZ33 bending test specimen,after 7 days of immersion prior to the test,was very similar to what was observed for the ZE41 sample after 4 days of immersion.This confirm the reason behind the more substantial and rapid loss in mechanical strength witnessed in the ZE41 than the EZ33 was pitting,rather than just loss of material due to corrosion.
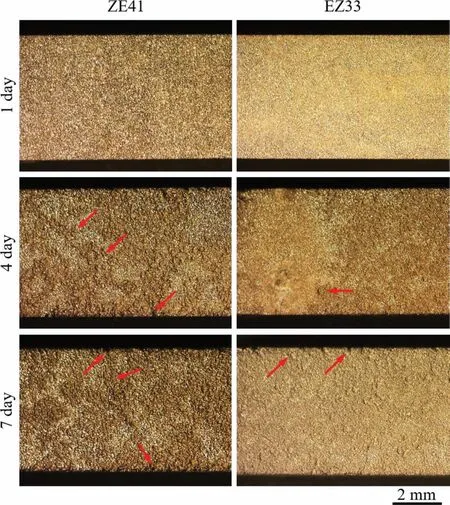
Fig.18.Macroscopic surface images of immersed samples of ZE41 (left) and EZ33 (right) prior to bending tests.The samples were immersed for different durations in HBSS at 37 ± 1 °C.The red arrows indicate localized corrosion observed near the surface of the samples.Note the corrosion products were removed before optical microscopy.
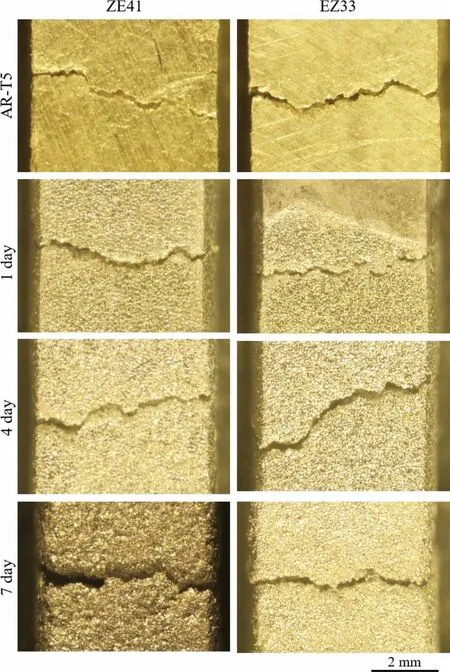
Fig.19.Macroscopic surface images of broken tensile tested samples,ZE41 (left) and EZ33 (right),immersed for different durations in HBSS at 37 ± 1 °C.
The macroscopic images of immersed ZE41 and EZ33 tensile tested specimens are shown in Fig.19.The as-received-T5 specimens showed signs of ductility while the immersed specimen showed localized corrosion leading to brittle fracture.The ZE41 specimens showed higher localized corrosion on the specimen surface compared to EZ33.The fracture surface of tensile tested ZE41 and EZ33 in as received-T5 and 7-day immersed specimen are shown in Fig.20(a) and (b),respectively.Both ZE41 and EZ33 alloys in as-received-T5 conditions showed predominant intergranular fracture,while 7 day exposed specimen showed mixture of intergranular (IGC)and transgranular (TGC) cracking,indicating possible hydrogen embrittlement of the alloys.Radhika et al.,performed stress-corrosion cracking test on ZE41 alloy under simulated body flui corrosion medium and observed a mixture of IGC and TGC on the fracture surface [123].The study observed anodic dissolution around the T-phase precipitates and pitting occurred within the grains due to the Zr-rich precipitate acting as micro cathode to the anodicα-Mg matrix.In addition,hydrogen embrittlement of the alloy could also contribute to the observed TGC in the fracture surface,resulting in loss of ductility [123].Analysis of surface hydroxide layer on Mg ZE10 alloy has shown presence of Zr-rich particles on the fil that aided inward penetration of hydrogen towards the underlying metal [124].Kannan et al.also reported transgranular brittle fracture in ZE41 alloy tested for stress corrosion cracking under NaCl solution [60].In the current study,the two alloys are subjected to tensile testing immediately post immersion in corrosion medium unlike stress corrosion crack studies [60,125].Exposure of the alloys to corrosion medium prior to testing could result in hydrogen embrittlement that could also act as a factor for observed brittle fracture.ZE41 alloy showed higher area of transgranular cracks and could be attributed to Zr-rich precipitates,since it influence the alloy corrosion response by acting as micro cathodes,leading to corrosion within grains and could have possibly led to hydrogen embrittlement as well,which would require further analysis.

Fig.20.(a) SEM images of ZE41 as-received T5 and 7 day exposed tensile tested specimen fracture surface.As received-T5 specimen shows predominant intergranular fracture,while 7 day exposed specimen showed mixture of intergranular (solid arrow) and transgranular (broken arrow) cracking.(b) SEM images of EZ33 as-received T5 and 7 day exposed tensile tested specimen fracture surface.As-received T5 specimen shows predominant intergranular fracture,while 7 day exposed specimen showed mixture of intergranular (solid arrow) and transgranular (broken arrow) cracking.Higher magnificatio of the surface is shown from left to right.
4.4.Biocompatibility
Commercial RE containing magnesium alloys are mainly designed for structural applications with the aim to improve the mechanical and corrosion properties and RE additions are added as undefine mixtures or in some cases as unseparated elements,in the form of mischmetal.While some studies have revealed that different REs when tested individually may be toxic,for example La and Ce are known to be hepatoxic by inducing fatty liver,jaundice and accumulation in liver,heart and lung [45,69].It remains an open question whether RE additions when contained within Mg alloys are safe for biodegradable applications.The answer likely lies beyond the innate toxicity of RE elements and whether the amount of RE element or mixture containing species released during degradation into the host remains within its cytotoxic threshold limit [4].For example,Feyerabend et al.studied the cytotoxicity of eight different RE elements on human cell lines by creating seeding mediums using RE chlorides.Among the studied REs,fi e,including Eu,Pr,Nd,Ce and La (the later three being relevant to this study) showed high toxicity except Eu.Ce and La were found to be highly toxic with the largest influenc on cell viability followed by Pr and Nd.Incidentally,all of these fi e RE elements have low solubility in Mg.Feyerabend et al.hypothesized that REs with lowest solubilities in Mg will likely release ions in a restricted manner during degradation since their concentration (solid solution and/or secondary phases) is limited in the alloy [45].
As explained earlier,the main REs in ZE41 and EZ33 are Ce,La and Nd.All three REs were deemed toxic by the study by Feyerabend et al.[45],however they are also known to have limited solubility in Mg,0.23 wt.% for Ce,0.74 wt.%for La and 3.6 wt.% for Nd [111].Present results,although obtained using alloy extracts instead of chlorides,have explored the hypothesis outlined by Feyerabend et al.It was found that in the cells exposed to EZ33 extracts,percent viability was higher compared to ZE41 counterparts for both 3-and 8-day extractions.Assuming 8-day extracts were more concentrated in dose,the cell viability trends remain the same.Moreover,the extracted test mediums used in this study,were undiluted and prepared by using powdered samples with significantl higher surface area to medium ratio to ensure high dosage in extracts.This confirm that despite increased RE alloying concentration in ZEZ33 (1.5 times REs while keeping the other components i.e.,Zn and Zr comparable),cell survival was superior compared to ZE41.Hence,RE concentration and in vitro corrosion rate of an alloy both influenc the released amount and flu of species and keep them within cytotoxicity thresholds.All these reasons suggest,EZ33 due to higher concentration of REs and enhanced corrosion resistance yields lower corrosion rates in vivo and therefore a more viable candidate with superior cytocompatibility as a biodegradable material.
A more relevant study performed by Willbold et al.looked at the in vitro and in vivo biocompatibility of binary Mg-1.27Ce,Mg-0.69La and Mg-2.13Nd alloys [111].The study’s in vitro results showed that all three binary alloys were cytotoxic using 100% concentrated test medium,but with 50%and 10%dilution,the cell viabilities of the alloys increased to>70%.It is important to note that the percent weight fraction of REs used in these binary alloys were significantl higher than the corresponding individual REs present in both ZE41 and EZ33.Hence the in vitro cytotoxicity results of Willbold et al.with diluted extracted mediums are more relevant for comparison.Hence,as ZE41 and EZ33 degrade in culture media prior to extraction,their extracts are expected to be less toxic than those developed by Willbold et al.Moreover,ZE41 and EZ33 both have Zn and Zr which are two biocompatible elements that are known to be nontoxic to the human body within their specifi limits,and are not discussed here[42].To extend the possibility of using these alloys for developing biodegradable components and fixture to support bone healing,an in vivo study is currently ongoing based on EZ33 alloy and the initial results are promising.It is also important to note that in vivo experiments conducted by Willbold et al.,on rabbits,confirme that for all three binary Mg-RE alloys histological finding did not reveal local cytotoxicity [111].
In summary,the analysis shows that beyond the innate elemental toxicity of REs,the cytotoxicity threshold levels of each RE element in a Mg alloy is a function of its solubility as it impacts the amount of REs present in solid solution and secondary phases.The latter (secondary phases) being more actively involved in surface processes and influence inservice release rate and levels to the host environment during corrosion or react to form corrosion products.Also,beyond the innate toxicity of the RE alloying components,their solubility limits and enhanced contact area with mediums prior to extraction — the corrosion rates of the two alloys in the culture medium plays a role during cytotoxicity tests,given the presence of chlorides and other aggressive ions in such mediums and known differences compared to HBSS.It is important to note that the finding of current study are specifi to NIH3T3 cells because in addition to alloy components,extraction parameters and different culture media impact different cell lines with different sensitivities.Further studies are needed to fully understand the competing effects of various alloy components where RE solubilities in Mg matrix are exceeded to account for the impact of degradation rate and corrosion byproducts on cytotoxicity.Such endeavors are crucial to develop more robust correlations between cytotoxicity,immersion response and to predict in vivo behavior.
5.Conclusions
The effect of REs on in vitro corrosion behavior,mechanical integrity,and cytotoxicity of two commercially available Mg-Zn-Zr-RE alloys with distinctly different concentration of REs was studied.The main observations and conclusions can be summarized as follows:
1 Both alloys possessed microstructure with T-phase precipitate along grain boundary with Zr-rich precipitate in the middle of grains.Since EZ33 had a higher volume fraction of RE,it contained more continuous and interconnected Tphase precipitates along grain boundaries.
2 The overall corrosion rate of EZ33 was approximately three times less than ZE41.At short immersion times,ZE41 exhibited higher polarization resistances and predominantly uniform corrosion indicating the development of a protective surface film However,at longer immersion times,a significan drop in polarization resistance of ZE41 in addition to trends observed in capacitance and during open circuit potentials verifie that EZ33 developed a more stable and protective film Potentiodynamic polarization tests confirme that the increased volume fraction of REs in EZ33 resulted in a decrease in anodic reaction kinetics therefore decreasing its corrosion rate.
3 The corrosion response of both alloys was significantl influence by the alloy’s microstructure constituents and their distribution.Real time in-situ corrosion analysis on the alloys showed corrosion initiating adjacent to T-phase precipitate along grain boundaries resulting in eventual falling of the precipitates.Following this the corrosion propagation on both the alloys varied significantl .In the case of ZE41 alloy following the anodic dissolution around T-phase precipitates,the Zr-rich precipitate in the middle of the grains acted as a micro cathode and continued the corrosion ofα-Mg matrix.While in EZ33 alloy,the Zrrich regions did not influenc the alloy corrosion response resulting in lower corrosion rate and more uniform corrosion.In addition,the more continuous distribution of Tphase precipitate in EZ33 alloy acted as an anodic inhibitor resulting in higher corrosion resistance and relatively uniform corrosion.
4 Post-immersion mechanical testing revealed that,while both alloys experienced some loss in their mechanical strengths,ZE41 experienced a more substantial loss in mechanical integrity compared to EZ33 alloy.ZE41 alloy showed severe localized corrosion and premature grain detachments from SEM analysis on post-immersion tensile and bending samples,resulting in higher loss of mechanical integrity.
5 Cytotoxicity results showed EZ33 alloy was comparatively more biocompatible compared to ZE41,despite having higher concentration of REs.IBoth 3-and 8-day extracted mediums showed similar results,indicating that with both concentrations of culture medium,EZ33 was less cytotoxic despite having higher RE concentrations -mainly due to its lower corrosion rate.
Credit authorship contribution statement
Marwa AbdelGawad:Methodology,Investigation,Writing -original draft,analysis,review &editing.
Chaudhry Usman Ali:Methodology,Investigation,Writing -original draft,analysis,review &editing.
Vasanth C.Shunmugasamy:Methodology,Investigation,Writing -analysis,review &editing.
Ibrahim Karaman:Writing-review,Supervision,Project administration,Funding acquisition.
Bilal Mansoor:Conceptualization,Methodology,Writing-analysis,review &editing,Supervision,Project administration,Funding acquisition.
Data availability
The raw/processed data required to reproduce these find ings cannot be shared at this time as the data also forms part of an ongoing study.
Declaration of Conflic of Interest
The authors declare that they have no known conflictin financia interests or personal relationships that could have appeared to influenc the work reported in this paper.
Acknowledgments
This research was supported by NPRP grant # 8 -856-2 -364 from the Qatar National Research Fund (a constituent member of the Qatar Foundation).The statements made herein are solely the responsibility of the authors.Open access funding was provided by Qatar National Library.The authors would also like to thank Dr.Shahab Uddin and Dr.Ahmad Iskandarani (The Interim Translational Research Institute (iTRI),Hamad Medial Corporation,Qatar) for their assistance in conducting and analyzing the cytotoxicity tests.
Supplementary materials
Supplementary material associated with this article can be found,in the online version,at doi:10.1016/j.jma.2021.11.025.
 Journal of Magnesium and Alloys2022年6期
- Journal of Magnesium and Alloys的其它文章
- EDITORIAL BOARD
- Aims and Scope
- Surface oxidation study of molten Mg-Al alloys by oxide/metal/oxide sandwich method
- Production and characterisation of new bioresorbable radiopaque Mg-Zn-Y alloy to improve X-ray visibility of polymeric scaffolds
- Quantitative study on the tension-compression yield asymmetry of a Mg-3Al-1Zn alloy with bimodal texture components
- Microstructure analyses and phase-fiel simulation of partially divorced eutectic solidificatio in hypoeutectic Mg-Al Alloys