Contact performance analysis of pressure controller's sealing interface in deep in-situ pressure-preserved coring system
Ji-Nn Li ,Jun Wng ,Yun-Qi Hu ,Zhn-Xi You ,Mng Xu ,Ying-Wi Wng ,Zu-Ji Zou ,Qi-Yu Kng
a School of Mechanical Engineering,MOE Key Laboratory of Deep Underground Science and Engineering,College of Water Resource and Hydropower,Sichuan University,Chengdu,610065,China
b Guangdong Provincial Key Laboratory of Deep Earth Sciences and Geothermal Energy Exploitation and Utilization,Institute of Deep Earth Sciences and Green Energy,College of Civil and Transportation Engineering,Shenzhen University,Shenzhen,518061,China
c State Key Laboratory of Hydraulics and Mountain River Engineering,College of Water Resource and Hydropower,Sichuan University,Chengdu,610065,China
d State Key Laboratory of Coking Coal Exploitation and Comprehensive Utilization,Pingdingshan Tianan Coal Mining Co.,LTD.,Pingdingshan,467000,China
e Xi'an Research Institute,China Coal Technology&Engineering Group Corp,Xi'an,710077,China
Keywords:
ABSTRACT
1.Introduction
During the last decades,the Earth's shallow resources have almost been exhausted due to the large-scale continuous exploitation of natural resources,and it has become a major global demand to develop deep resources inside the earth(Abid et al.,2015;Fulthorpe et al.,2018;Gao et al.,2021a;Gao et al.,2018;Ingrid and Martin,2018;Pang et al.,2015;Xie et al.,2019).Deep resources exploitation,however,is quite different from the acquisition of shallow resources,which is generally faced with extremely complicated conditions,such as high geo-stress,high temperature,high pore pressure and strong engineering disturbance(Gao et al.,2020a,2021b;Xie et al.,2020;Yang et al.,2020a,b).Such extreme conditions pose huge challenges to the efficient and safe development of deep resources since the traditional exploitation theory for shallow resources does hold true in most cases(Gao et al.,2020b).In this context,an in-situ condition-preserved coring(ICP-Coring)technology for deep reservoirs has been proposed recently,which can provide a theoretical foundation and technical support for deep resources development.(He et al.,2020;Wan et al.,2019;Xie et al.,2020,2021).As one of the key technologies,in-situ pressure-preserved coring(IPP-Coring)can not only maintain the initial formation pressure state of the core,but also minimize the loss of oil and gas components in the core,which helps to give more precise estimations of in-situ formation parameters such as reservoir fluid saturation and hydrocarbon content.Therefore,the development and breakthrough of IPP-Coring technology is of great significance for deep resources exploitation(Wu et al.,2020).Currently,the existing pressure coring technology is mainly employed in the field of petroleum geology and marine resources exploitation.Two famous coring devices,Fugro Pressure Corer(FPC)and HY-ACE Rotary Corer(HRC),have a maximum pressure-retained capacity of around 25 MPa,while the pressure-retained capacity of the Pressure Core Barrel(PCB)used in Deep Sea Drilling Project(DSDP)can reach 35 MPa.The best performance coring device is Pressure Core Barrel(PCS)with a pressure-retained capacity of 70 MPa,which has been successfully applied in the Ocean Drilling Program(ODP)(Chen et al.,2013;Dickens et al.,2000;He et al.,2020;Milkov et al.,2004;Schultheiss et al.,2009).In contrast,the pressureretained coring tool developed by China Great Wall Drilling Company,namely GW-CP194-80A(Yang et al.,2020a,b),shows a pressure-retained capacity of approximately 60 MPa in many tests but without field application(Yang et al.,2020a,b).Technically speaking,although many global achievements have been obtained in the development of the pressure-retained coring technologies,it remains challenging to develop high-performance pressure coring tools with high reliability and bearing capacity to meet the coring requirements of deep drilling,especially in complex formations with ultra-high temperature and high pressure(Gao et al.,2021;He et al.,2019;Lan et al.,2019;Li et al.,2021;Yu et al.,2020).
In the IPP-Coring system,the sealing performance of the pressure controller is the key point to realize sufficient pressurebearing capacity under deep extreme conditions.The configuration optimization of the pressure controller solely from the macro level can hardly meet the harsh working environment in deep reservoirs,and the mechanism investigation on the micro-contact behavior of the rough surface proves to be a potential approach to strengthen the sealing performance.Regarding to the microcontact mechanism of rough interfaces,Whitehouse and Archard(1971)pointed out that the morphology altitude of most engineering rough surfaces follows the Gauss distribution with an exponential autocorrelation function.Hu and Tonder(1992)proposed a new simulation method of three-dimensional rough surface based on autoregressive(AR)time series model for microcontact behavior investigation,which can quickly generate Gaussian or non-Gaussian rough surface with different statistical parameters.To reveal the effect of surface roughness on the gas pressure flow,Ren et al.(2010)simulated the random rough contact surfaces with arbitrary shapes and analyzed the flow behavior of two-dimensional leakage channels.Based on the Gauss distribution function and the exponential autocorrelation function,Lyu et al.(2015)reconstructed the rough surface model of metal gasket sealing structure,and unraveled the influences of rough surface characteristic parameters and contact pressure on the leakage rate of sealing structure.However,the contact models used in the previous literatures are usually simplified as the contact between a rigid plane and a rough surface,which cannot fully reflect the realistic contact behavior of two rough interfaces.
To reveal the realistic contact behavior of the valve sealing interface of the pressure controller,this work first analyzed the macro contact mechanical behavior based on the geometry configuration and the working principle of a pressure-retained controller.Combined with the micro-contact theory of rough surfaces,a three-dimensional contact model considering the rough sealing interface between the valve cover and the valve seat of the pressure controller was constructed.Systematic numerical simulations have been performed to investigate the micro-contact behavior of the metal seal surfaces for different roughness cases,based on which the relationship between the actual contact area of the metal seal surface and the pressure loading was uncovered.According to the practical engineering requirements,the influences of different surface roughness and material properties on the contact behavior of the sealing surface were further revealed,which may provide a theoretical guidance to sealing design and optimization of the in-situ pressure-retained controller under deep extreme conditions.
2.Rough contact model construction of valve interface in pressure-retained controller
2.1.Contact analysis of sealing interface of a new-designed pressure controller
To meet the technical requirements of deep IPP-Coring,a novelty pressure controller has been designed in our recent work based on the principle of cone self-tightening seal,which is mainly composed of a valve cover and a valve seat(Fig.1a).When the internal core barrel is raised to a certain position,the valve cover will be triggered to turn over,resulting in a rotation of the valve cover from the vertical direction to the horizontal direction.Since a sealing ring is installed between the valve cover and the valve seat,there is a certain sealing clearance between the valve cover and the valve seat.During the working process,the clearance of the sealing interface will diminish gradually as the pressure acting on the valve cover is continuously increased,by which the metal contact seal ultimately works.
During the coring operation,when the IPP-Coring tool accomplishes the coring at the hole bottom,the initial seal is realized as the valve cover closes under the action of the pre-tightening component.The pre-tightening component mainly consists of a spring and a spring barrel.The preload generated by the spring forces the valve cover to close via the spring barrel(see Fig.1b).Once the IPP-Coring tool is lifted from the hole bottom to the ground,the pressure difference between the interior and exterior of the pressure chamber will be gradually increased due to the decrease of external environmental pressure,so the pressure acting on the pressure controller is also increased.
When the metal seal works on the contact interface between the valve cover and the valve seat(see Fig.2a),a self-tightening conical seal is ultimately formed,and such kind of sealing performance is closely associated with the contact behavior of the metal seal surface.Since the configuration of the valve cover is determined by the intersection of a cylinder and a circular cone,the contact surfaces of the controller are distributed on different curves of the same conical mating surface.As shown in Fig.2b,A and B are the two limit states positions of the contact between the valve cover and the valve seat on different cutting planes.The valve cover is subjected to the hydraulic pressure inside the IPP-Coring tool,the bearing force from the valve seat,the friction force on the sealing interface,and the gravity.For the sake of simplification,the contact analysis in this paper is only based on the requirement that the structural strength of the valve cover meets the interior hydraulic pressure,so the change of contact area caused by the elastic-plastic deformation of the valve cover is ignored.
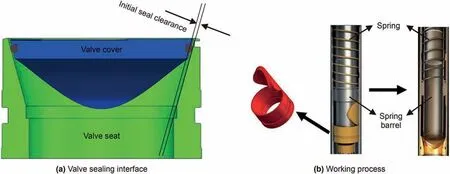
Fig.1.Sealing principle of the pressure controller.

Fig.2.Physical model of the sealing interfaces of pressure controller.
2.2.Mathematical model of rough sealing interface reconstruction
The valve sealing of the pressure controller is essentially the close contact between the metal surfaces of the seat and the cover.Thus,the micro structure of the contact interface plays a significant role in the sealing performance.Fig.3 shows the micro topography of the contact seal surface of the valve cover,which demonstrates that the macro smooth contact of the metal sealing surface essentially relies on the micro mechanical contact of rough surfaces.
Generally,a rough-surface contact model is widely applied to investigate the sealing behavior of sealing parts.A threedimensional rough surface is usually constructed based on statistical principles and mathematical methods,which can be characterized by two key factors.As shown in Table 1,one is the height distribution characteristics,including peaks and valleys,while the other is the spatial distribution feature,which reflects the spatial dependence of each point on the rough surface.

Table1 Roughness characterization parameters.
The amplitude parameters mainly reflect the height distribution of rough surfaces.Specifically,the root mean square deviation Sqrepresents the root mean square value of height distribution in the sampling area,which is defined as

Similarly,the arithmetic mean deviation Sarepresents the arithmetic mean value of the absolute value of the height within the sampling area,which is defined as
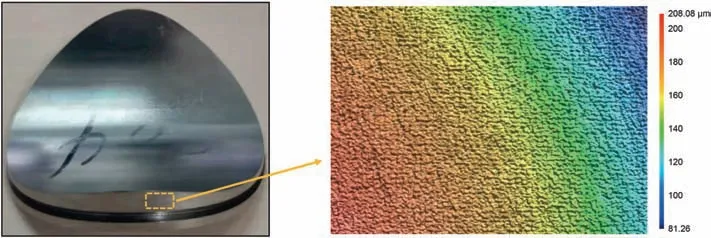
Fig.3.Micro morphology of the cover contact interface.

The skewness Sskindicates the symmetry of the probability distribution of the surface height within the sampling area,and its value reflects the degree of deviation from the center.In Gaussian surface,Ssk=0.When Ssk<0,the surface height distribution has a left skew associated with a sharp valley.When Ssk>0,the surface height distribution has a right skew associated with a sharp peak.Its mathematical expression is

The kurtosis Skuindicates the sharpness of the probability distribution of the surface height within the sampling area.More extreme values of the surface height mean more peaks and valleys on the surface,corresponding to a larger kurtosis,and vice versus.In Gaussian surface,Sku=3.The mathematical expression of the kurtosis is

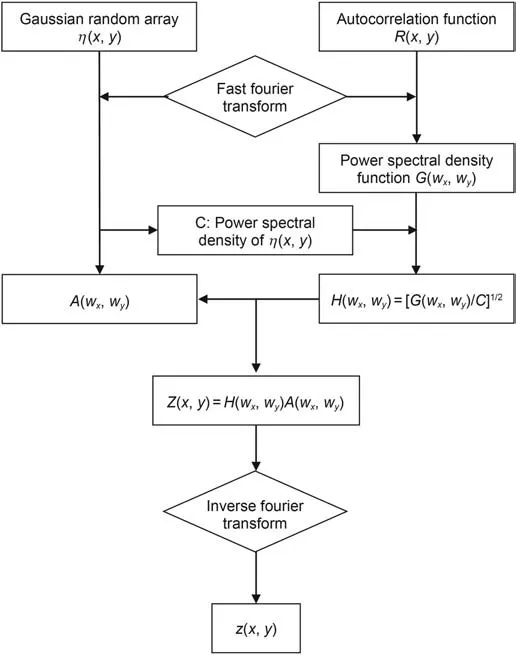
Fig.4.Numerical reconstruction scheme of rough sealing interfaces.
Since the height distribution of each point on the rough surface is not completely independent,the dependence of each point at different positions can be represented by the autocorrelation function(ACF).The mathematical expression of ACF is as follows

where E represents the mathematical expectation,and z(I,J)is the height distribution sequence of rough surface,which is treated as a discrete stationary random process.Besides,k and l are the correlation distances in X and Y directions.In the case of traversal,ACF can be expressed as:

where M and N represent the number of points on the rough surface in X and Y directions,respectively.
Spatial parameters are further obtained based on the autocorrelation function,which can reflect the horizontal distribution characteristics of rough surfaces.The autocorrelation length Salrepresents the length in the horizontal direction in which ACF decays to a specific value(generally 0.1).

Whereτxandτyare the horizontal components of the autocorrelation length.
Although the generation of rough surfaces is a random process,the rough surfaces with the same height parameters are usually regarded as equivalent surfaces.According to the previous studies(Colak et al.,2007;Hu and Tonder,1992;Mu et al.,2018),the surface profile data of milling and grinding parts approximately follows the Gaussian distribution,and the probability density function can be defined as follows:

Generally,the autocorrelation function of a rough surface agrees well with the exponential autocorrelation function(Hu and Tonder,1992;Masjedi and Khonsari,2015).Thus,the exponential autocorrelation function is also adopted in this study to construct rough sealing surfaces for contact seal simulations.The exponential autocorrelation function is defined as follows

whereσalso known as root mean square roughness,is the standard deviation of the surface height,τxandτyare the autocorrelation lengths in X and Y directions,k and l are the distances of sampling points in X and Y directions,respectively.Obviously,the spatial distribution of rough surfaces is different with different autocorrelation lengths.The rough surface is isotropic whenτx=τy,while it is anisotropic ifτx≠τy.
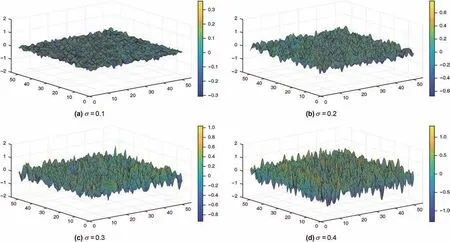
Fig.5.Reconstructed sealing surfaces with different roughness.
Besides,the surface roughness of general engineering technology is generally characterized by the arithmetic mean deviation Ra(Ra=Sa),and there is a specific relationship betweenσ and Ra(Zhao et al.,2006):

In this study,inspired by the two-dimensional digital filtering algorithm proposed by Hu(Hu and Tonder,1992),a micro roughsurface model of the contact interface is constructed by using the specified exponential autocorrelation function and fast Fourier transform(FFT).The numerical construction scheme of rough surfaces is shown in Fig.4.
3.Numerical simulation and analysis of contact characteristics of valve sealing interfaces
Due to the fact that the sealing performance is directly affected by the micro contact behavior of the metal sealing interface,the micro surface roughness is one of the decisive impact factors of contact seal performances for a specific metal material.In this paper,stainless steel 304 is selected as the metal material for the rough-surface contact modeling.
3.1.Reconstructed models of contact surfaces with different roughness
To modeling various rough surfaces with different roughness,the root mean square roughnessσwas selected as 0.1,0.2,0.3 and 0.4,respectively.Four Gaussian rough surface models with different roughness were established by the isotropic surface method,and the model size was set as 50μm×50μm.According to the autocorrelation function and the random array,the height data z(x,y)was obtained by Fourier transform,and the amplitude matrix is generated based on Gaussian distribution,which eventually can be transformed into point cloud(x,y,z).The generated numerical random surfaces with various roughness are shown in Fig.5.
The above numerical rough surfaces can be discretized by meshing,including 200×200 grids and 40401 nodes.The approximate surface arithmetic mean deviation Ra0is further evaluated according to the height value of discrete points,which shows a good agreement with the theoretical value Racalculated by Eq.(10)(see Table 2).Such an agreement demonstrates the validity of our construction method of rough surfaces.

Table2 Method validation for rough surfaces reconstruction.
Based on the raw data of rough surfaces with different roughness,the height distribution histograms of discrete points are comparatively displayed in Fig.6.
As shown in Table 3 and Fig.6,the arithmetic mean deviation Ra0calculated from the constructed models agrees quite well with the theoretical predictions of Eq.(10),and the height distribution histograms of various rough surfaces are approximately consistent with Gaussian distribution.Therefore,the generated rough surfaces based on Gaussian distribution are practical and feasible.The 3D solid model of a rough contact surface can be easily built as shown in Fig.7.

Table3 Identification of contact surfaces with different roughness.
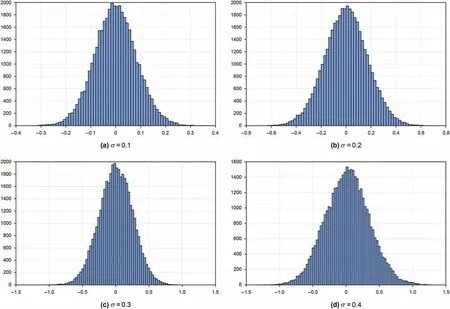
Fig.6.Height distribution histogram of discrete points on different rough surfaces.
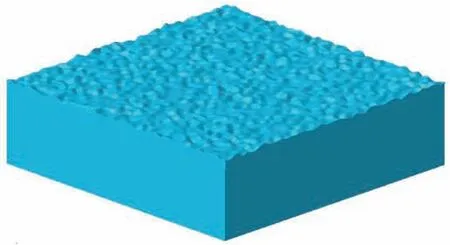
Fig.7.3D solid model of a rough surface.
3.2.Effect of surface roughness on micro-contact behavior
To investigate the contact characteristics of micro rough surfaces,the contact between two rough surfaces is usually simplified as the contact between a rough surface and a rigid plane(Ciavarella et al.,2006;Yang and Jackson,2017;Wang et al.,2021).Based on the Finite Element Method(FEM),the simplified micro-contact model by considering a single rough surface can be established in Fig.8.The matrix material is stainless steel 304 with the elastic modulus E=200 GPa and the Poisson's ratio v=0.3.The vertical downward load is applied to the rigid plane,the bottom of the domain is fully constrained,and the sides are symmetrically constrained.
As illustrated in Fig.9,the mean value surface is defined as the virtual surface located on the average height coordinate(z=0)of the rough surface,and the initial distance between the rigid plane and the mean value surface is set as h0=3.0μm.
Based on different roughness,the contact models containing a rigid plane and a rough surface are established,and the displacement load is applied to them.The actual contact area and the required contact force F under different contact conditions are calculated.The ratio of actual contact area to ideal contact area is defined asα(area ratio for short),while the displacement variation is H and the loading time is recorded as t.

Fig.8.FEM-based contact model of a single rough surface.

Fig.9.Schematic of the simplified hard-contact model with a single rough surface.
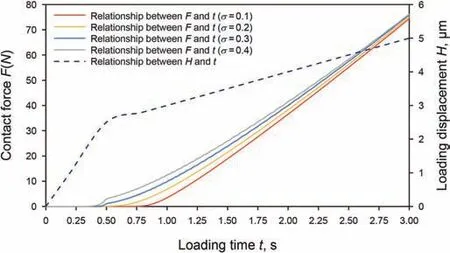
Fig.10.Variations of the contact force and loading displacement of various reconstructed contact surfaces versus loading time.
Based on different contact area ratios,the variation of rough surface topography withσ=0.1 is shown in Fig.12.When the contact area is small,there are many pores and micro leakage channels can be formed between the contact surfaces.With the increase of the load,the actual contact area ratio of rough surfaces becomes larger and larger.The microporous channels formed between rough contact surfaces gradually decrease with the increase of the contact area ratio,and the leakage channels gradually decrease or even disappear,so that the leakage rate between contact surfaces gradually decreases.
3.3.Comparative analysis and discussion of the realistic and the simplified contact models
The contact law of rough surfaces can be analyzed by the simplified contact model,but the influence of the simplification on the real contact behavior of double rough surfaces and the construction of microchannels between two rough surfaces has not been studied in detail.Therefore,this paper compares the double rough surfaces contact model and the simplified contact model.According to the actual contact process of double rough surfaces,a real contact model is established to study the contact behavior of sealing interfaces with different roughness under different contact gaps(Fig.13).Stainless steel 304 is selected as the matrix material with the elastic modulus E=200 GPa and Poisson's ratio v=0.3.A vertical downward load is applied to the upper body,while a full constraint is prescribed to the bottom of the lower body,and a symmetric constraint boundary condition is applied to both sides of the two contact bodies.
To simplify the contact model of double rough surfaces,it is necessary to establish the contact model between a rigid plane and an equivalent rough surface.In our models,the equivalent root mean square roughnessσ0of the equivalent rough surface is defined as follows:

Where,σ1andσ2are the root mean square roughness of the two rough surfaces in the double rough surface contact model respectively.In Table 3,A0represents the contact surface of the rigid body,while A1,A2and A3represent the real rough surfaces with a roughness coefficient of 0.1,0.2 and 0.4,respectively.The contact surface A12represents the equivalent rough surface determined by the characterization coefficients of the surfaces A1and A2.Similarly,A13is the equivalent rough surface associated with A1and A3,and A23is the equivalent rough surface associated with A2and A3.According to the contact surfaces with different roughness in Table 3,the corresponding contact models can be established for comparative analysis as shown in Table 4.

Table4 Construction of contact models with different specifications.
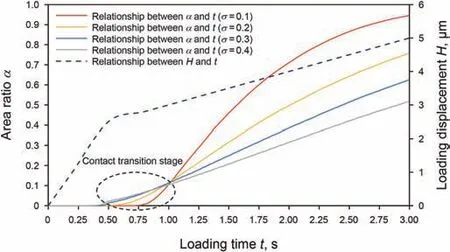
Fig.11.Variations of the contact area ratio and loading displacement of various reconstructed contact surfaces versus loading time.
The initial distance between contact surfaces in each group of models is set to 3μm,and the results are as follows(Fig.14).Where H is the displacement variation,Fais the force required for the rough solid to apply the displacement load,and Fbis the force required for the rigid plane to apply the displacement load.
As shown in Fig.14,when loading the same displacement,the force required by the equivalent simplified contact model is twice that of the realistic contact model with double rough surfaces.This is because the contact force required by the loading displacement is mainly caused by the elastic deformation of the rough solid model itself,while there is only one elastic body in the simplified model,and its deformation is twice that of the double rough surface contact model.The effect of asperity deformation on the force is negligible.Under the double pressure load,the contact area ratio of the simplified contact model is still about 10%smaller than that of the double rough surfaces contact model.However,the variation curve of area ratio and load has an approximate slope,that is,it has an approximate changeable rule.Therefore,the simplified model can reflect the change law of micro contact behavior of double rough surfaces to a certain extent.If the simplified model is used to evaluate the sealing performance through the actual contact area,the load applied on the contact surface should be corrected,and the specific correction method needs to be further discussed.
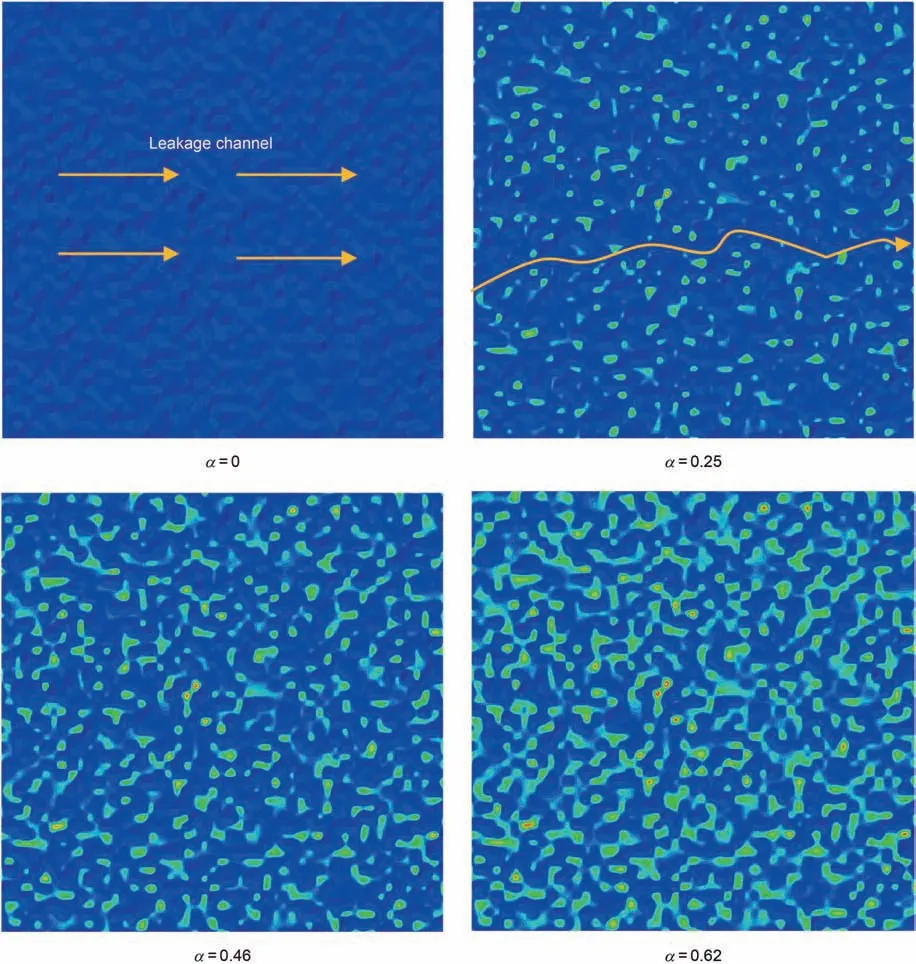
Fig.12.Variation of rough surface topography during the loading.

Fig.13.Realistic contact model with double rough surfaces.
To study the sealing performance of the sealing interfaces,in addition to the contact behavior analysis,it is also necessary to analyze the internal microchannel area under the contact effect of double rough surfaces,which helps to give a precise evaluation of the sealing performance.Fig.15 shows the comparison of the rough surface morphology of the double rough surfaces contact model and the simplified contact model in comparison groups(No.1 and No.2)after the sealing interfaces contact.Fig.15a shows the contact stress contour of the rough surface when the contact area ratio is 0.6,while Fig.15(b)shows the contact stress contour of the rough surface when the contact area ratio is 0.4.By comparison,with the same contact area,the contact stress of the rough surface in the simplified model seems larger,which is attributed to the large force applied to it.In the double-rough-surface contact model,the contact stress on the rough surface is smaller with a relatively uniform distribution,because the staggered distribution of random rough peaks makes the initial contact area larger.Meanwhile,the doublerough-surface contact model and the simplified model have completely different surface contact morphology,which implies that the simplified model cannot truly reflect the microchannel structure between the sealing interfaces.
Compared with the real contact model with double rough surfaces,although the simplified hard-contact model with a single rough surface can reflect the micro-contact behavior of the rough surface to a certain extent,it cannot truly reveal the microchannelmorphology between the sealing interfaces under pressure.Therefore,the realistic contact model with double rough surfaces should be used to analyze the metal sealing performance.
4.Contact performance analysis of pressure controller using various manufacturing materials based on practical engineering requirements
As a common structuring material,stainless steel 304 is often used to process the sealing parts of pressure controllers(see Fig.16).However,in actual engineering,different materials are usually selected to process the valve cover and the valve seat according to the practical sealing requirements of different contact surface combinations.The effect of material properties on microcontact behavior should be revealed.Based on the realistic contact model with double rough surfaces,various contact models with different material properties have been constructed and analyzed in this section.
According to the characteristics of random distribution,two rough surfaces withσ=0.2 are generated,which have the same statistical parameters but different surface morphology.To comparatively study the contact behaviors of different sealing interfaces with different materials,stainless steel 304 was prescribed to model the valve seat,while three metal materials,including stainless steel 304(E=200 GPa,v=0.3),aluminum alloy 7075(E=70 GPa,v=0.3)and titanium alloy TC11(E=120 GPa,v=0.3),were selected for different valve covers modeling.The corresponding double-rough-surface contact models were constructed for analysis(Fig.17),and the numerical simulation results are discussed as follows.
5.Conclusions
To reveal the contact behavior of the valve sealing interface of the pressure controller,this work has presented a 3D reconstruction method for contact surfaces with different roughness,based on which a series of numerical simulations were conducted for microcontact mechanical analysis.The difference in contact characteristics between the simplified and the real contact models was comparatively discussed.The main conclusions are summarized as follows:
(1)Based on the structure analysis and sealing principle of the pressure controller,the numerical model of the micro rough sealing interface can be reconstructed by using a twodimensional digital filtering algorithm,and the 3D finite element models can be further established to analyze the contact characteristics of the sealing surfaces with different roughness.With the increase of surface roughness,the actual contact area of the sealing interface increases when the loading is less than the critical contact pressure but decreases after the critical point.For practical engineering applications,it is suggested to enhance the contact area ratio as high as possible for strong sealing performance.
(2)According to the comparative analysis of the simplified contact model and the real contact model considering double rough surfaces,the contact area ratio of the simplified model is about 10% smaller than that of the double rough surfaces contact model under the same loading displacement.A clear discrepancy of contact morphology is also observed between the simplified model and the elaborated model.Although the simplified model can reflect the general characteristics of micro contact behavior of the double rough surfaces to some extent,it is difficult to reveal the real evolution process of the micro-contact channels between the sealing interfaces.Therefore,a real contact model considering double rough contact surfaces should be recommended to analyze the sealing performance of pressure controllers especially under high pressure conditions.
(3)In addition to the interface roughness,the mechanical property of the manufacturing materials,such as the elastic modulus,has a significant effect on the contact performance of the valve sealing interfaces.The actual contact area of the rough surfaces will decrease with the increase of the elastic modulus under the same loading conditions.When the ultimate strength of a pressure controller meets the practical demands,the sealing performance can be improved to a certain extent by selecting a suitable material with relatively low elastic modulus for parts processing.
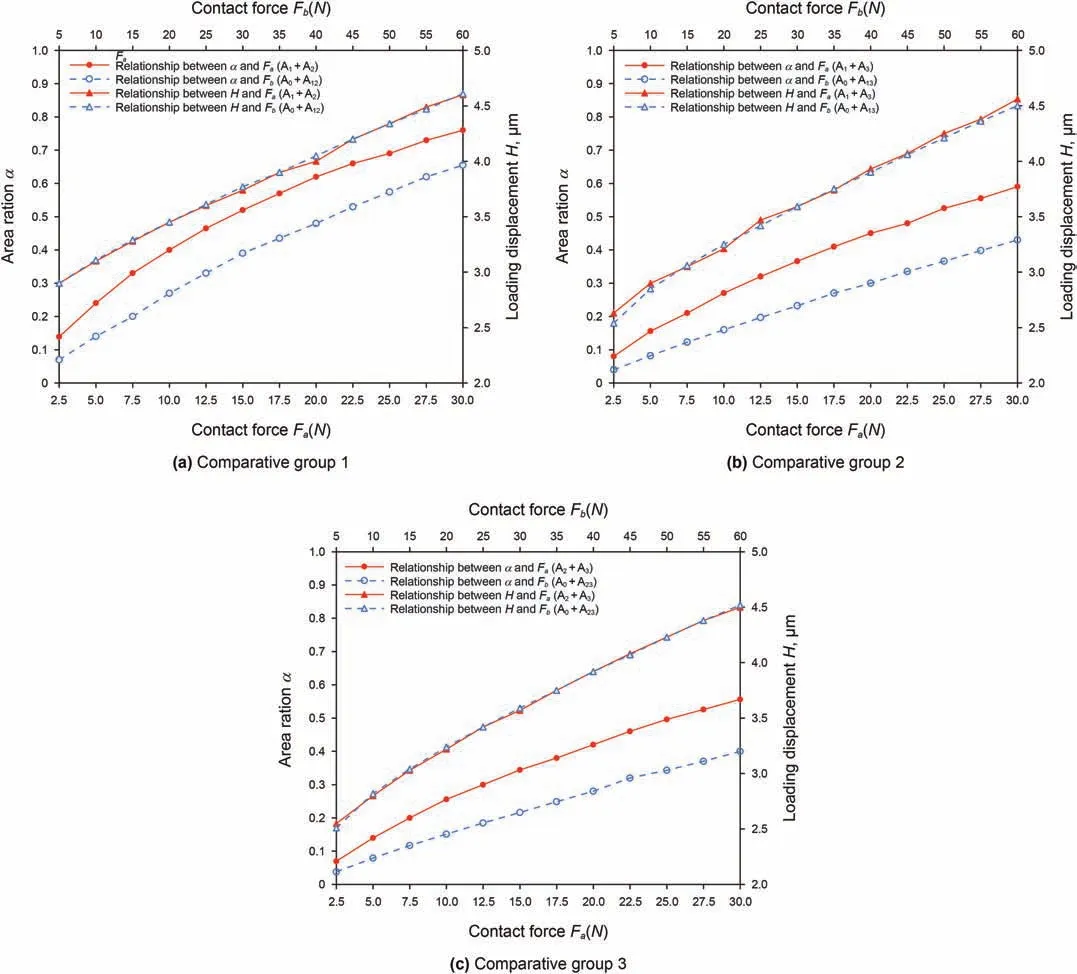
Fig.14.Comparison results of contact performances of realistic contact models and simplified contact models.

Fig.15.Comparison of contact area morphology between the realistic and the simplified contact models.
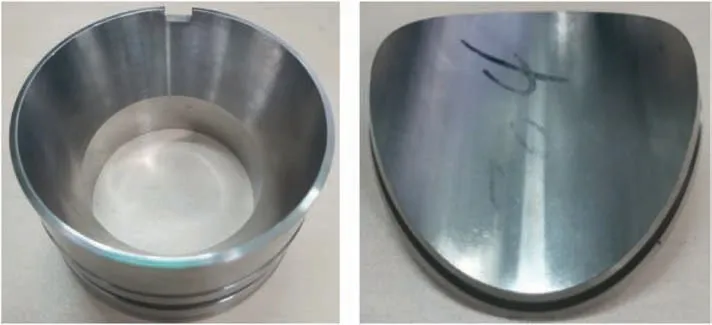
Fig.16.Key components of the pressure controller.
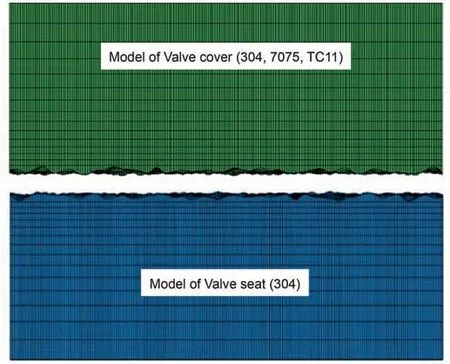
Fig.17.Contact model with of different manufacturing materials.
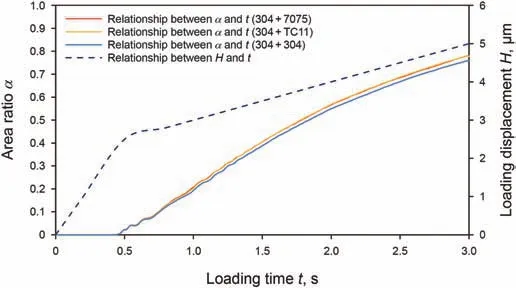
Fig.18.Variations of the contact area ratio and loading displacement of sealing interfaces versus loading time for different contact materials.
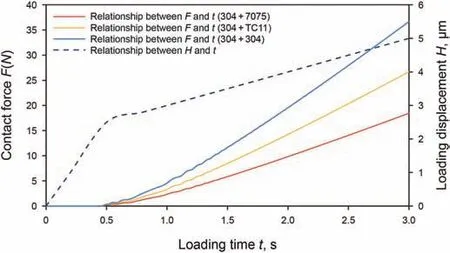
Fig.19.Variations of the contact force and loading displacement of sealing interfaces versus loading time for different contact materials.
Acknowledgments
The paper was supported by the Program for Guangdong Introducing Innovative and Entrepreneurial Teams(No.2019ZT08G315),Shenzhen Basic Research Program(General Program,No.JCYJ20190808153416970)and National Natural Science Foundation of China No.51827901.The financial aids are gratefully acknowledged.All the efforts from the editors and the anonymous reviewers to improve our work are also highly appreciated.
Chen,J.W.,Wei,F.,Brian,B.,et al.,2013.A long gravity-piston corer developed for seafloor gas hydrate coring utilizing an in situ pressure-retained method.Energies 6(7),3353-3372.https://doi.org/10.3390/en6073353.
Gao,M.Z.,Xie,J.,Guo,J.,et al.,2021a.Fractal evolution and connectivity characteristics of mining-induced crack networks in coal masses at different depths[J].Geomech.Geophys.Geo-Energy Geo-Resour.7(1),9.https://doi.org/10.1007/s40948-020-00207-4.
He,Z.Q.,Xie,H.P.,Gao,M.Z.,et al.,2020.Design and verification of a deep rock corer with retaining the in situ temperature.Adv.Civ.Eng.2020(11),1-13.https://doi.org/10.1155/2020/8894286.
Ingrid,T.,Martin,S.,2018.A review on challenges in the assessment of geomechanical rock performance for deep geothermal reservoir development.Renew.Sustain.Energy Rev.82(3),3972-3980.https://doi.org/10.1016/j.rser.2017.10.076.
- Petroleum Science的其它文章
- Sedimentary characteristics and implications for hydrocarbon exploration in a retrograding shallow-water delta:An example from the fourth member of the Cretaceous Quantou Formation in the Sanzhao depression,Songliao Basin,NE China
- Study of the gas sources of the Ordovician gas reservoir in the Central-Eastern Ordos Basin
- A novel hybrid thermodynamic model for pore size distribution characterisation for shale
- Microstructural analysis of organic matter in shale by SAXS and WAXS methods
- Investigation of oil and water migrations in lacustrine oil shales using 20 MHz 2D NMR relaxometry techniques
- Fast least-squares prestack time migration via accelerating the explicit calculation of Hessian matrix with dip-angle Fresnel zone

