Microstructural analysis of organic matter in shale by SAXS and WAXS methods
Kou-Qi Liu ,Zhi-Jun Jin ,Lin-Bo Zeng ,Meng-Di Sun ,Bo Liu ,Ho Won Jng ,
Majid Safaei-Farouji c,e,Mohammadreza Shokouhimer f,**,Mehdi Ostadhassan c,g,h,*
a Institute of Energy,Peking University,Beijing,100871,China
b State Key Laboratory of Petroleum Resources and Prospecting,China University of Petroleum(Beijing),Beijing,102249,China
c State Key Laboratory of Continental Shale Accumulation and Efficient Development,Ministry of Education,Northeast Petroleum University,Daqing,Heilongjiang 163318,China
d Department of Materials Science and Engineering,Research Institute of Advanced Materials,Seoul National University,Seoul,08826,Republic of Korea
e School of Geology,College of Science,University of Tehran,Tehran,Iran
f Department of Materials Science and Engineering,Seoul National University,Seoul,08826,Republic of Korea
g Institute of Geosciences,Marine and Land Geomechanics and Geotectonics,Christian-Albrechts-Universit¨at,Kiel,Germany
h Department of Geology,Ferdowsi University of Mashhad,Mashhad,Iran
Keywords:
ABSTRACT
1.Introduction
It's well proven that organic pores partially control the storage and transport of hydrocarbons in organic rich shale plays(Ross and Bustin,2009;Gensterblumet al.,2015).However,majority of the studies that have investigated organic-rich shale plays,so far have been focused on the organic pores in shale gas formations and neglected tight oil reservoirs such as shale plays(Loucks et al.,2009;Tian et al.,2015;Wang et al.,2016;Sun et al.,2016).
Using electron microscopy methods,several researchers have found that organic pores play a dominant role in the total pore structure and can control the flow behavior of shale plays(Guan et al.,2019;Zhou et al.,2016;Yang et al.,2016).In the study that was performed on the Wufeng-Longmaxi Formation,Zhang et al.(2019)understood that the pore structures are controlled with the type of the organic matter.They concluded that the pores in bitumen are well developed while the pores are not as developed in graptolites.Guan et al.(2019)realized that in the Longmaxi shale samples,the structural OM pores evolve from telalginites of biogenic origin of phytoplankton and acritarch,while the nonstructural spongy OM pores are from the bacterial activity,benthic algae and certain graptolites.Hu et al.(2020)argued that the pores in alginite I are elongated and lattice-like arranged and the organic pores in alginite II are more complicated.In addition to the organic matter types that could affect the organic pores,maturity is also another factor that can control the organic pores.Loucks et al.(2009a,b)proposed that nanopores are formed in organic matter during hydrocarbon generation at vitrinite reflectance(VRo)values>0.80%.Through the studies of the Woodford shale samples,Curtis et al.(2012)reveald that no secondary organic pores were present in the samples with VRo<0.90%.Alcantar-Lopez(2016)found that organic pores changed from a spherical structure into a cross-linked connected network as maturity increased.Liu et al.(2019)showed that the changes of the pore structures of shale with different form of the organic matter with increasing maturity can differ which could be attributed to different activation energies of the organic matter.
Based on the literature that was presented,majority of the studies on the organic matter pore structure are within the shale gas area.This is mostly because such shale samples are in the higher thermal maturity stages,therefore the organic matter pores are abundant and easier to be identified and quantified.Conversely,in tight oil plays that organic matter could be at lower maturity stages such as the Bakken Formation,thus it would be challenging to directly observe organic porosity with electron microscopy methods.This is because of either limited resolution in the instrumentation or such pores are occupied by oil or bitumen.Therefore,analyzing the kerogen or organic matter that is extracted from the mineral matrix could be an excellent approach to study organic pores with less obstacles via indirect methods.Liu et al.(2019)extracted the kerogen from the Bakken Formation and analyzed pore structures with gas adsorption methods.However,gas adsorption can only detect connected pores and leaves isolated ones out of detection which does not represent the true porosity that is hosted by the organic matter that can be occupied by adsorbed hydrocarbons.
To address the above issue,small angle scattering techniques were employed to evaluate the pore information of shale samples by quantifying the pores in a particular interval of the scattering angle of the scattered wave(AlHumaidan et al.,2015).The scattering techniques are inexpensive,noninvasive,require little sample preparation and can be performed both on the oriented bulk samples and the crushed samples(Radlinski et al.,2004).By using either the neutrons or the X-Ray beam,the small angle scattering techniques can be further divided into two methods:small angle neutron scattering(SANS)and small angle X-ray scattering(SAXS).The range of the scattering vectors of these two methods are very close(the scattering vector range of the SANS is 0.001-0.5Å-1which the scattering vector range of the SAXS is 0.005-1Å-1)(Sun et al.,2020).Because of the flux rate of the X-rays,in addition to their high levels of energy,compared with the neutrons,the counting time of the SAXS is significantly smaller than SANS(Leu et al.,2016;Melnichenko et al.,2012)which can be from seconds to minutes while for SANS it's from minutes to hours.However,SANS have some advantages compared to SAXS.For example,SANS method can get the absolute scattering data directly from the beam flux while in SAXS,through the analysis of standard samples(water and glass carbon),one can better understand the absolute intensity of X-ray scattering(Xie et al.,2018).
When internal structures such as the pore surface characteristics,pore size distribution,and pore volume are the topic of study,small-angle X-ray scattering(SAXS)is a powerful method for both ordered or disordered materials(Kikhney and Svergun,2015;Tsao et al.,2007).Galantini et al.(2010)explained that SAXS is a rapid nondestructive technique that can be used to restore the 3D structure and pore system at lower resolutions.The SAXS has the advantage of revealing the information from the isolated pores(Melnichenko,2016),which is beyond the ability of some other conventional fluid invasion methods such as gas adsorption and high-pressure mercury intrusion(MICP).Therefore,SAXS method has been utilized to study geomaterials in a limited scope(Zhao et al.,2019;Leu et al.,2016;Sun et al.,2020).Likewise,WAXS(wide angle X-Ray scattering)is similar to SAXS except the distance of the sample to the detector is shorter which can be used to get the diffraction maxima at larger angles.WAXS method has always been used by researchers to identify minerals and the crystal orientation(Giannini et al.,2014).Hence,using SAXS and WAXS in conjunction can enable us to understand the local porosity,pore size distribution and the mineralogy(Leu et al.,2016).On one hand published studies on geomaterials using a combination of SAXS-WAXS is rare to the best of our knowledge,especially in shale rocks,on the other hand most of them are limited to bulk samples(Leu et al.,2016)and characterizing the isolated kerogen is hardly.We understood this knowledge gap and conducted a series of SAXS-WAXS experiments on several isolated organic matter to see how such methods can reveal the organoporosity of shale rocks.
Based on what was said above,we first extracted the organic matter from the mineral matrix on four representative samples at varying thermal maturities that were obtained from the Bakken Formation in ND,USA.Then,we applied the WAXS method to characterize the chemical compositions of the organic matter.In the next step,SAXS method was employed to further analyze the microstructure information of the organic matter and evaluated how these two sources of data can be correlated to better define the samples.
2.Methods
2.1.Sample preparation
Four samples were collected from the shale members of the Bakken Formation in North Dakota.The samples were first crushed into powders and examined for their thermal maturity using the default pyrolysis method by Rock Eval instrument.When it was ensured samples are at various stages of thermal advance from immature to post mature,organic matter was extracted from the mineral matrix.The details of the isolation process for these samples could be found in Khatibi et al.(2018).Briefly,first around 30 g of the samples were appropriately washed and crushed to a reasonable mesh size.Then,the samples were placed into a concentrated 37% HCl to remove carbonates and then exposed to concentrated 48%HF for digestion of the remaining silicates.Next,samples were placed in concentrated HCl for the second time to eliminate all remaining minerals.Finally,the mixture is centrifuged to separate organic matter from the liquids.The kerogen isolation process was performed by the National petrophysics service company,Texas.
2.2.SAXS and WAXS
The SAXS measurements were conducted on isolated kerogen samples that were in the form of a powder using Bruker AXS,DE/D8 Discover with a GADDS instrument while the WAXS measurements were performed on the same samples again in a powder form with an Ultra-Small-Angle to Wide-Angle Dual Source X-ray Scattering Spectrometer,XEUSS2.0,France,Xenocs 2019.The experiments were performed with an X-ray beam of 12.4 keV photon energy while the beam was focused to a spot size of 10×25μm2and a scanning range of 2×2mm2,for SAXS and WAXS,respectively.The sample-to-detector distance were set to 630.5 mm for the WAXS and 7.1 mm for the SAXS detectors.
Fig.1 shows the schematic diagram of the SAXS experiment.It's well understood that there isn't any interaction or exchange of energy between the scattered particles and the medium that scatters those particle in an elastic scattering event.After the scattering event,the wavelength remains unaltered while the direction changes from K0to K1.Then the scattered wave and the incident vectors separation is scattered again through the angle 2θ and can be represented by the following expression(Guinie,1937):

whereλis the wavelength of the incident beam and q is the scattering vector.In the SAXS experiment,the incident wavelength is usually fixed,and thus in Eq.(1),q is directly related to the scattering angle.Then,in a crystal lattice which has the interlayer spacing‘d’,simple diffraction between the two layers,λ,can be described by the Bragg's law(Bragg and Bragg,1913):

where n is an integer.Hence,the following expression can be obtained by combining Eqs.(1)and(2):

In a SAXS instrument,d can also represent the pore size of the material where based on Eq.(3)smaller pores should own larger q values or larger scattering angles.
The polydisperse spheres model is applied to the SAXS data to obtain the pore information such as the pore size distribution,pore surface area,and porosity.The scattering intensity for polydisperse randomly oriented spheres can be calculated using the following equation(Hinde,2004;Radlinski,2006):

whereρ-ρairis the difference of the scattering length density(SLD)of the material and the air,φis the porosity,Vris the average pore volume,f(r)as the pore-size distribution probability function which is determined using the PRINSAS software,and F(qr)is the form factor of the solid spheres which can be calculated through:

The SLD values of composite materials can be determined using the following equation:

where j=1 and m are individual existing phases in the samples,Vjandρjare the volume percentages and the SLD values of the jth phase,respectively.
Alike SAXS,WAXS is also the elastic scattering of the X-rays with the primary difference in the corresponding length scale.The scattering angle of SAXS is just up to a few degrees while in WAXS,the scattering angle can be up to around 40˚.SAXS is mainly used for deriving the structural information of the rock samples while WAXS can determine the mineralogy of the rock samples.
3.Results and discussions
3.1.Rock-eval analysis
The geochemical overview of the four bulk samples that the organic matter was isolated from is shown in Table 1 which has been studied by Lee et al.(2020)who focused on the molecular weight studies.The reflectance measurements of the solid bitumen(SBRo%)in the absence/scarcity of the vitrinite maceral through organic petrology methods is used to verify the maturity levels.The organic matter of these samples all belong to type II(which is typically deposited in the marine environment and has the oil/gas prone hydrocarbon potential)(Abarghani et al.,2019).Table 1 shows that the maturity increases from sample 1(immature)to sample 4(peak-oil production window).

Table1 General geochemical characteristics of samples in this study.
3.2.WAXS analysis
Fig.2 displays WAXS spectrum of four samples where peaks with 2θof around 6˚and 27˚are observed in all samples.The peak with 2θof around 21˚exists in Sample 2 and 3 but missing in Sample 1 and 4.The former peak(2θ=27˚)is the graphene band(or 002 band),which is attributed to the stacks of the aromatic molecules(Tong et al.,2011;Koch and Christiansen,1993)and 6˚,12˚,16˚,21˚peaks all represent the n-alkanes(Di Giambattista et al.,2015;AlHumaidan et al.,2015;Espeau et al.,1997;Chevallier et al.,1999).Even though 6˚and 27˚peaks are detected in all samples,the difference in the peak intensity and width indicates that these four isolated kerogens have different organic compositions.For example,Sample 4 has higher maturity level than Sample 3,however,the intensity of the 27˚peak of the Sample3 is higher than Sample 4,which could be caused by the difference by the organic matter itself.Our previous study revealed that the main minerals existing in the Bakken shale are quartz,clay(mainly illite),feldspar,dolomite and pyrite(Liu et al.,2018a,b).Based on Crystallography Open Database,each mineral has its own typical major peaks.For example,the main peaks for the illite are 2θ=9˚and 24˚,the main peak for dolomite is 2θ=30.8˚,the main peak for the quartz is 2θ=26.6˚,and the main peak for pyrite is 2θ=33.04˚.However,these peaks are not detected in Fig.2,indicating that these minerals have been removed completely during the extraction process and these isolated kerogens samples have high purity and free of inorganics.

Fig.1.Schematic of the SAXS experiment(modified from Kikhney and Svergun,2015).
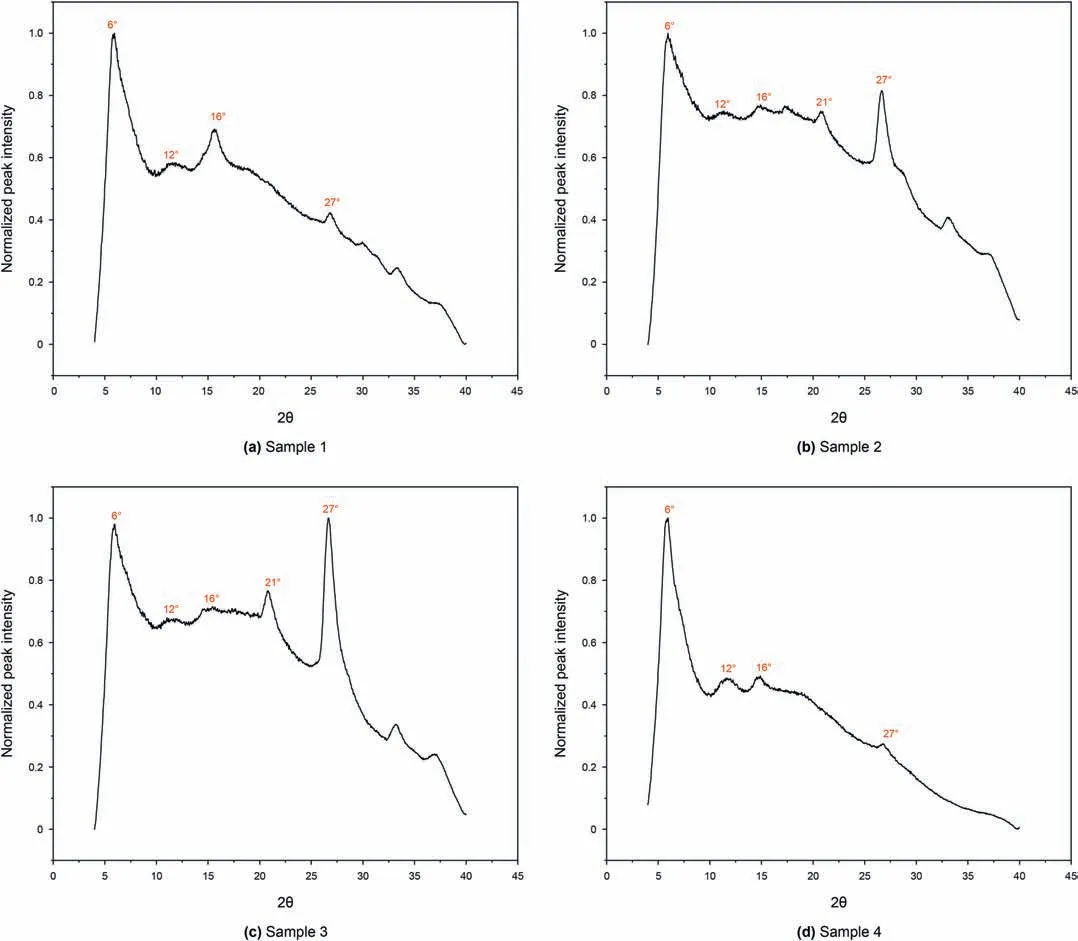
Fig.2.WAXS spectrum of four isolated kerogens(y-axis is the normalized intensity,the peaks around 6˚,12˚,16˚,21˚peaks represent the n-alkanes while the peak around 27˚ denotes the aromatic molecules).
3.3.SAXS analysis
Based on the Fourier transformation of the SAXS results,we derived the 1D profile reciprocal data which can be used to represent the 3D structure.The relationship between Iqand q(1D profile)in a double logarithmic plot for the isolated kerogen samples can be seen in Fig.3 while all samples exhibit similar patterns.It is found that Iqdecreases as q increases.The linear relationship between the Iqand q in the double log format describes their power law relation.For smaller q values,the scattering is mainly referred to the interparticle interferences based on the Guinier Law(Boldon et al.,2015).On the other hand,as q increases,the scattering can reflect the information of intraparticle interferences and follows the interface interference phenomenon(Boldon et al.,2015).

Fig.3.Relationship between Iq and q of four isolated kerogens.
3.3.1.Guinier plot analysis
Guinier method which was developed in the 1930s(Guinier,1939)is the most prominent approach which enables researchers to extract forward scattering intensity and gyration radius of the particles based on the following equation(Mertens and Svergun,2010):

where Rgis the radius of gyration of a composite material,here the kerogen,which is the root mean square distance of various components of the material from the center of the gravity of that material,and I0is called forward scattering which can be used to estimate the kerogen molecular weight(Beaucage and Schaefer,1994).
Based on Eq.(7),I0and Rgcan be extracted from the y-axis intercept and the slope of the linear region of a Guinier plot(lnIqvs.q2).Fig.4 shows the Guinier analysis of the samples in this study.When the value of q is very small,the curve deviates from linearity which is due to the presence of attractive or repulsive inter-particle forces or the sample polydispersity(Mertens and Svergun,2010).As q2increases further,the lnIqdecreases linearly while this portion of the curve can be used in the Guinier analysis.When fitting the Guinier plot,it's important to note that the linear portion of the data,q,should fit the requirement of Rg×qmax<1.3.Fig.5 depicts that Rgvalues of four isolated kerogens are very close to one another and are around 90Å.Zheng and Price(2012)applied the diffusion method to study the hydrodynamic radius of the dissolved organic matter in the sea water.The organic matter in their study was rich in aliphatic compounds and the radius was around 37Å.This hydrodynamic radius value is in the same order of magnitude of our isolated kerogen samples that are studied here.This was the only published literature that was found where the studied substance was the most similar to ours to verify our results.
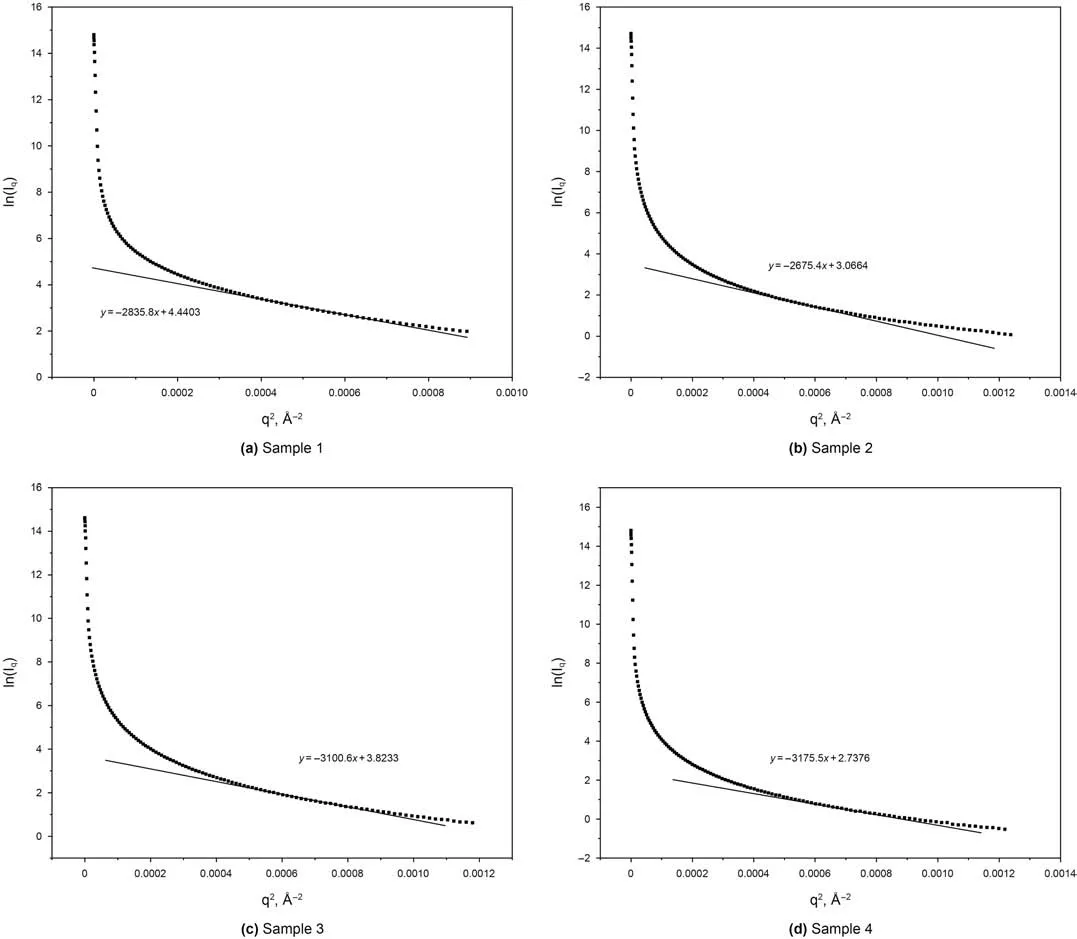
Fig.4.Guinier analysis of Samples.
3.3.2.Kratky plot analysis
Kratky plot,a plot of q2Iqvs.q,can qualitatively assess the flexibility and/or degree of unfolding in the material.Unfolded(highly flexible)polymer should have a plateau in the Kratky plot at higher q values.In this regard,a compact,globular polymer will have a bell-shaped(Gaussian)peak.A partially unfolded(flexible)polymer will have a combination of the bell-shape and plateau,or a plateau that slowly decays to zero(Nielsen et al.,2009;Mertens et al.,2010).The Kratky plots of all isolated kerogens in Fig.6 exhibit a bell-shape(Gaussian peak)format,meaning that the macromolecules of these isolated kerogens are in the compact mode(i.e.folded)(Nielsen et al.,2009;Mertens et al.,2010).As thermal maturity advances,the aliphatic functional groups are broken from the kerogen macrostructure due to the cleavage of the carbon-carbon bond in the aliphatic chains(Craddock et al.,2015).Lee et al.(2020)utilized MALDI-TOF-MS to study the molecular weight variations of the same kerogen samples of this study.They found that the immature samples(Sample 1,2 and 3)have more signals under 1 kDa range(smaller molecular weight)while Sample 4 which is in the higher maturity stages contain peaks between 1 and 2 kDa(larger molecular weight)due to the loss of the aliphatic chains during the thermal progression.Albeit,in their study,they were not able to compare the exact molecular weight of the organic matter samples,because the results only represented the probability distribution of various existing molecular compounds.Porod invariant Q,the integral of the area under the Kratky curve,is proportional to the molecular mass of the substance(Di Stasio et al.,2006).By calculating the Q value,the molecular mass of these 4 samples can be compared.The Q values for all four samples in Fig.7 demonstrate that Sample 1-3 are in the similar range,while Sample 4 with the highest maturity has a smaller Q value,showing smaller molecular mass.
3.3.3.Fractal analysis
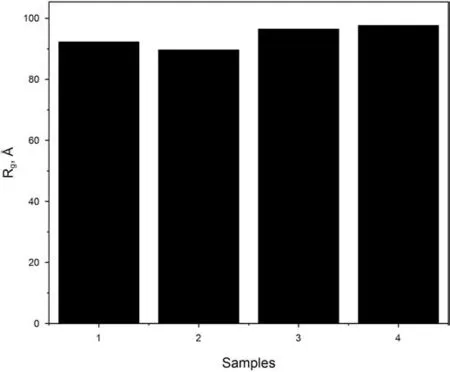
Fig.5.Summary of the Rg of the samples.
Fractals,as an important tool that have been used in different fields of physical sciences can reveal additional information about the microstructures of a material(Avnir,1989).In SAXS analysis,two sets of fractals usually can be considered:surface fractal dimension and the mass fractal dimension(Schmidt,1991;Lee et al.,2014).The following expression is used to calculate fractal dimensions of our data(Schmidt,1991):

where C is a constant,r is a function defining gamma,and D is fractal dimension.It should be noted that D equal to 2 indicates a smooth and planar surface,2<D<3 denotes a rough surface and D>3 depicts the mass fractal(Schmidt,1991).Based on Eq.(8),we plotted the curves and then calculated D values which was estimated between 2 and 3(Fig.8)in all samples,demonstrating that the surface of the isolated kerogen is not smooth.Furthermore,Sample 4 has a higher D than other three samples while Sample 3 exhibited with the lowest fractal dimension.
3.3.4.Pore structure analysis
The porosity and the surface area of four isolated kerogens can be seen in Table 2.The data illustrates that the porosity of these four isolate kerogens is between 0.08%(Sample 4)and 0.30%(Sample 1)and the surface area varies from 2065 cm2/cm3(Sample 4)to 9096.30 cm2/cm3(Sample 1).Sample 4 with the highest maturity(oil window)has the lowest porosity and surface area,which could be due to decreasing of the alkyl chain length and the condensation of the aliphatic carbon into the aromatic rings(Kelemen et al.,2007;Lee et al.,2020).Khatibi et al.(2019)applied 2D NMR to study the geochemical properties of the organic matter in the Bakken Shale.They found that as the maturity increases,the T1/T2ratio increases.This variation happens since the protons in the organic matter are becoming more immobile with the increasing maturity arising from the compaction of the organic matter.Additionally,we previously applied SANS method to study the pore structures of bulk shale samples(Liu et al.,2019).Considering the results that was reported in that study,the total porosity(including the connected and isolated pores)of the Bakken bulk shale sample(organic matter and mineral matrix combined)with a similar maturity(0.6-0.7%)and kerogen type(kerogen type II)has been measured around 0.9%(Liu et al.,2019).In this study,the average porosity(including the connected and isolated pores)of the isolated kerogen is around 0.25%,which is around 30% of the total porosity,indicating that the kerogen-hosted pore plays an important role in the entire pore structures of shale rock.

Table2 Summary of the pore structure information.
The pore size distributions of four isolated kerogens can be seen in Fig.9.Two main peaks can be recognized in all of these four samples with one peak less than 40Åand the other one larger than 1000Å.Besides,there are other peaks centered around 110Åin these four kerogen samples too.Sample 1 with the lowest maturity has the largest peak intensity around 110Å,while Sample 4 with the highest maturity has the smallest peak intensity.Fig.10 represents the TEM images of Sample 1 and Sample 2 under different magnifications.The images explain that the organic matter of Sample 1 and Sample 2 have abundant pores.However,the pore structures of these two samples are quite different.The pores with size of around 20 nm are abundant in Sample 1 while such pore sizes are very limited in numbers in Sample 2.The pore size distribution of Sample 1 is more homogeneous compared to Sample 2 which agrees with the results that was presented in Fig.9.
4.Discussions and future research directions
One important and debating discussion,when the goal is to solely study the organic matter properties,raises during the process of organic matter extraction.Particularly,the impact of using organic solvents during this process which has been commonly employed by many researchers.Melnichenko(2016)used the dichloromethane to wash the Posidonia Shale samples and found that after the dissolution of the organic matter,the porosity and permeability has been increased.Moreover,DiStefano et al.(2016)applied organic solvents to dissolve the organic matter of the Eagle Ford and Marcellus shale samples and then applied the SANS method to compare the pore structures prior to and after the extraction process.They observed that the porosity would get altered after the extraction is done.They speculated that the changes in porosity could be due to either the breakdown of the organic matter(complete or partially)or the interactions between the minerals and the organic solvents(i.e.,the clay swelling).In this study,we extracted the organic matter by dissolution of all other minerals.The dissolution of the minerals could create additional space,as illustrated,thus artificially increase pore spaces which should not be neglected.In other studies,the SEM images that have been captured from the solid organic matter from the Bakken,has revealed the organic matter is isolated among the minerals and not mixed with them.For instance,Liu et al.(2018a,b)analyzed the pore structures of the Bakken via imaging methods and came to a similar conclusion for samples that are in the early oil window up to the peak oil window.They found that the organic matter in these samples are separated from the minerals for the most part and very minimally mixed only with clay minerals.Xu et al.(2017)investigated the pore structures of the Bakken shale samples which were in the gas window and explained that the organic matter is not mixed with minerals even at that higher levels of maturity.Overall,the effect of the dissolution of the minerals on the Bakken samples is expected to be miniscule.It's important to note that although we tried to cover a good range of thermal maturities in this study,only a limited number of(four)samples representing the immature to the oil window have been analyzed.Based on the availability of 4 samples,authors believe a good understanding from the organic matter of the Bakken shale has been obtained.However,additional samples with different maturities,from the Bakken and other shale plays are required if we want to make robust conclusions about the organic matter and the effects of thermal maturity on the pore structures,which is the goal of our future research endeavors.
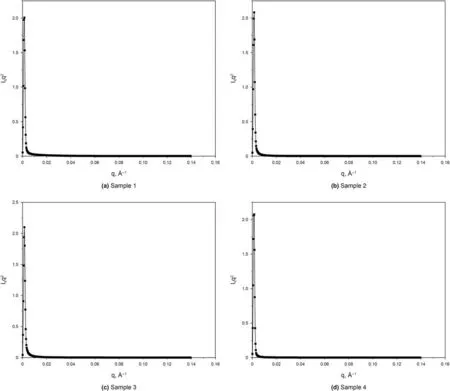
Fig.6.Kratky plot of all the samples.
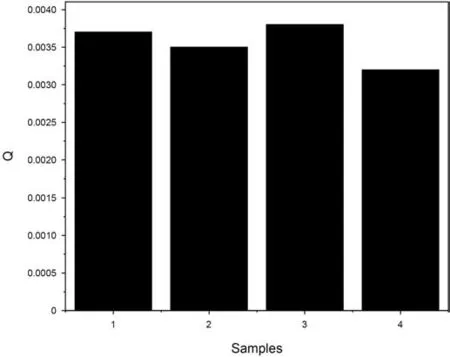
Fig.7.The calculated Q values of the samples.
5.Conclusions
In this study,we picked four Bakken shale samples and analyzed the extracted organic matter through SAXS and WAXS methods,and the following conclusions are made:
1.Four samples of this study were at various levels of thermal maturity.Sample 1 is immature while Sample 4 is in the peak oil window.The peaks from the isolated organic matter from the WAXS spectrum indicate that the minerals have been removed completely.Moreover,the difference in the intensity of the peaks specify that these four isolated organic matter specimens have different chemical compositions.
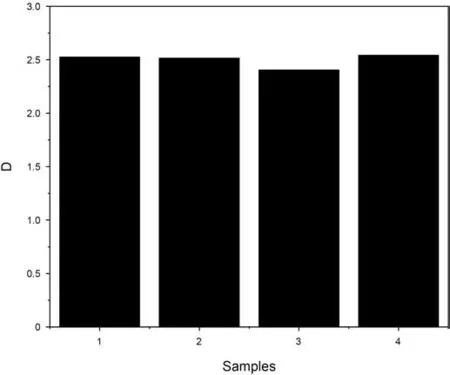
Fig.8.Fractal analysis of isolated kerogens.
2.All these four isolated organic matters have similar Rgvalues,around 90Åand these isolated kerogens are molecularly compact.Sample 4 exhibits the smallest Porod invariant value compared to other three samples,meaning that this specific sample has the smallest molecular mass.Based on the fractal analysis,Sample 4 showed the highest D value compared to other three samples while Sample 3 the lowest fractal dimension.3.The porosity of these isolated kerogens varies from 0.08% to 0.30%with Sample 4 owing the lowest porosity and surface area.Ultimately,these isolated organic matter specimens are found to have similar pore peak locations(one peak less than 40Åand the other one larger than 1000Å)which is independent of their maturity.4.Even these four organic matters have the same type(type II)of kerogen based on the rock-eval analysis,the detailed study of the isolated organic matter shows that these organic matters still have different properties including the compositions,molecular weight,fractal dimension and pore structures.This can originate from the existence of various macerals of different biogenic origins that could have been mixed during the extraction process.Thus,the study of specific macerals separately can allow us to understand the shale properties(i.e.,pore structures)more deeply which needs to done to in the future studies.
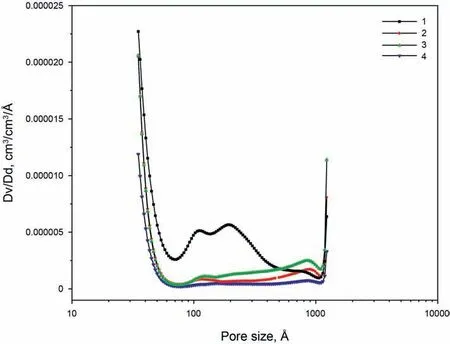
Fig.9.The pore size distribution of the isolated kerogens.
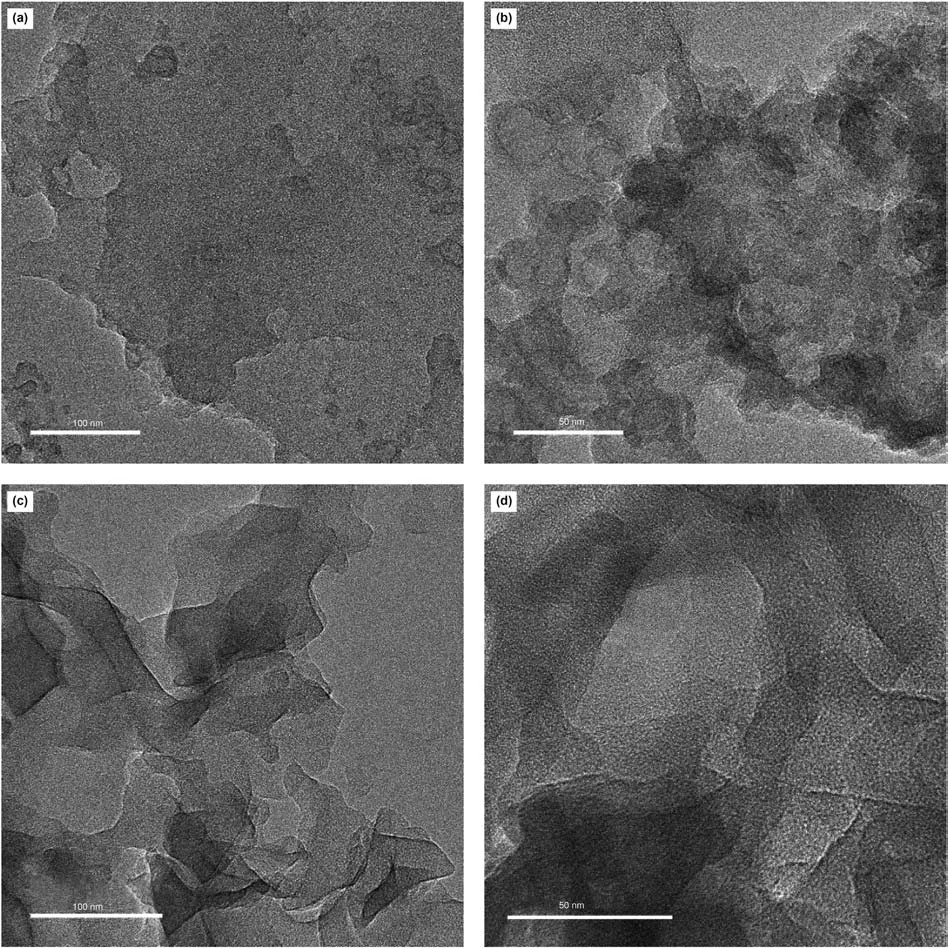
Fig.10.The TEM images of Sample 1 and Sample 2(a and b belong to Sample 1 while c and d belong to Sample 2).
Acknowledgement
The authors would like to thank the North Dakota Core Library,Jeff Bader who is the manager and senior geologist of the state and Kent Holland,the technician of the library who kindly collaborated with us in the project for sharing the samples with our team.
- Petroleum Science的其它文章
- Sedimentary characteristics and implications for hydrocarbon exploration in a retrograding shallow-water delta:An example from the fourth member of the Cretaceous Quantou Formation in the Sanzhao depression,Songliao Basin,NE China
- Study of the gas sources of the Ordovician gas reservoir in the Central-Eastern Ordos Basin
- A novel hybrid thermodynamic model for pore size distribution characterisation for shale
- Investigation of oil and water migrations in lacustrine oil shales using 20 MHz 2D NMR relaxometry techniques
- Fast least-squares prestack time migration via accelerating the explicit calculation of Hessian matrix with dip-angle Fresnel zone
- Nonlinear amplitude inversion using a hybrid quantum genetic algorithm and the exact zoeppritz equation

