Fast least-squares prestack time migration via accelerating the explicit calculation of Hessian matrix with dip-angle Fresnel zone
Bo-Wu Jian ,Jian-Jie Zhan ,Hao Zhan ,Wen-Kai Lu b,c,d,e,*
a College of Mechanical and Electrical Engineering,Beijing University of Chemical Technology,Beijing,100029,China
b The Institute for Artificial Intelligence(THUAI),Beijing,100084,China
c State Key Laboratory of Intelligent Technology and Systems,Beijing,100084,China
d Beijing National Research Center for Information Science and Technology(BNRist),Beijing,100084,China
e The Department of Automation,Tsinghua University,Beijing,100084,China
f Key Laboratory of Petroleum Resource Research,Institute of Geology and Geophysics,Chinese Academy of Sciences,Beijing,100029,China
g Institute of Geomechanics,Chinese Academy of Geological Sciences,Beijing,100081,China
Keywords:
ABSTRACT
1.Introduction
Reservoir characterization increasingly relies on prestack information gained from seismic data.Lithology and fluid prediction based on amplitude-versus-offset(AVO)analysis is often limited to low-quality common image gathers(CIGs).This is because migration remains an adjoint operator rather than the inverse operator of the forward modeling(Claerbout,1992).In the field applications,the resulting CIGs suffer from acquisition footprint and distorted amplitudes due to the poor source-receiver sampling,limited acquisition aperture and complex overburden.Least squares migration(LSM)serves as an effective tool to approximate the inverse operator(Lailly and Bednar,1983;Tarantola,1984),promising high-quality CIGs.
Since being proposed,LSM has gained much attention from Kirchhoff migration(Schuster,1993;Nemeth et al.,1999),one-way migration(Kaplan et al.,2010;Huang and Schuster,2012)to reverse time migration(Dai et al.,2011,2013;Dutta and Schuster,2014;Tan and Huang,2014;Liu et al.,2016;Li et al.,2017;Liu and Peter,2018).Dueto high computational burden,LSM is confined to how to improve the stacked images rather than the migrated gathers.In pioneering works(Duquet et al.,2000;Kühl and Sacchi,2003;Clapp et al.,2005;Valenciano et al.,2009),regularization on the migrated gathers can make the inversion stable and further reduce sampling artifacts.
The high computational burden in the LSM originates from the Hessian matrix,which denotes the second derivatives of the error functional with respect to the model parameters.For data-domain LSM,it doesn't need to calculate the Hessian matrix,but Hessian matrix determines the convergence rate.For image-domain LSM,it directly implements the explicit Hessian matrix,which lies on the square number of the elements in the image space(Plessix and Mulder,2004).For any column of Hessian matrix,namely point spread function(PSF)(Schuster and Hu,2000;Lecomte,2008),it physically describes the migrated results at the image space for the scattering point,which takes into account all effects including acquisition geometry,velocity model,and source wavelet.Thus,under the assumption of true migration velocity and known source wavelet,the explicit computation of Hessian matrix generally requires three-level nested loops(Valenciano et al.2006,2009;Tang,2009),i.e.,image-point loop,scattering-point loop,and data-space loop.The first two depend on the size of image space,and the last depends on the number of seismic traces in the acquisition geometry.
Jiang and Zhang(2019)propose the blockwise least-squares(BLS)implementation of prestack time migration(PSTM),where the migrated common-offset sections are divided into a series of blocks related to the explicit offset-dependent Hessian matrix and then the inverse filtering is applied iteratively to invert the corresponding reflectivity.A blockwise implementation is adopted to reduce the size of image space,resulting in a drastically reduced size of Hessian matrix.However,the next main challenge of this method resides in massive seismic traces.Generally,a few hundred thousand to a few hundred million traces normally are collected during a 3D seismic survey.However,for a certain imaging point,contributing traces remain a small part of total traces,especially for a shallow part.
The contributing traces for a certain imaging point are determined by the interface Fresnel zone,which is defined as the intersection of the Fresnel volume with a reflector and represents the spatial resolving power of seismic imaging system(Kravtsov and Orlov,1990).The projected Fresnel zone(PFZ)denotes the region at the acquisition surface which pertains to interface Fresnel zone(Hubral et al.,1993;Schleicher et al.,1997).For a certain imaging point,the major reflection energy stems from the contributing traces of the PFZ.The overlying velocity,the frequency band of the seismic data,and the dip of the reflector affect the size of the Fresnel zone(Zhang et al.,2016).It is a challenging task to determine a proper Fresnel zones.The dip-angle common image gather(Audebert et al.,2002;Landa et al.,2008;Klokov and Fomel,2013;Li et al.,2020)facilitates the estimation of fresnel zone.For conventional migration methods,many authors have introduced the Fresnel zone(i.e.optimal migration aperture)to eliminate migration artifacts and reduce the computational cost(Schleicher et al.,1997;Chen,2004;Klokov and Fomel,2013;Zhang et al.,2016).As in Zhang et al.(2016),which estimates the dip-angle Fresnel zone(DFZ)to accelerate deabsorption PSTM,we can also reduce the size of dataspace loop via only adopting the contributing traces instead of the whole traces for a certain imaging point.In this work,we propose the fast BLS-PSTM via accelerating the explicit numerical computation of the Hessian matrix with DFZ.Specifically,our acceleration method includes two steps.First,from DFZ,we give an explicit formula of upper bound for PFZ at any imaging point to reduce the size of data-space loop before calculating the Hessian matrix.Then,we determine whether a seismic trace contributes to the imaging point via DFZ during calculating the Hessian matrix.Thus,we only need to loop through the contributing traces instead of all traces to accelerating the explicit numerical computation of the Hessian matrix.
We arrange the paper as follows.First,we briefly outline the theory of BLS-PSTM(Jiang and Zhang,2019)and provide the computational cost analysis.Then,based on the theory of DFZ(Zhang et al.,2016),we derive the explicit formula of upper bound for PFZ at any imaging point and give a detail workflow of the proposed fast BLS-PSTM.Finally,numerical tests on synthetic and field data validate the distinct speedup with higher-quality CIGs compared to BLS-PSTM.
2.Review of blockwise least squares prestack time migration
BLS-PSTM comprises two parts:the explicit numerical computation of the offset-dependent Hessian matrix and the following iterative inverse filtering.In this section,we mainly review the explicit formula of offset-dependent Hessian matrix and illustrates the computational cost of explicit Hessian matrix.For the part of iterative inverse filtering,please refer to Jiang and Zhang(2019).The theory of BLS-PSTM is limited to the 2D case for simplified discussions;extensions to 3D case are a topic for future research.We derive the explicit formula of the 2D offset-dependent Hessian matrix by cascading the forward modeling and migration.Consider a commonoffset configuration,where xmdenotes the X coordinate of midpoint and h denotes the half offset.Recorded common-offset reflection data in the frequency domain,~d(xm,h,ω),can be explicitly summarized:

where xq,xm-h,xm+h denote the X coordinates of scattering point,shot and receiver,respectively;r(xq,h)is the offsetdependent reflectivity at the scattering point xq;G+(xm-h,xq;ω)and G+(xq,xm+h;ω)represent the forward-propagated Green's function from the shot to the scattering point and from the scattering point to the receiver point;and s(ω)represents the source wavelet.Equation(1)can be compactly represented in matrixvector notations,as d=Lr.
As in Zhang and Zhang(2014),deconvolution imaging condition used in PSTM yields

where m(xp,h)denotes the prestack migrated result at the imaging point xp;G+(xm-h,xp,ω)represents the forward-propagated Green's function from the shot to the imaging point,and G-(xm+h,xp,ω)represents the backward-propagated Green's function from the receiver to the imaging point.Here,Ω(xp,h)represents the optimal migration aperture determined by dipangle Fresnel zone(Zhang et al.,2016).Equation(2)can also be compactly represented in matrix-vector notations,as m=L†d,where L†represents the migration operator(Jiang and Zhang,2019).

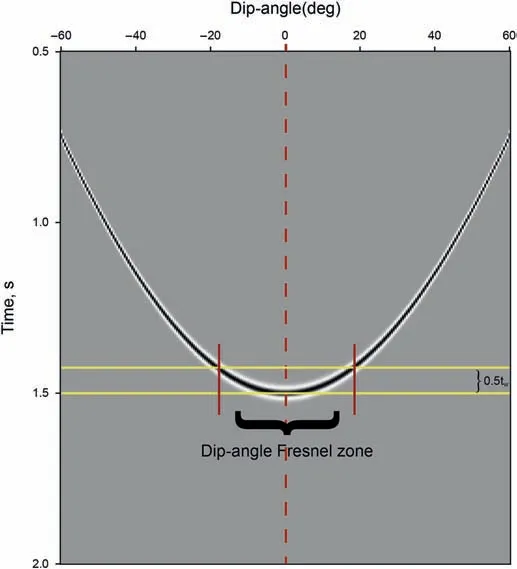
Fig.1.Dip-angle migrated gather of a horizontal layer model.0∙5tw denotes the half period.We find that migrated event exhibits concave shape and the apex of the curve is 0˚corresponding to the dip angle of the horizontal reflector,as indicated by the red line.
By substituting Equation(1)into Equation(2)and changing the order of integration,we have where fcis the upper cutoff frequency.A compact representation of Equation(3)is m=L†Lr,where the kernel,L†L=H,is the offsetdependent Hessian matrix.The explicit form reads Here,the superscript±represents the forward-propagated or backward-propagated Green's function.Substituting Equation(5)into Equation(4),we have
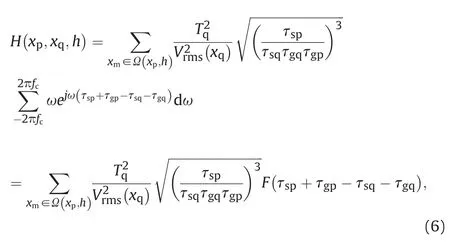
where F(τ)reads

For a certain scattering point xq,an element of Hessian matrix,H(xp,xq,h),denotes the response of the seismic imaging system at the imaging point xp.
It is not feasible to compute a total Hessian matrix via Equation(6)in practice because of its size.We adopt a blockwise implementation(Jiang and Zhang,2019),where a migrated COS is partitioned into a series of blocks related to the explicit offsetdependent Hessian matrix.To eliminate boundary effects originating from a direct partitioning,we apply a reflector-oriented localized approach to modify the blockwise Hessian matrix.Thus,we use a series of computationally tractable small-sized Hessian matrices to optimize the migrated COS via iterative inverse filtering,which is solved by split Bregman algorithm(Goldstein and Osher,2009)with total-variation regularization.

Note that the Hessian matrix in Equation(4)only needs the upper cutoff frequency fcinstead of the source wavelet s(ω)resulting from the deconvolution imaging condition.Thus,explicit formula of Hessian matrix in Equation(4)avoids the challenging task of estimating the source wavelet,but can not improve the time resolution(Jiang and Zhang,2019).
In PSTM(Zhang and Zhang,2014),we write the Green's function explicitly as

where i is the imaginary unit,τand T is the travel-time and the oneway vertical travel-time from the x in the subsurface to the xAin the acquisition surface and Vrmsis the root mean square(rms)velocity.
3.Dip-angle Fresnel zone and the corresponding projected Fresnel zone
The Fresnel zone is jointly determined by the overlaid velocity,frequency band of seismic data and the reflector dip.Therefore,it is a challenging task to find an appropriate Fresnel zone.Zhang et al.(2016)estimated the Fresnel zone in dip-angle gathers,where the reflection event obtained by migration exhibits concave shape and the apex of the curve corresponds to the dip angle of the reflector as shown in Fig.1.Here,we provide a simple derivation of the generation of dip-angle gathers via PSTM for 2D case in accordance with Zhang et al.(2016)in Appendix A.In the view of the stationary phase theory,the apex is the stationary point and the local flat part around the apex is the Fresnel zone.In detail,Fresnel zone is located at the region,where the vertical travel-time difference between migrated event and the apex in the dip-angle gathers is less to a half period,as denoted by 0∙5twin Fig.1.Hence,we can simply determine the Fresnel zone in the dip-angle gather,termed as dip-angle Fresnel zone(DFZ).In reality,it is difficult to directly estimate the Fresnel zones for the field data due to the lower signalto-noise ratio(SNR).Zhang et al.(2016)propose a scheme for the automated estimation of the Fresnel zones from the migrated dipangle gathers.Sun et al.(2019)investigates the application of DNNs for identifying the lower and upper limits of the Fresnel zone in the dip-angle gathers automatically.

Fig.2.Illustration of the relationship of the DFZ and the PFZ for a certain imaging point,I.φ-andφ+denote the lower and upper limits of the imaging dip of point I namely the DFZ.PFZ of point I is denoted as the yellow part of X axis between the green and red points,where the imaging dip,φ,determined by the shot,the geophone and the imaging point lies in the DFZ,namelyφ-≤φ≤φ+.
By introducing DFZ to explicit numerical computation of the Hessian matrix,we first give the corresponding computational cost analysis.Suppose that the ratio of the number of contributing traces to the number of all traces is Ra.If a seismic trace contributes to the migrated results,the corresponding imaging dip determined by Equation(A-10)will lie in the DFZ,which needs to calculate traveltime for 2 times.Hence,the computational cost of the Hessian matrix with DFZ is(4Ra·ntr·n2x·n2z+2ntr)·tt.For massive seismic traces in the field data,it is also expensive.
3.1.Derivation of upper bound for projected Fresnel zone in the zero-offset case
Hence,in this part,an explicit formula of upper bound for projected Fresnel zone(PFZ)is derived to avoid looping through all traces and bring a reduced storage requirement for the coordinates of shot and receiver locations for all traces.Suppose a commonoffset configuration in Fig.2,where h denotes the half offset,and xs,xmand xgdenotes the X coordinates of shot S,midpoint M and receiver G,respectively.The imaging point I is at(x,T).Point O has the same X coordinates as imaging point I.Setand we rewrite the X coordinates of shot and receiver as

Substituting Equation(8)into Equation(A-10),we have

whereτsandτgrepresent the travel-time between the shot(receiver)and the imaging point,respectively;andφxrepresents the imaging dip at I.φxwill be positive if right inclined,otherwise negative.Note that if we exchange the location of shot and the location of receiver,the corresponding imaging dip doesn't change.
Firstly,we consider a simple zero-offset case.Now,Equation(9)can be simplified to

Suppose that the seismic trace contributes to the imaging point I,and there exists following relationship:
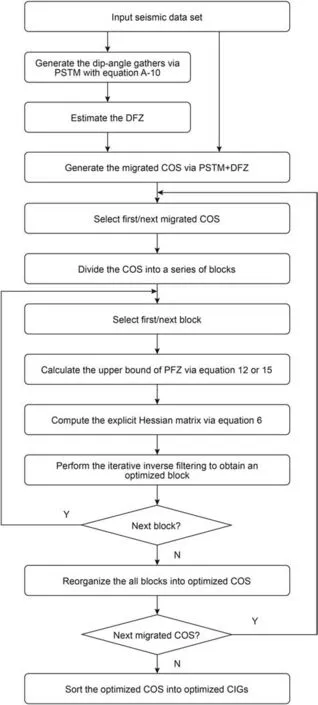
Fig.3.Workflow chart for the proposed method.

whereφ-andφ+denotes the upper and lower limits of DFZ,respectively.Substituting Equation(8)into Equation(11),we have

where d=VrmsT denotes the depth of imaging point.Equation(12)gives an explicit formula of the zero-offset PFZ,which depends on the dip-angle Fresnel zone,depth and lateral coordinate of imaging point.
3.2.Derivation of upper bound for projected Fresnel zone in the finite-offset case
Next,we consider a finite-offset case.In the same way,there exists following relationship:

Also,we substitute Equation(8)into Equation(13)and the finite-offset PFZ can be expressed as

Hence,determining whether the seismic trace belongs to PFZ via Equation(14)needs to compute theτsandτg,which has the same computational cost as determining whether the seismic trace belongs to DFZ via Equation(A-10).Notice that the length of the finite-offset PFZ is constant,which reads d(tanφ+-tanφ-).Hence,we simplify the Equation(14)to

The use of Equation(15)is easy,but it enlarges the range of PFZ for the finite-offset PFZ.In fact,we reduce the computational cost of Hessian matrix by using a two-stage process.First,we use the explicit formula of upper bound for PFZ(Equations(12)and(15))to reduce the size of data-space loop before calculating the Hessian matrix.Then,we can further determine whether a seismic trace contributes to the imaging point by using the dip-angle Fresnel zone during calculating the Hessian matrix.Because the upper limit of PFZ is determined by the DFZ,depth and lateral coordinate of imaging point.Migration methods are used to image the full picture of subsurface structure with a larger imaging depth.According to the Equation(15),a larger imaging depth means a larger PFZ radius.So the upper limit of PFZ plays a bit role of reducing cost of migration.Instead,in BLS-PSTM,we calculate the Hessian matrix in a blockwise manner and each column of Hessian matrix,namely point spread function(PSF),physically describes a scattering point's migrated results for a small block.Thus,for the block,especially a block in the shallow part,the contributing traces estimated by the upper limit of PFZ are a small part of all data traces.

Fig.4.Acquisition geometry with the nonuniform coverage for synthetic data.(a)displays the fold map(fold number vs.CDP)for the 300 m COS.(b)displays the number of seismic traces versus offset.
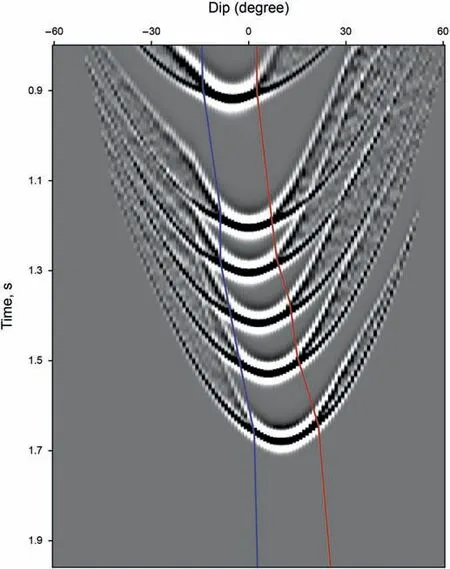
Fig.5.Dip-angle gather at CDP 200 in the synthetic example.Blue and red lines denote the lower and upper bounds of the dip-angle Fresnel zone.
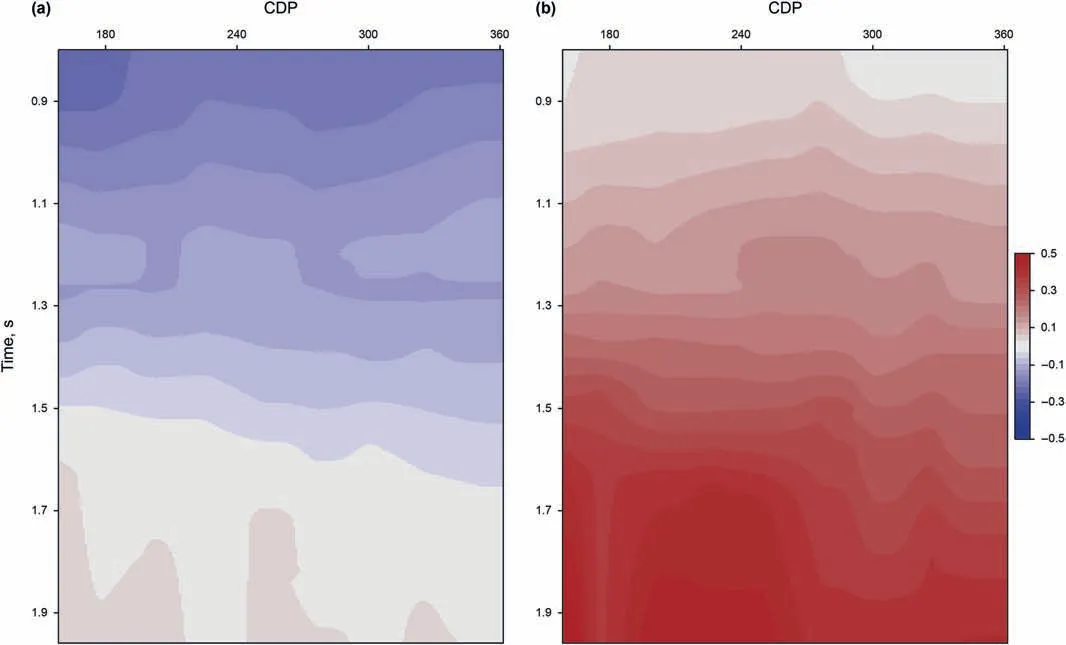
Fig.6.The lower and upper bounds of the dip-angle Fresnel zones are displayed in(a)and(b),respectively.Note that we display the tangent value of the dip angles.
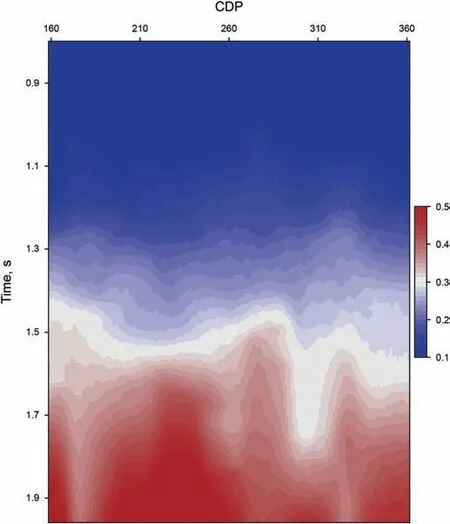
Fig.7.Ratio of the contributing traces and the whole seismic traces.We can see more contributing traces in the deeper part.
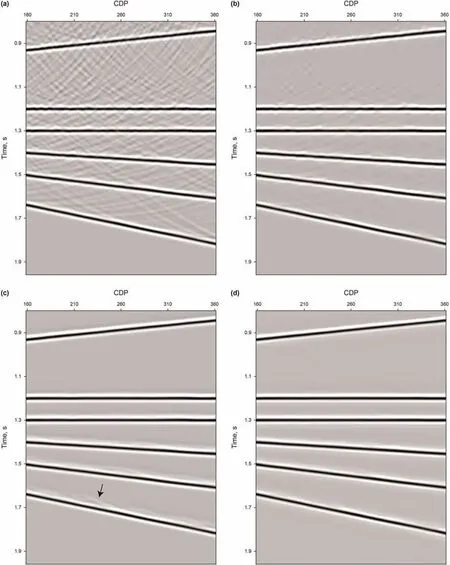
Fig.8.Comparison of common-offset sections with the offset around 300 m obtained by using(a)PSTM,(b)BLS-PSTM,(c)PSTM+DFZ,and(d)BLS-PSTM+DFZ,respectively.
Suppose that the ratio of the rough number of contributing traces via PFZ to the number of all traces is Rb,where Rbis slightly larger than Rawith a negligible computational cost.The corresponding computation cost of explicit Hessian matrix with twostage process is
As to memory requirement,a direct implementation of Equation(6)requires to store the Hessian matrix with the size of·,the velocity model with the size of nx·nz,and the lateral coordinates of shot and receiver location for all traces with the size of 2ntr.The total memory requirement is 4·+8ntr+4nx·nzbyte.Compared to the direct implementation of Equation(6),the explicit Hessian matrix with DFZ additionally needs to store the lower and the upper of DFZ with the total memory requirement of 4·+8ntr+12nx·nzbyte.Compared to the explicit Hessian matrix with DFZ,the explicit Hessian matrix with two-stage process only needs to store the contributing traces with the total memory requirement of 4·+8Rb·ntr+12nx·nzbyte.We summarize the computational cost and memory requirement among different methods in Table 1,which indicates that the explicit Hessian matrix with PFZ has less computational cost and memory requirement.As shown in the following synthetic and field data sets,Raand Rbrange from 0.1 to 0.5.Therefore,the proposed accelerating strategy has a drastically reduced runtime and memory requirement.

Table1 Comparison of the computational cost and memory requirement for the Hessian matrix among different methods.
Fig.3 shows the workflow chart for the resulting fast BLS-PSTM.First,we generate the dip-angle gathers via PSTM with Equation A-10 and estimated the DFZ.After that,we obtain the migrated common-offset sections(COS)via PSTM+DFZ.Then,each migrated COS is divided into a series of blocks related to the explicit offset-dependent Hessian matrix(Jiang and Zhang,2019).Thus,we can calculate the upper bound of the projected Fresnel zone via Equation(12)or 15 and compute the explicit Hessian matrix via Equation(6).An iterative inverse filtering(Jiang and Zhang,2019)is performed to obtain an optimized block.We reorganize these blocks into optimized COS and loop all migrated COS.Finally,the optimized CIGs can be obtained effectively by the proposed fast BLS-PSTM.
4.Numerical examples
In this section,we will use a synthetic data set and a field data set to demonstrate the performance of the fast BLS-PSTM.
4.1.Synthetic data
We first test our acceleration strategy on a simple synthetic data set,which is simulated by using the Kirchhoff 2D modelling method with analytical Green's functions,introduced in Haddon and Buchen(1981).The background velocity is set to 2.0 km/s.We use a 30 Hz Ricker wavelet to generate data set.Note that the coverage is nonuniform for synthetic examples.We display the fold map(fold number vs.CDP)for the 300 m COS in Fig.4(a)and the curve of number of traces versus offset in Fig.4(b).The synthetic data example consists of six layers.For simplicity,each layer has the same reflection coefficients and has the constant amplitudeversus-offset(AVO).
A typical dip-angle gathers is generated by following the Equation(A-10),as shown in Fig.5.As indicated by blue and red lines in Fig.5,we estimate the lower and upper limits of imaging dip,namely the dip-angle Fresnel zone(DFZ)at 10-CDP interval.Finally,we generate the whole dip-angle Fresnel zone via lateral and vertical interpolation.Fig.6(a)and(b)show the lower and upper limits(tanφ-and tanφ+in Equations(11)and(13))of the DFZ in the target imaging zone,respectively.Based on the estimated DFZ,we use the Equations(12)and(15)to determine the upper bound of PFZ for any imaging point.We use the upper bound of PFZ to determine the contributing traces.Fig.7 shows the ratio Rbof the number of contributing traces and the number of the whole seismic traces at the offset of 300 m.From the Equations(12)and(15),the length of PFZ is proportional to the depth of imaging point.Hence,we can see that there are more contributing traces in the deeper part.
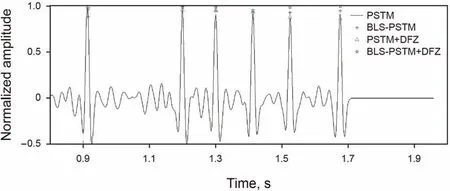
Fig.9.Comparison of normalized amplitudes of seismic trace at CDP 200 in Fig.8.In this example,amplitudes for the all reflector are set to 1.Pentagram denotes the amplitudes by BLS-PSTM+DFZ,which is more consistent with the ground truth.
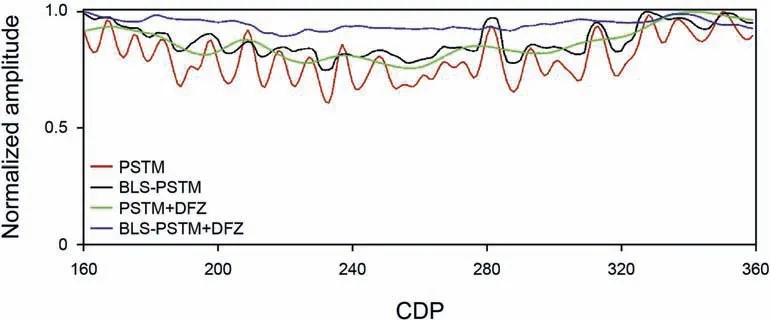
Fig.10.Comparison of normalized amplitudes along the reflector at 1.2 s in Fig.8.In this example,amplitude doesn't vary along the reflector.Blue line obtained by BLS-PSTM+DFZ is more consistent with the ground truth.
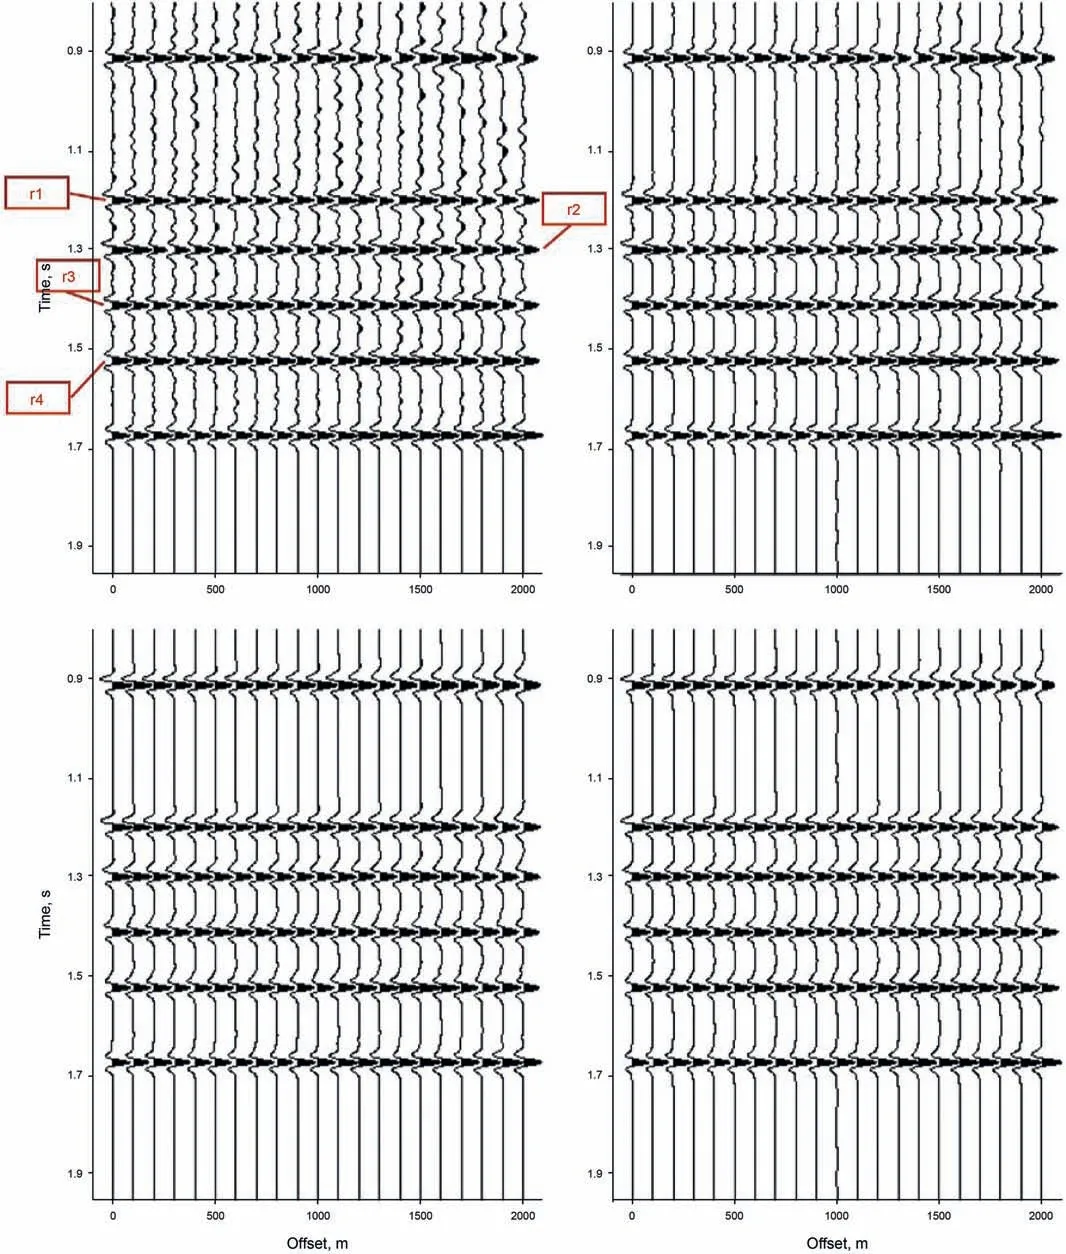
Fig.11.A typical CIG at CDP 200 obtained by(a)PSTM,(b)BLS-PSTM,(c)PSTM+DFZ,and(d)BLS-PSTM+DFZ,respectively.We display the AVO of r1,r2,r3,and r4 in Fig.12.
Fig.8 shows the common-offset sections(COS)with the offset around 300 m obtained by using(a)PSTM,(b)BLS-PSTM,(c)PSTM+DFZ,and(d)BLS-PSTM+DFZ,respectively.In the synthetic example,we divide the COS into a series of blocks with the size of 80×80.In comparison with Fig.8(a)and(b),we observe that BLSPSTM optimizes the traditional migrated result with most of the migration swings removed.The runtime of numerical Hessian matrix in BLS-PSTM is 380.62 s with the total 4472 traces.Compared to Fig.8(a)and(c)has less migration swings left as pointed by arrow due to the use of DFZ.We further improve the Fig.8(c)using the BLS-PSTM+DFZ as shown in Fig.8(d)with no migration swings left.The runtime of numerical Hessian matrix in BLS-PSTM+DFZ is 73.64 s with Rbshown in Fig.7 at a significantly reduced computational cost(more than five times faster).
As displayed in Fig.9,we provide a quantitative comparison of waveform at CDP 200 of Fig.8,where black line plots the blurred waveform in Fig.8(a),and blue mark‘+‘,green mark‘*’,and red pentagram represent the reflectivity picked from Fig.8(b),(c),and(d),respectively.Note that each of reflectors has the same reflection coefficient.Hence,deblurred results by BLS-PSTM+DFZ is more consistent with the ground truth.In Fig.10,we display the normalized amplitudes of the second reflectorat 1.2 s of Fig.8,where red,black,green,and blue lines represent the picked amplitudes of Fig.8(a),(b),(c),and(d),respectively.The reflector by BLSPSTM+DFZ has more consistent amplitudes with the ground truth.
Fig.11 shows the comparison of CIG at CDP 200 obtained by(a)PSTM,(b)BLS-PSTM,(c)PSTM+DFZ and(d)BLS-PSTM+DFZ,respectively.Compared to Fig.11(a)and(b-d)show less migration artifacts.We compare the AVO of r1,r2,r3,and r4 in Fig.12(a-d),respectively.In the synthetic example,amplitude does not vary with offset.In Fig.12,red,black,green and blue lines plot the AVO obtained by using PSTM,BLS-PSTM,PSTM+DFZ and BLSPSTM+DFZ,respectively.Deblurred AVO by BLS-PSTM+DFZ is more consistent with the ground truth.Thus,synthetic example demonstrates the validity of our fast BLS-PSTM method at a significantly reduced computational cost.
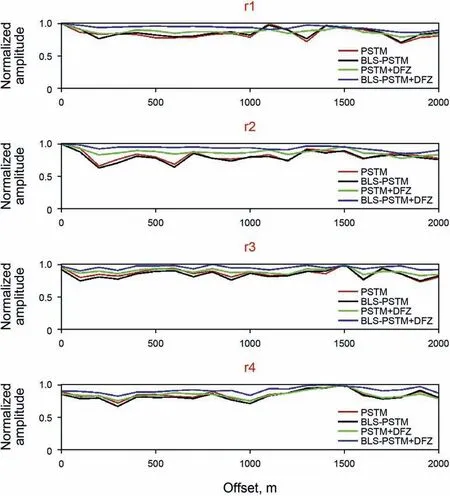
Fig.12.Quantitative comparison of AVO in Fig.11 for(a)r1,(b)r2,(c)r3,(d)r4,respectively.In this example,amplitude does not vary with offset.Blue lines obtained by BLSPSTM+DFZ are more consistent with the ground truth.
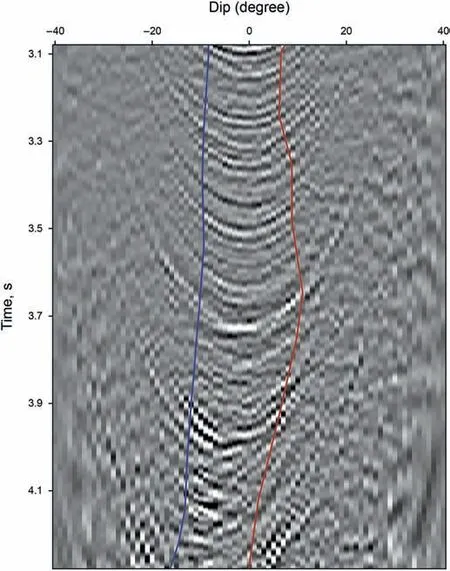
Fig.13.Dip-angle gather at CDP 1900 in the field example.Blue and red lines denote the lower and upper bounds of the dip-angle Fresnel zone.
4.2.Field data
We further test our acceleration strategy on a 2D field data set.The field data set is acquired by a single cable,containing 240 receiver groups spaced at 12.5 m.Offsets vary between 275 and 3263 m.There are 3560 shots with 25 m shot spacing in total.The record length is 8 s with a sample rate of 2 ms.We migrate the field data set on the common offset gather at 30 m interval.We set the imaging dip ranging within(-40˚,40˚).We use the Equation(A-10)to generate a dip-angle gather as shown in Fig.13.Here,blue line and red line denote the lower and upper limits of the DFZ,respectively.We estimate the DFZ at 10-CDP interval.Finally,we generate the whole dip-angle Fresnel zone via lateral and vertical interpolation.In Fig.14,we show the dip-angle gathers at CDP from 1890 to 1900 within the DFZ.A linear interpolation is adopted to determine the lower and upper bounds of the DFZ as denoted by blue and red lines.Fig.15(a)and(b)show the lower and upper limits(tanφ-and tanφ+in Equations(11)and(13))of the DFZ in the target imaging zone overlaid on migrated section,respectively.Usually,the dip of the strata varies smoothly and so are the lower and upper bounds of the dip-angle Fresnel zones.However,there are many faults in the target migrated section.So we extend the range of the dip-angle Fresnel zones to contain more diffracted energy and image the faults better.That is why the lower and upper bounds of the dip-angle Fresnel zones vary laterally so hard.Based on the Equations(12)and(15),we determine the upper bound of PFZ for any imaging point.Fig.16 shows the ratio Rbof the number of contributing traces and the number of the whole seismic traces.From the Equations(12)and(15),the upper bound of PFZ is proportional to the imaging point's depth.So we can see more contributing traces in the right part due to a higher velocity.
Fig.17 displays the comparison of stacked images obtained by using(a)PSTM,(b)BLS-PSTM,(c)PSTM+DFZ,and(d)BLSPSTM+DFZ,respectively.Fig.18 shows the enlarged detail of the white dashed box in Fig.17.To better show the migrated section,we display the images with the aspect ratio of 8:5 instead of the true aspect ratio of 5:1.Hence,the maximum imaging dip is clearly above 40˚.In Fig.13,we observe the noises outside the DFZ,which will generate the migration artifacts in the migrated sections as shown in Fig.17(a).Instead of traditional migration aperture,we only stack the dip-angle gathers within the DFZ,resulting in the migrated section with the enhanced SNR in Fig.17(c).Stacked sections of PSTM and PSTM+DFZ are separately optimized by BLSPSTM and BLS-PSTM+DFZ in Fig.17(b)and(d),respectively.LSPSTM+DFZ in Fig.17(d)achieves a high SNR and eliminates most of the migration artifacts.
With the help of the acceleration strategy,we can further generate the high-quality migrated gathers obtained by using BLSPSTM+DFZ.Single-offset images for the offset around 1200 m are shown in Fig.19,where(a),(b),(c)and(d)represent the COS obtained by PSTM,BLS-PSTM,PSTM+DFZ,and BLS-PSTM+DFZ,respectively.Fig.20 shows the enlarged detail of the white dashed box in Fig.19.Compared to Fig.19(a)and(b)by BLS-PSTM shows a more focused reflection and less migration artifacts.In the field example,we divide the COS into a series of blocks with the size of 60×60.The runtime of numerical Hessian matrix in BLS-PSTM is 84.93 s with the total 7120 traces in the offset group.For the noisy field dataset,determining the DFZ depends mainly on the experience.Here,we just use the automated estimation of the Fresnel zones from the migrated dip-angle gathers,introduced by Zhang et al.(2016).The corresponding COS by PSTM+DFZ is displayed in Fig.19(c).Compared to Fig.19(a),lots of migration swings are removed.We further perform BLS-PSTM+DFZ on the COS of PSTM+DFZ,as shown in Fig.19(d).Compared with Fig.19(c),remaining noises are much removed.The runtime of numerical Hessian matrix in BLS-PSTM+DFZ is 28.71 s with Rbshown in Fig.16 at a significantly reduced computational cost(almost three times faster).
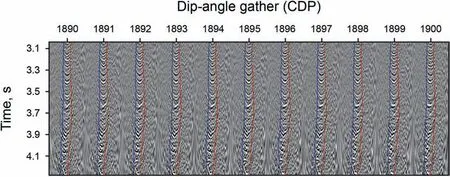
Fig.14.Dip-angle gathers at CDP from 1890 to 1900 within the DFZ.A linear interpolation is adopted to determine the lower and upper bounds of the DFZ as denoted by blue and red lines.

Fig.15.The lower(a)and the upper(b)bounds of the dip-angle Fresnel zones overlaid on migrated section.Note that we display the tangent value of the dip angles.

Fig.16.(a)Migration velocity.(b)Ratio of the contributing traces and the whole seismic traces.We can see more contributing traces in the right part due to the higher velocity.
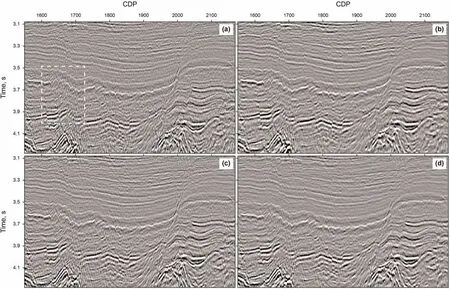
Fig.17.Comparison of stacked sections by superimposing the common-offset sections of(a)PSTM,(b)BLS-PSTM,(c)PSTM+DFZ,and(d)BLS-PSTM+DFZ,respectively.
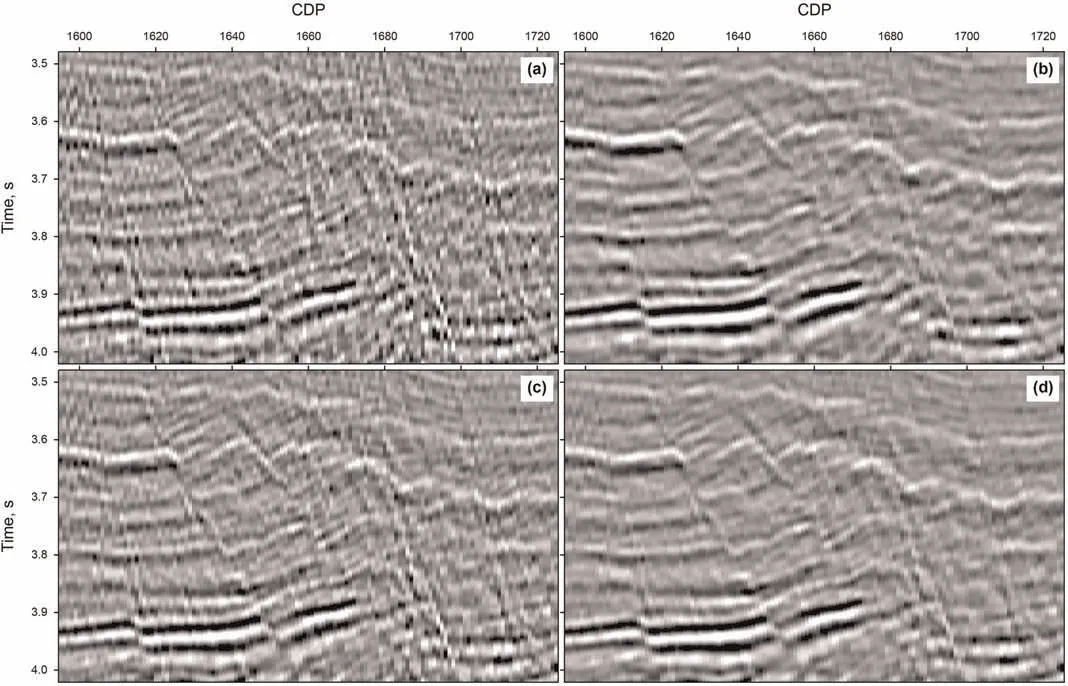
Fig.18.The enlarged detail of the box in Fig.17.
The corresponding CIG at CDP 1900 obtained by PSTM,BLSPSTM,PSTM+DFZ,and BLS-PSTM+DFZ are shown in Fig.21(a-d),respectively.It is noted that a trace at CDP 1900 of stacked image by PSTM in Fig.17(a)is seen as a reference trace with red and blue lobes.Compared to Fig.21(a-c),Fig.21(d)is more consistent with the reference trace.More importantly,we observe that event coherence is adopted and some weak events can be probed plainly as pointed by blue box in Fig.21(d).These make blockwise LS-PSTM results more open to interpretation,and potentially allow for AVO analysis.
5.Discussion
The calculation and storage of Hessian matrix is the heart of the image-domain least squares migration,whether it is based on the Kirchhoff migration,like PSTM and PSDM,or wave-equation migration,like reverse time migration(RTM).In this work,we focus on improving the computational efficiency of Hessian calculation.Our contribution is twofold.Firstly,dip-angle Fresnel zone(DFZ)is integrated with the Hessian calculation to improve the performance and reduce the computational cost of the BLSPSTM.Secondly,the upper limit of projected Fresnel zone(PFZ)is derived to reduce the computational cost of Hessian matrix further via looping through the contributing traces instead of the all data traces before calculating the Hessian matrix.
It is necessary to explain that DFZ has been used to reduce the migration noise,as in Klokov and Fomel(2013);Zhang et al.(2016);Liu and Zhang(2018);Liu(2019),whilst the upper limit of PFZ cannot reduce the cost of traditional migration methods.Because the upper limit of PFZ(Equations(12)and(15))is determined by the DFZ,depth and lateral coordinate of imaging point.Migration methods are used to image the full picture of subsurface structure with a larger imaging depth.According to the Equations(12)and(15),a larger imaging depth means a larger PFZ radius.Thus,almost all seismic traces are contained in the upper limit of PFZ.So,the upper limit of PFZ plays a bit role of reducing cost of migration.Instead,in BLS-PSTM,we calculate the Hessian matrix in a blockwise manner and each column of Hessian matrix,namely point spread function(PSF),physically describes a scattering point's migrated results for a small block.For the block,especially a shallow block,the contributing traces estimated by the upper limit of PFZ are a small part of all data traces.Hence,it is very helpful for the BLS-PSTM to only consider the contributing traces via the upper limit of PFZ.
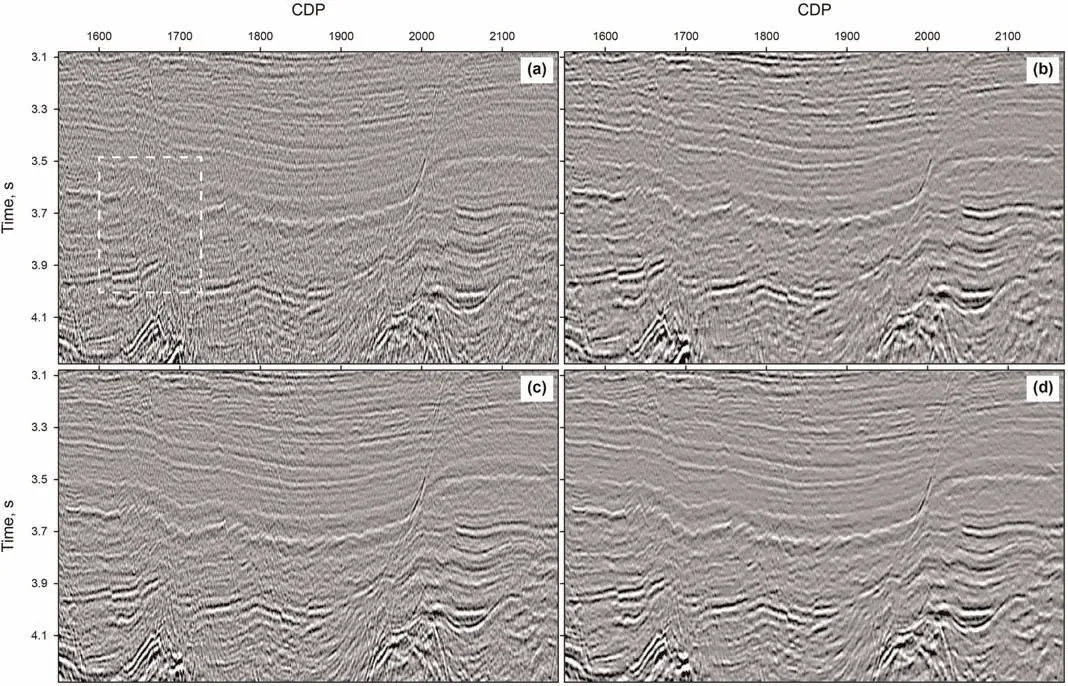
Fig.19.Comparison of common-offset sections with the offset around 810 m obtained by using(a)PSTM,(b)BLS-PSTM,(c)PSTM+DFZ,and(d)BLS-PSTM+DFZ,respectively.

Fig.20.The enlarged detail of the box in Fig.19.

Fig.21.A typical CIG at CDP 1900 obtained by(a)PSTM,(b)BLS-PSTM,(c)PSTM+DFZ,and(d)BLS-PSTM+DFZ,respectively.We select a reference trace with blue and red lobes at 1900 CDP of stacked section by PSTM in Fig.17(a).
In this work,we take the first steps in improving the performance and reducing the computational cost of LSM via DFZ,and in that sense proposing a new research direction.Whilst we only present methods for 2D time migration considering a laterally invariant or weakly variant medium,and we believe there are challenges to extending our methods to 3D and more heterogeneous medium based on our first steps.As discussed in Jiang and Zhang(2019),prestack depth migration(PSDM)or Gaussian beam migration(GBM)(Yang et al.,2015;Zhang et al.,2019)can be adopted to the proposed framework of BLS-PSTM,where we only need to calculate the traveltime and amplitude of Green's function via ray tracing.Also,the DFZ in depth domain is also discussed in Klokov and Fomel(2013).Therefore,it is necessary and feasible to extend the proposed method to the more heterogeneous media.As for the 3D case,the biggest issue we face is the 3D Hessian calculation and storage,especially for boundary effects due to a smaller size of block limited by the GPU memory.Another point of concern for the 3D complex medium is to interpolate a 3D imaging dip field to obtain the overall estimation of DFZ.It is necessary to improve the interpolation algorithm.In addition,deep learning might be more powerful to estimate the full 3D dip field(Sun et al.,2019;Cheng et al.,2021).In total,we believe further research is needed and the avenue could eventually yield practical and useful tools for industrial applications.
6.Conclusions
Based on the DFZ,we calculate the explicit Hessian matrix by looping through the contributing traces instead of all data traces.The acceleration strategy runs with explicit formula of upper bound for PFZ and does not introduce an additional computational cost.In the synthetic and field data sets,we generate the higher-quality migrated gathers by using the BLS-PSTM at a significantly reduced computation and memory cost.Fresnel zone is jointly determined by the overlaid velocity,frequency band of seismic data and the reflector dip.The dip-angle migrated gather makes it easy to determine the Fresnel zone.We derive an explicit formula for the upper bound of PFZ at any imaging point by the lower and upper limits of dip-angle Fresnel zone as well as its depth.Though the calculation of finite-offset PFZ is expensive,we notice that the length of the finite-offset PFZ is easy to compute.Hence,we use a slightly loose formula to express the upper bound of PFZ.In practice,we use a two-stage process to reduce the computational cost and memory cost of Hessian matrix.First,we use the upper bound of PFZ to reduce the size of data-space loop before calculating the Hessian matrix.Then,we can further determine whether a seismic trace contributes to the imaging point by using the dip-angle Fresnel zone during calculating the Hessian matrix.
Acknowledgements
This study is jointly supported by the National Key Research and Development Program of China under Grant 2018YFA0702501,NSFC under Grant 41974126,Grant 41674116,and Grant 42004101;and the Project funded by the China Postdoctoral Science Foundation under Grant 2020M680516.
Appendix.The dip-angle gathers of PSTM
In the frequency-wavenumber domain(ω,kx),the wavefield recorded at a receiver xgcan be expressed as F(ω)e-jkxxg,where j denotes the imaginary unit and F(ω)denotes the Fourier transform of seismic trace.Assuming a laterally invariant or weakly variant medium,the downward continuation of the recorded wavefield is

here,the laterally invariant or weakly variant of the medium is vertically divided into n layers;viis the i-th interval velocity,ΔTiis the one-way vertical travel-time through each layer that reads ΔTi=Δzi/viwithΔzidenoting the thickness of the layer,and T=ΣΔTiis the one-way vertical travel-time from the acquisition surface to the target imaging depth.
By introducing the RMS velocity,,(Zhang and Zhang,2014)approximate

Substituting Equation(A-2)into Equation(A-1)and then applying the spatial inverse Fourier transform,we have

where px=denotes the ray parameter in the X direction.
Here,we define

According to stationary phase method(Bleistein,1984),the main contribution of the oscillation integral in Equation(A-3)comes from the stationary point pgx,which is obtained by solving

The solution of Equation(A-5)reads

Based on the Snell theory,we have the direction cosines(lg,ng)of the scattered-ray vectoras
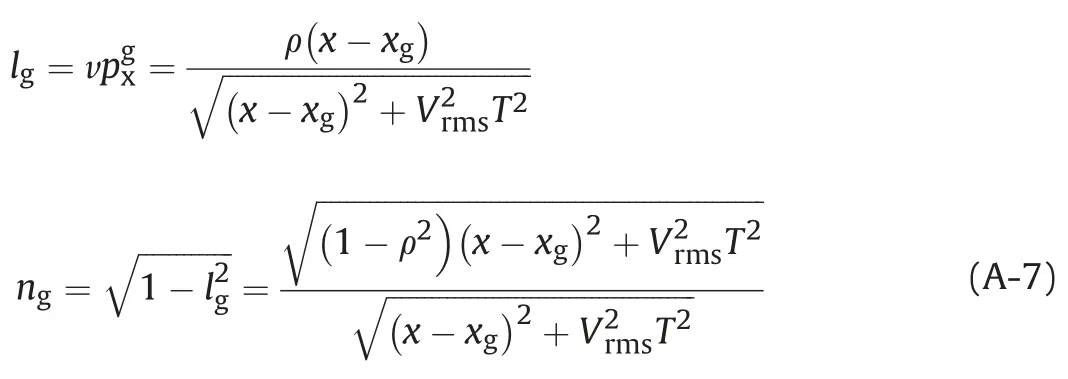
whereρ=v/Vrms.In the same way,we have the direction cosines(ls,ns)of the incident-ray vector as denoted byin Fig.2:
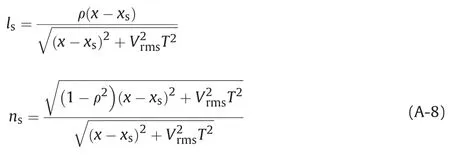
where xsdenotes the lateral coordinates of the shot.

Note that the reflector dipθxexpressed by Equation(A-9)represents the true structure dip in 2D space.However,the reflector will exhibit a slightly different dips inside the imaging space obtained by PSTM,which we call the traveltime-related dip angles(Zhang et al.,2016).Hence,in PSTM,the traveltime-related dip angles are more practical.Here,we obtain the travel-time-related dip angles,φxby settingρ=1 in Equations(A-7)and(A-8)(Zhang et al.,2016)as
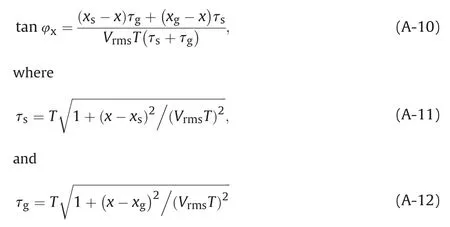
represent the travel-time from the shot to the imaging point and the travel-time from the receiver to the imaging point,respectively.Incorporating the solution of Equation(A-10)into the PSTM processing,we can obtain the dip-angle gathers.
- Petroleum Science的其它文章
- Sedimentary characteristics and implications for hydrocarbon exploration in a retrograding shallow-water delta:An example from the fourth member of the Cretaceous Quantou Formation in the Sanzhao depression,Songliao Basin,NE China
- Study of the gas sources of the Ordovician gas reservoir in the Central-Eastern Ordos Basin
- A novel hybrid thermodynamic model for pore size distribution characterisation for shale
- Microstructural analysis of organic matter in shale by SAXS and WAXS methods
- Investigation of oil and water migrations in lacustrine oil shales using 20 MHz 2D NMR relaxometry techniques
- Nonlinear amplitude inversion using a hybrid quantum genetic algorithm and the exact zoeppritz equation

