Lag times in toe-to-heel air injection(THAI)operations explain underlying heavy oil production mechanisms
Wei Wei,Ian D.Gates
Department of Chemical and Petroleum Engineering,University of Calgary,Calgary,Alberta,Canada
Keywords:
ABSTRACT
1.Introduction
Bitumen in the Western Canadian oil sands were formed millions of years ago as lighter oils underwent severe biodegradation resulting in present-day oil viscosities with thousands and up to millions of centipoise(Zhou et al.,2008;Li and Huang,2020;Chang et al.,2021).Over the past few decades,in situ steam based technology such as steam assisted gravity drainage(SAGD)and cyclic steam stimulation(CSS)have been the most used thermal recovery methods in the oil sands industry in Western Canada(Ali,1994;Batycky,1997;Butler,1998;Edmunds,1999;Donnelly,2000;Jiang et al.,2009;Bao et al.,2016,2017;Trigos et al.,2018).With the global shift to decarbonize,there is a desire to find new recovery process options with lower greenhouse gas(GHG)emissions(Gates and Larter,2014;Safaei et al.,2019).Research has been conducted on foam,polymer,solvent injections,and nanoparticles into heavy oil reservoirs to reduce the oil viscosity(Wang et al.,2011;Shi et al.,2015;Chen et al.,2019;Sun et al.,2020).Injection of oxygen into the reservoir is another alternative to the injection of steam into the reservoir.In this case,when the oxygen reaches the oil,providing the oxygen partial pressure is high enough,combustion occurs generating heat within the reservoir.This consequently raises the temperature of the oil leading to oil mobilization(viscosity reduction)and production.In addition,the combustion zone can generate in situ steam which can mobilize additional oil.One such process where air is injected into the reservoir is the toe-to-heel air injection(THAI)process(Turta,2013;Ameli et al.,2018).
THAI is an in situ combustion method for producing heavy oil invented by Greaves and Turta(1997).Unlike a conventional fireflood method that uses two vertical wells,the THAI process utilizes a well configuration which consists of one vertical injection well and one horizontal production well,as shown in Fig.1.The air is injected continuously near the toe of the production well through the injector.After combustion initiates,a series of reactions such as low temperature oxidation(LTO),high temperature oxidation(HTO),aquathermolysis,pyrolysis are taken place to generate heat and mobilize cold bitumen(Song et al.,2009;Kapadia et al.,2013;Jia et al.,2016).The fire front moves in a toe-to-heel progression along the producer,expanding the depletion zone as mobilized oil drains under gravity to the horizontal well.
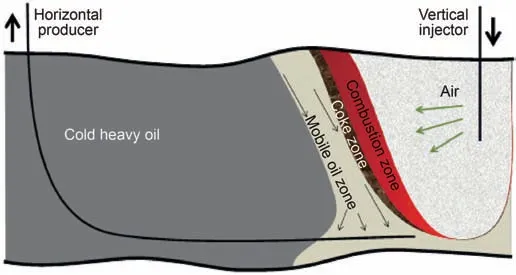
Fig.1.Schematic of toe-to-heel air injection(THAI)(Greaves and Turta,1997).
Previous research on THAI was mainly based on threedimensional(3D)combustion cell experiments(Greaves and Al-Shamali,1996;Greaves and Al-Honi,2000;Greaves et al.,2001;Xia and Greaves,2002,2006;Xia et al.,2003,2005).In general,they demonstrated high oil recovery and partial upgrading of heavy oil:Xia and Greaves(2006)used virgin Athabasca tar sand in a 3D THAI combustion cell experiment which demonstrated>80% oil recovery and more than+8˚API upgrading.Furthermore,the oil viscosity was lowered by a factor of four and the upgraded oil contained about 70% saturates compared to 14.5% in the original bitumen.Other 3D THAI combustion experiments(Greaves et al.,2001;Xia et al.,2002,2003)using other oils(Wolf Lake oil,Lloydminster oil,medium heavy and light oil)all showed high oil recoveries(>80%),partially upgraded oil,and drastic reduction of the oil viscosity.Prior simulation studies of THAI validated the experimental results(Coates and Zhao,2001;Greaves et al.,2012b;Ado et al.,2017).Field operations have also validated the technical viability of the THAI recovery process for heavy oil production(Ayasse et al.,2005;Petrobank,2012;Turta and Greaves,2018),however,field oil production(Wei et al.,2020,2021)have not been as promising as lab-based results,nor as good as predicted by field scale simulation models(Greaves et al.,2011,2012c;Ado,2020b,a).There is limited field data analysis and lack of research on examining the production difference between laboratory experiments and field production.
Greaves et al.(2012a,c)simulated a combustion cell experiment(0.6 m×0.4 m×0.1 m)whereas Coates and Zhao(2001)simulated a 3D combustion cell(0.4 m×0.4 m×0.1 m)experiment conducted by Greaves and Al-Honi(2000).From these simulations,the production mechanism of THAI process was determined to be mainly gravity driven which mitigates gas channeling issues experienced by conventional in situ combustion process.Furthermore,the simulations identified that the steam zone ahead of the combustion front is a major mechanism for transporting heat from the combustion gases to the cold oil reservoir beyond(Coates and Zhao,2001;Greaves et al.,2012a,c;Ado et al.,2017).An in situ combustion field study by Hajdo et al.(1985)indicated that heavy oil production can lag air injection by several weeks determined from observations of the field data.The production profiles of an experimental run 984 by Xia et al.(2003),experiment run 3 of Greaves and Al-Honi(2000),and experiment run 2000-01 by Greaves et al.(2012a)all showed a trend of drastic oil decline at the beginning followed by another peak oil rate at around 100-300 min followed by a gentle decline.However,this trend of delayed peak oil production rate was not matched nor observed by prior simulation models(Greaves et al.,2012a,c;Ado et al.,2017).The simulation study by Greaves et al.(2012a)even showed a countercurrent production trend at the beginning compared to the experimental result.Thus,the literature reveals that the recovery mechanisms and the link to how the recovery profile evolves during the process remains unclear.
The research documented here aims to use lag time analysis to improve the understanding of the recovery mechanism in the context of the response of production to stimulation.The time scale for this lag nor the physical reason for the lag is not well understood and this time scale can be instructive as to the underlying mechanisms that limit or enhance process performance.
Lag time effects have been studied extensively in many fields of science to gain insights into possible interaction mechanisms between different physical and chemical processes(Runge et al.,2014).For example,DeWalle et al.(2016)studied the lag times between atmospheric deposition and changes of stream chemistry to improve an understanding of the ecosystem and to refine pollutant control strategies.In another example,Bello et al.(2017)evaluated the effect of longitudinal multi-pollutant mixture exposure on health outcomes in later life.Chen et al.(2018)made an attempt to quantify the lag time between hydrodynamic action and reservoir bank accumulation landslides and Jong et al.(2013)investigated how vegetation growth relates to climatic factors such as precipitation and temperature using lag time analysis.In the oil and gas sector,lag time between stimulus and response has been used in seismic signal processing interpretation(Kelly,2012)and monitoring reservoir changes during production(Wikel et al.,2012).The lags in the response of gasoline prices to changes in crude oil prices has been studied by Radchenko(2005).Khalifa et al.(2017)found the impact of changes in oil prices on active rig counts has lag times up to one quarter.Thus,lag time analysis can be used to understand the physics of system to understand how to improve the performance of a system or how to predict the behavior of a system.
Despite prior extensive research on the THAI process in experimental and simulation settings,there has been no studies,as yet,on the lag time between air injection and oil production and the implication with respect to the underlying production mechanisms in the process.An understanding of the production lag time will lead to greater understanding of the relative importance of physical,chemical and fluid flow processes as well as to indicate the strength of underlying production mechanisms.This understanding can lead to options for performance improvement.
2.Kerrobert THAI heavy oil project
The Kerrobert THAI project is located in the province of Saskatchewan,Canada,targeting heavy oil in the Waseca sandstone Formation within the Mannville Group.Prior to THAI,parts of the reservoir were produced by using the cold heavy oil production with sand(CHOPS)process for about 10 years.In this process,the production well is placed in the reservoir and the foamy heavy oil is produced due to solution gas drive;sand is also produced and thus,wormholes(void space)are created within the reservoir starting at the production well leading to high permeability channels and void space within the reservoir as the process evolves.The overall reservoir and fluid properties for the Waseca channel are listed in Table 1.There is also a discontinuous bottom water zone with thickness ranging from 10 to 20 m.The horizontal wells are located about 2-7 m above the oil water contact.

Table1 Overall reservoir and fluid properties of the Waseca sandstone channel.

Fig.2.Top view of Kerrobert toe-to-heel air injection(THAI)project well layout.
The project consists of twelve THAI well pairs,displayed in Fig.2.Well pairs 1 to 7 are in the East pad whereas Well pairs 8 to 12 are within the West pad.Well names starting with KA indicate vertical air injection wells and well names starting with KP indicate horizontal production wells.The inter-well spacing is~100 m and the average horizontal and vertical offset distances between injector and producer are 8 and 10 m,respectively.Wells MT08 and MT11 are used as additional vertical injection wells for well pairs 8 and 11 and they have horizontal offset distance of 12 and 40 m from the producers,respectively.Well pairs 1 and 2 started operation in 2009.After commercial production rates were achieved,the remaining well pairs were drilled and commenced production in 2011.
Previous studies(Turta and Greaves,2018;Wei et al.,2020,2021)found that the liquid production rate is not directly proportional to the amount of air injected.As illustrated in Fig.3,there is a large scatter of the data for both East and West pads but the general trend suggests that liquid production is not maximized by simply increasing air injection rate and there is a peak liquid production across the spectrum of air injection rates.In addition,the field experience(Hajdo et al.,1985)often find oil production lags air injection by several weeks.Hence,a correlation between instantaneous air injection and oil production is not sufficient to understand causal relationship between them.In this study,cross correlation analysis is used to consider the production lag effect to better describe the production mechanisms of THAI process.
3.Methodology
Cross correlation analysis is used to determine whether a time lag exists between two different time series(Knapp and Carter,1976).It is often used in the field of signal processing to measure the similarities between two signals at different time series and find when the best match occurs(Carter and Knapp,1976;Gupta et al.,2010).In this research,to understand the lag time effect between air injection and liquid production,normalized cross correlations(Viola and Walker,2003;Rao et al.,2014)between the air injection rate and oil production rate or water production rate are first calculated:
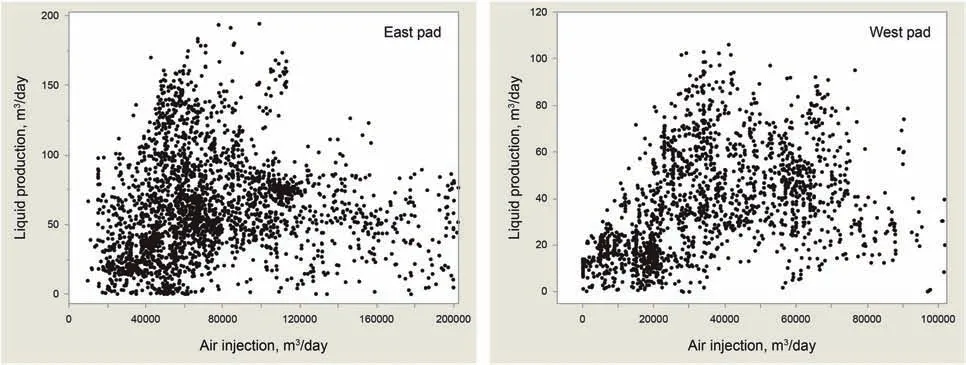
Fig.3.Liquid production rate versus air injection rate for both East and West pads.
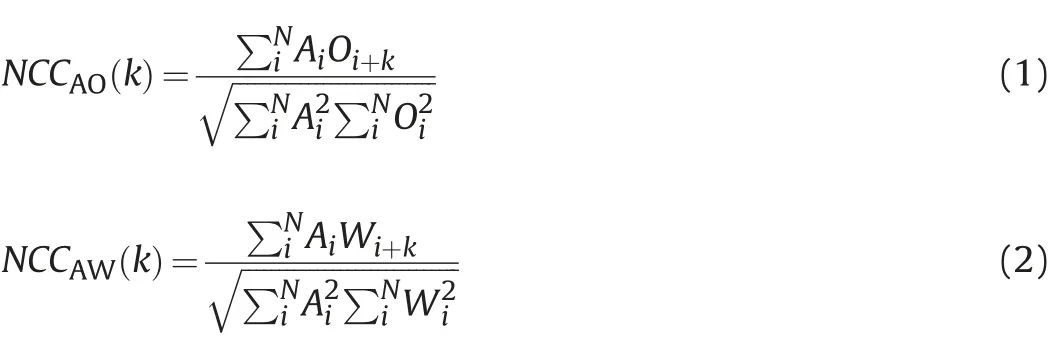
where i refers to the ith production day;A is the daily air injection rate,m3/day;O is the daily oil production rate,m3/day;W is the daily water production rate,m3/day;k is the time lag day starting at Day 0.KP04 and KP12 are excluded from this study due to excessive sand production problem.All remaining production wells are evaluated and the normalized cross correlation results between air injection rate and oil production rate,presented in Fig.4,show two distinct patterns:
Pattern I Oil production reaches a peak at the onset of air injection and starts to decline thereafter,and
Pattern II oil production increases initially after air injection and then decreases once the peak is reached after a certain time lag has occurred.
The well performance profiles are classified into four distinct types as illustrated in Fig.4:
Type I only Pattern I is observed,
Type II only Pattern II is observed,
Type III both Patterns I and II are observed,but Pattern I is more dominant,and
Type IV both Patterns I and II are observed with longer time lag compared with Type III.
The normalized cross correlation between air injection rate and water production rate,shown in Fig.5,also displays similar patterns to that of oil production in Fig.4,except the peak observed at larger lag time in Pattern II,and less of a peak at zero lag time profiles for the KP06 and KP07 Type IV wells.
Based on the observed patterns in Fig.4,the first pattern shows a decline which seems to be similar to an exponential decay and the second pattern exhibit a close to bell shaped curve which is similar to a sinusoidal wave.Thus,a mathematical model is constructed to represent the observed patterns between air injection rate and oil production rate:

where the first term on the right hand side represents the decline in Pattern I using an exponential decline function,the second term denotes Pattern II using a cosine function,and C is a constant term.In the first term of Eq.(3),αdefines the peak value at the onset of air injection,m3/day;βis the decline rate constant,day-1.In the second term,τis the time lag at the peak value,day;γdenotes the corresponding amplitude.These parameters can be determined by fitting the cross correlations shown in Fig.4.Since only the first two terms(exponential and cosine functions)of Eq.(3)represent the observed oil production response to air injection rate with respect to lag time,the constant term is neglected.By comparing all well pairs performance on a same basis,the normalized oil production distribution is governed by:

whereαNandγNare the corresponding parameters after normalization such thatZ(t)=1.
4.Results and discussion
Fig.6 demonstrates the cross correlation fitting result of four representative wells from each well type:KP02 for Type I,KP08 for Type II,KP01 for Type III and KP07 for Type IV.The exponential,cosine,constant terms of Eq.(3)and the normalized oil production distribution are plotted as yellow,blue,grey and green color lines,respectively.As illustrated in all plots,the orange fitting line has close match with the cross correlation black line indicating the proposed model using exponential decline and cosine functions are good representations.It can be seen that the cosine term(blue line)is insignificant in Type I wells,and exponential term(yellow line)is not observable in Type II wells.Additionally,both exponential and cosine terms are more notable in Type IV wells than Type III wells.
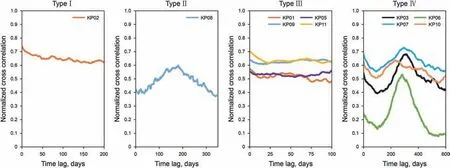
Fig.4.Well type diagram illustrating four observed types in normalized cross correlation between air injection and oil production.Type I:Pattern I,Type II:Pattern II,Type III:Both patterns are observed and Pattern I is more dominant,and Type IV:Both patterns are observed with longer time lag compared to Type III.
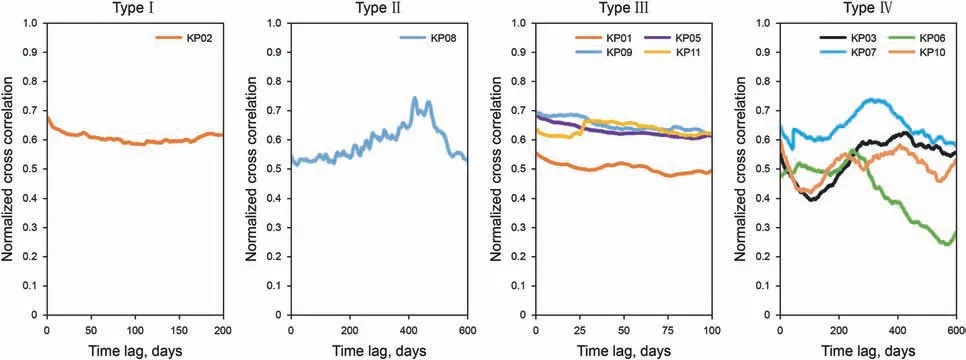
Fig.5.Well type diagram illustrating four observed patterns in normalized cross correlation between air injection and water production.
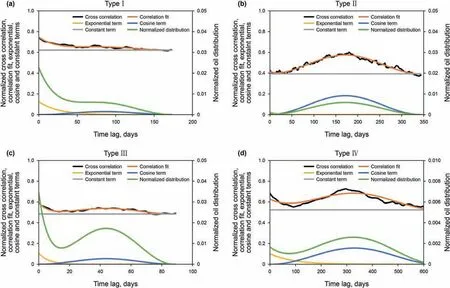
Fig.6.Cross correlation model fitting,determined exponential term,cosine term,constant term and normalized oil distribution for(a)Type I,(b)Type II,(c)Type III,and(d)Type IV wells.
The normalized cross correlation result in Fig.4 demonstrates two distinct main patterns and combinations of the two.The first pattern shows that the oil production distribution is at the highest at onset of air injection-the oil rate is characterized by an immediate response.The second pattern shows a production distribution close to a bell-shaped curve where the oil production peaks at about 200 days after air injection for Type II well,and a longer time lag of about 300 days for Type IV wells(although there is a peak at zero lag time which suggests that there is also a rapid response there as well).
The result of the lag time analysis suggests that oil production at Kerrobert THAI facility exhibits two distinct time scales for production response:a short time scale response(immediately after production well is open)and a long time scale response(of order of 100-300 days)-these two responses and the corresponding production mechanisms are displayed in Fig.7 and Fig.8.The short time production response,illustrated schematically in Fig.7,suggests a production mechanism that produces fluid near the wellbore.For the short time response,when the horizontal well in THAI is put on production after air injection starts,in the region close to the production well,there is insufficient time for hot fluids to reach the production well and thus,the response must be due to near well phenomena.What can explain this fast response time is solution gas drive and foamy oil drive and formation expansion.The Kerrobert operation,prior to THAI was operated as a cold heavy oil production with sand(CHOPS)operation.It was operated in this mode for more than 10 years with production rates averaging at~5 m3/day.As soon as the production well is opened,gas exsolves from the heavy oil and as a result,the bubbles in the gas,with further pressure decline,enlarge and displace the heavy oil towards the production well.The time scale for this response would be nearly instantaneous as is the case in CHOPS wells(Istchenko and Gates,2014;Haddad and Gates,2015;Speight,2016).
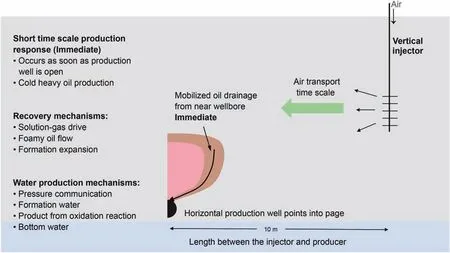
Fig.7.Short time scale oil production recovery mechanisms and water recovery mechanisms at Kerrobert THAI project.
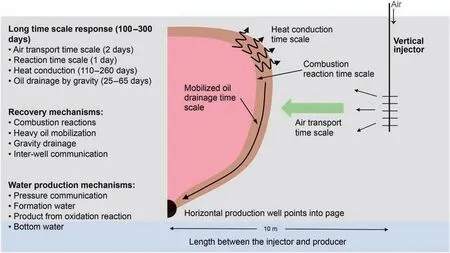
Fig.8.Long time scale oil production recovery mechanisms and water recovery mechanisms at Kerrobert THAI project.
The long time production response,presented schematically in Fig.8,is linked to the THAI process itself as explained in the following.The time scale for movement of the air within the reservoir given the pressure difference between the injection and production wells(~200 kPa),length between the wells(~10 m),effective permeability of air in the reservoir(~3 D),viscosity of gas(~10μPa s),is equal to about 2 days.The reaction length scale given the kinetics of the reaction is of order of 1 day.However,heat conduction from the hot zone to the remaining oil sands(given thermal diffusivity~10-5m2/s and length scale for conduction being about 10 and 15 m),gives a heat conduction time scale of between 110 and 260 days.The drainage of mobilized oil to the production well under gravity drainage(with reservoir thickness above producer~20 m and oil effective permeability 1 D,and oil viscosity 2-5 cP)gives a time scale of order of 25-65 days.Thus,the total process associated with air movement through the reservoir,oxygen reaction,heavy oil heating within the reservoir,and heavy oil drainage to the production well corresponds to an overall response time between air injection and heavy oil production of~140 and~300 days.
On the other hand,the normalized cross correlation between daily air injection and water production shown in Fig.5 demonstrate similar trend as the oil production distribution except the second pattern has peak at about 450 days.The main recovery mechanisms for water production,as illustrated in Figs.7 and 8,are formation water production due to hydraulic difference and pressure communication between injector and producer(Pattern I short term production effect),as well as produced water from oxidative combustion reaction and possible bottom water production(Pattern II long term production effect).
The fitting result in Fig.6 shows the exponential decline and cosine functions are good representations for the short term and long term production responses,respectively.The result of fitting parameters is listed in Table 2.Theαandβvalues indicate the peak and decline rate of the short term production response,andγ shows the long term production response amplitude.
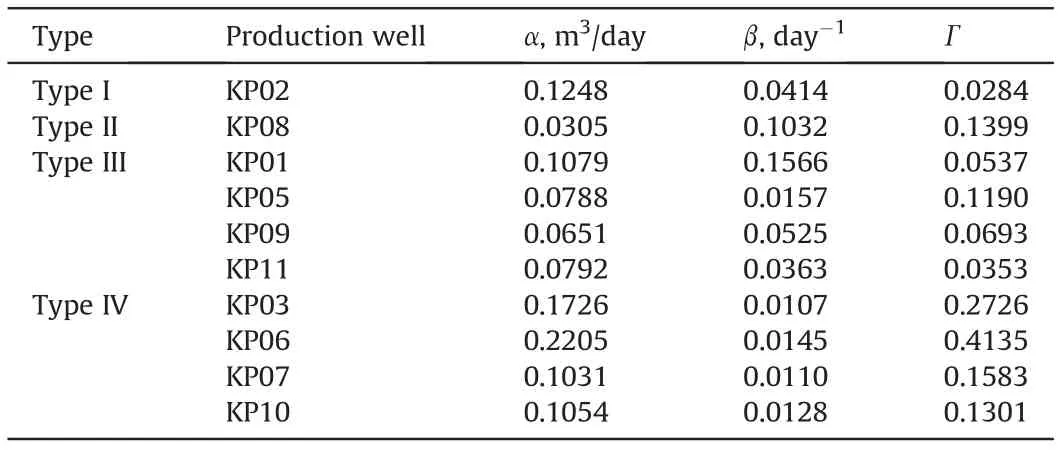
Table2 Fitting parameters for all wells.
Prior data analysis conducted by Wei et al.(2020,2021)revealed that greater air injection rate does not promote higher liquid production rate due to cooling effect from the excessive air flowing through the reservoir rock.Well KA02 has the highest air injection rates(averaged at~25,000 m3/day)among all injectors,and it is evident from the fitting result in Table 2 that KP02 well has the lowest cosine term amplitudeγ(0.0284),suggesting that there is less significant production contributions from the long term response combustion-reaction based heating than the other wells.Well pair 8 has an extra injector MT08 near the middle section of the KP08 producer compared to the other well pairs.The fitting result in Table 2 shows it has the lowest peak value ofα(0.0305)after air injection starts indicating that the major production contribution for this well arises from combustion-reaction based heating.In general,the Type IV wells have lower decline rateβ(~0.012)with longer lag time in Pattern I indicates near wellbore production mechanism takes longer compared to the Type III wells.The higher cosine term amplitudeγ(>0.1)in Type IV wells also suggests a higher combustion-based production contribution in the Type IV wells than that in the Type III wells.The determination ofα,βandγis critical as it provides basis of each well type production performance and could be used as guideline(combustion dominance)for future development wells.
Table 3 lists the oil production contribution for every well computed from Eq.(4).Aside from well KP02 where 56% of its production comes from the first pattern,the results suggest that all of the other wells have oil production mainly arising from the second pattern likely physically due to combustion-reaction based heating.This provides a basis for judging which wells are responding strongly to air injection and the one(only KP02)that ismainly responding to cold production mechanisms is due to excessive air injection volume which cools the combustion front and results ineffective heating.

Table3 Oil production contribution of each well from the two observed patterns.
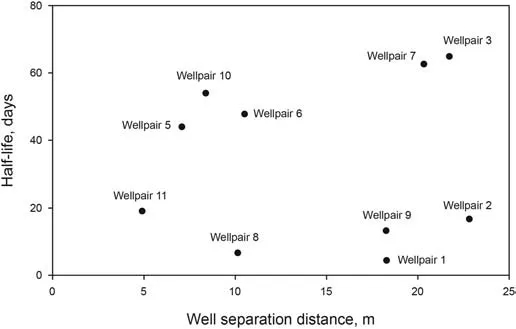
Fig.9.Exponential decay half time versus well separation distance.
Fig.9 plots the first pattern exponential decay half-life versus well separation distance between injectors and producers.It clearly shows the well separation distance has an insignificant effect on the first pattern production response.However,it is worth noting that all Type IV wells(KP03,KP06,KP07,KP10)and well KP05 have half-life of>40 days and they are all located more towards to the south boundary of the project.Whereas all remaining wells have half-life<30 days and are all located towards to the north boundary of the project.Meanwhile,the CHOPS wells that were used prior to the THAI operation were also located at the north boundary of the THAI project(Wikel and Kendall,2012):it is likely that the primary production depletion affected subsequent production from the reservoir by using the THAI process.
In general,the Type IV wells had higher proportion of production contributed from PatternII thanType III wells as indicated byTable 3,but the faster decline of near wellbore production and overall shorter lag time may result in faster economic returns from Type III wells.Butler(1991)described that in a conventional fireflood field,it was also concluded that in situ combustion should be employed in the oil sand reservoirs that have been first produced and preheated by steaming.The Kerrobert THAI injection wells all received about one month of steam injection prior to air injection.The total steam volume received by each well pair varies from 394 m3CWE(cold water equivalent)to 2677 m3CWE.This difference in steam volume(pre-heat in the reservoir)appears to have had no effect on the production performance.The primary production from the CHOPS wells,due to the formation of wormholes within the reservoir from sand production(Wang and Chen,2004;Tremblay,2005;Xiao and Zhao,2017),created void space in the partially depleted zone near the Type III wells.This resulted in a more rapid production decline at the start of THAI due to preferential paths(the wormholes)for mobilized oil to flow through after it was heated bycombustion.This leads to a shorter lag time for these wells.Furthermore,the oil pay zone varies from 10 m to 30 m from south towards north of the project area.The presence of shale layer between sand intervals on the north boundary of project have also been mostly eroded comparedtothe shale layeron the south boundary.Therefore,the oil drainage rate may have been impacted by the integrity of the shale layer and leads to longer lag time for the Type IV wells.Thus,for future project development,the model developed in this study serves a good predictive tool for different type wells.
With respect to THAI experimental results,the oil production trend obtained in the laboratory(Greaves and Al-Honi,2000;Xia et al.,2003;Greaves et al.,2012a)all perform similar to Type IV wells:a rapid oil production decline in the beginning(near producer production in the 3D cell)with another peak of oil production at around 100-300 min.The delayed peak oil production is the result of combustion reaction,heat transfer,and oil drainage inside the cell.This is reasonable since laboratory tests are highly combustion dominated and there is no prior cold production as is the case with Type III wells.The longer delay of oil production in the field(300 days for Type IV wells)is related to the difference of the length scales(0.14 m between injector and producer in the laboratory versus 10 m offset distance between injector and producer in the field).
The production performance of well pair KA02/KP02,could be improved by lowering the air injection rate to~16,000 m3/day,or by changing the operation to a cyclic production mode to eliminate the injection constraint,as suggested by the clustering result by Wei et al.(2021).The comparison between the Type II well KP08 and all Type IV wells,demonstrates that multiple injectors along the horizontal producer well also promote shorter lag time for reaching the peak production in Pattern II.However,the distance between MT11 and KP11(40 m)is too great to affect production performance.Therefore,multiple air injection wells near the producer(within 10 m)would shorten the production lag time.Pre-produced wells(CHOPS production in Type III wells)results in faster near-wellbore decline and shorter lag time than that of Type IV wells.
5.Conclusions
In this study,for the first time,production delay effects have been evaluated from an examination of the Kerrobert THAI heavy oil production operation.Two response times and distinctive recovery mechanisms are observed:(1)a short term production effect(near-wellbore production)with nearly instantaneous response which is likely associated with solution-gas drive and foamy oil flow as is the case with cold production of heavy oil;and(2)a longer time scale production due to air injection,heating from combustion reactions,and drainage of mobilized oil.The findings are consistent with experimental observations which have not been examined in detail in previous studies;furthermore,the delayed peak oil production has not been history matched by any prior simulation models.The mathematical model developed in this study was capable of quantifying combustion-related production providing a basis to understand heating conditions within the reservoir.The four different well types identified based on the two production patterns provide good predictive guidance for future project development.They also suggest that THAI wells near the previously cold produced zone result in shorter lag time between air injection and oil production.
Acknowledgements
The authors would like to thank Proton Technologies for providing data on the Kerrobert THAI pilot.The authors also acknowledge support from the Department of Chemical and Petroleum Engineering at the University of Calgary,the University of Calgary's Canada First Research Excellence Fund program(the Global Research Initiative for Sustainable Low-Carbon Unconventional Resources).
- Petroleum Science的其它文章
- Sedimentary characteristics and implications for hydrocarbon exploration in a retrograding shallow-water delta:An example from the fourth member of the Cretaceous Quantou Formation in the Sanzhao depression,Songliao Basin,NE China
- Study of the gas sources of the Ordovician gas reservoir in the Central-Eastern Ordos Basin
- A novel hybrid thermodynamic model for pore size distribution characterisation for shale
- Microstructural analysis of organic matter in shale by SAXS and WAXS methods
- Investigation of oil and water migrations in lacustrine oil shales using 20 MHz 2D NMR relaxometry techniques
- Fast least-squares prestack time migration via accelerating the explicit calculation of Hessian matrix with dip-angle Fresnel zone

