
Simultaneous and multiplex detection of exosomal microRNAs based on the asymmetric Au@Au@Ag probes with enhanced Raman signal
2022-07-11 03:39MinHouDinggengHeHuizhenWngJinHungHongChengKejinWnHungWingLiZifengTngXioxioHeKeminWng
Chinese Chemical Letters 2022年6期
Min Hou,Dinggeng He,,∗,Huizhen Wng,Jin Hung,Hong Cheng,Kejin Wn,Hung-Wing Li,Zifeng Tng,Xioxio He,∗,Kemin Wng,∗
a State Key Laboratory of Chemo/Biosensing and Chemometrics,College of Biology,College of Chemistry and Chemical Engineering,Key Laboratory for Bio-Nanotechnology and Molecular Engineering of Hunan Province,Hunan University,Changsha 410082,China
b Department of Chemistry,The Chinese University of Hong Kong,Shatin,New Territories,Hong Kong,China
c College of Art and Science,New York University,New York 10012,United States
Keywords:SERS Au@Au@Ag probes Exosomes miR-21 miR-126 miR-1246
ABSTRACT Simultaneous and quantitative detection of multiple exosomal microRNAs (miRNAs) was successfully performed by a surface-enhanced Raman scattering (SERS) assay consisting of Raman probes and capture probes.In this design,the asymmetric core-shell structured Au@Au@Ag nanoparticles were first synthesized by layer-by-layer self-assembly method and modified with different Raman molecules and recognition sequences (polyA-DNA) to prepare the surface-enhanced Raman probes.Then,the streptavidinmodified magnetic beads were used to immobilize the biotinylated DNA capture sequences (biotin-DNA)to obtain capture probes.In the presence of target exosomal miRNAs,the Raman probes and capture probes could bind to the target exosomal miRNAs in the partial hybridization manner.Thus,the developed SERS sensor could indicate the target miRNAs levels in the buffer solution.Using breast cancerrelated miRNAs as model targets,the limits of detection of this sensor were determined to be 1.076 fmol/L for synthetic miR-21,0.068 fmol/L for synthetic miR-126,and 4.57 fmol/L for synthetic miR-1246,respectively.Such SERS sensors were further employed to detect the miR-21 in 20% human serum and the extraction solution of exosomes,respectively.Therefore,simultaneous and multiplex detection of cancerrelated exosomal miRNAs by this assay could provide new opportunities for further biomedical applications.
Exosomes have become hotspots owing to their role in cancer research recently [1,2].MiRNAs with different levels of expression can be used to confirm the initial and progression stages of cancer [3,4].Previous studies demonstrated that the expression levels of exosomal miRNAs secreted into body fluid can reflect the physiological state of parent cancer cells.Exosomal miRNAs,protected from RNase digestion by lipid bilayer of vesicles,can act as a promising biomarker for liquid biopsies [5,6].It was also demonstrated that cancer-specific exosomal miRNAs fingerprints are expressed in different types of human cancers [7,8].Therefore,these studies emphasize the potential,progress,and therapeutic response of multiplex miRNAs in cancer diagnosis.Consequently,specific and simultaneous detection of multiple exosomal miRNAs is essential for cancer diagnosis and tumorigenesis [9].
Up to now,researchers have developed various methods to detect multiplex exosomal miRNAs,such as quantitative reverse transcription-polymerase chain reaction (qRT-PCR),microarrays[10,11].However,the PCR design is very sophisticated,timeconsuming.Microarray assays oblige several complicated steps and expensive equipment for fluid control [12].Other emerging analytical techniques have been developed for miRNAs detection,such as electrochemistry,fluorescence,surface plasmon resonance (SPR)[13–15].However,these methods may be prone to some problems in multiplex exosomal miRNAs detection,such as autofluorescence,overlap of broad fluorescent bands,and charge interference in complex systems.Therefore,there is an urgent need to develop a simple but powerful strategy to detect tumor-associated multiplex exosomal miRNAs.
Surface enhanced Raman scattering (SERS) spectroscopy is an optical ultra-sensitive assay for label-free biomarkers detection[16–18].The SERS based on metal nanostructures has attracted the attention of many researchers due to its high sensitivity,selectivity,outstanding spectral multiplexing competence for the detection of target simultaneously [19–23].Meanwhile,some SERS methods based on metal nanostructures have been reported for the detection of exosomal miRNAs [24–27].For example,Panget al.have exhibited the dual-SERS array to detect exosomal microRNAs based on the Fe3O4@Ag-DNA-Au@Ag@DTNB (SERS tag) conjugates[6].Leeet al.have reported a uniform gold nanopillar SERS substrate for exosomal miRNAs detection.Although the selectivity was improved and signal fluctuation was reduced for these methods,the use of SERS for reliable quantitative analysis of multiplex miRNAs has been still hindered due to the lack of ultrasensitive SERS active nanostructures [28–31].
Herein,we designed a SERS strategy based on the asymmetric Au@Au@Ag probes with enhanced Raman signal to detect various exosomal miRNAs simultaneously.The Raman probes were rationally designed by using anchor DNA modified AuNPs (Au@aDNA)as a nanocore,followed by the coating of Raman signal molecules on the appearance of Au@aDNA by Au-S bond and the subsequent formed gold shells around the nanocores.To further improve the Raman signal,the Au@Au was covered by silver shell to form the Au@Au@Ag nanostructure.Then,the polyA-functionalized DNA probes (polyA-DNA) were modified on the gold head of Au@Au@Ag nanostructure according to Ref.[32].The polyA-DNA used in this work contained an oligonucleotide sequence that was partially complementary to the target exosomal miRNAs (Scheme 1A).Similarly,the biotin-DNA modified on streptavidin-modified magnetic beads (MB) was partially complementary to the target miRNA.When the target exosomal miRNA was present,Raman probes could be conjugated to the capture probes through sandwich hybridization (Scheme 1B).
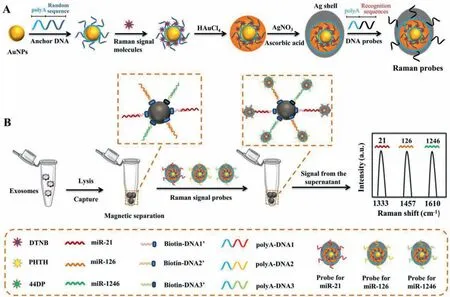
Scheme 1.Schematic representation of SERS assay using the asymmetric Raman probes for the detection of multiplex exosomal miRNAs.(A) The synthesis process of Raman probes using Au@Au@Ag nanostructure.(B) Schematic representation of fabrication of capture probes using streptavidin-modified magnetic beads,and SERS assay for the detection of multiplex exosomal miRNA by sandwich hybridization.Each type of exosomal miRNA was captured by the corresponding capture probe,and then hybridized with its own Raman probe to form sandwich complex.The concentration of target exosomal miRNA was obtained by analyzing the reduced SERS signal in the supernatant after forming sandwich complex.
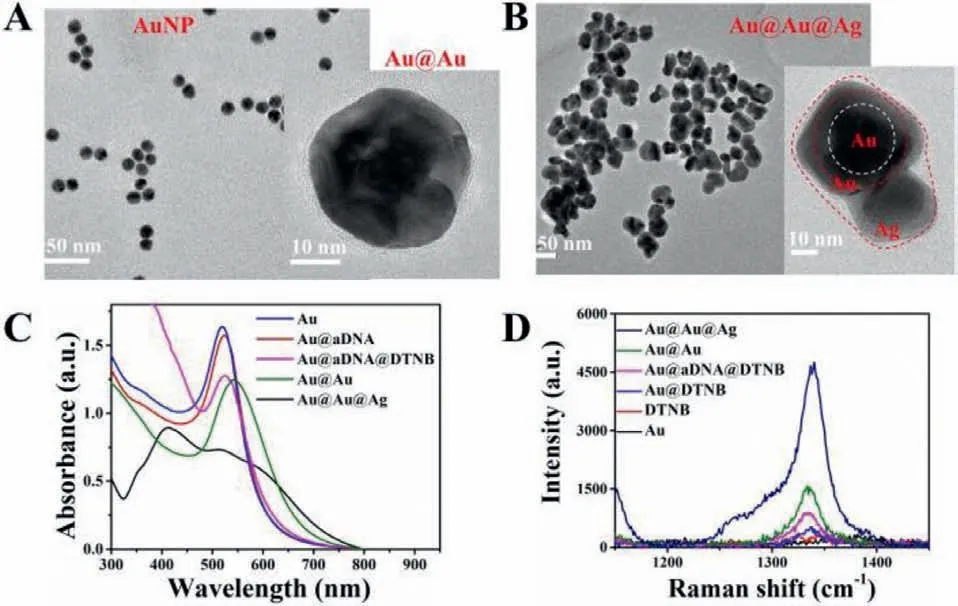
Fig.1.(A) TEM image of AuNP.Inset: High-resolution TEM image of Au@Au.(B)TEM image of the asymmetric Au@Au@Ag.Inset: The magnified TEM image.(C) UV–vis spectra of Au,Au@aDNA,Au@aDNA@DTNB,Au@Au and Au@Au@Ag nanostructure.(D) SERS spectra of Au@Au@Ag,Au@Au,Au@aDNA@DTNB,Au@DTNB,DTNB,and Au.
The concentration of target miRNAs was obtained by analyzing the reduced SERS signal in the supernatant after forming sandwich complex [33].In this work,three Raman signal molecules,including 5,5′-dithiobis(2-nitrobenzoic acid) (DTNB),phthalazine (PHTH)and 4,4′-dipyridyl (44DP),were used as Raman reporters to get three different Raman probes (Fig.S1 in Supporting information).The signal change of the characteristic peaks of DTNB (1333 cm−1),44DP (1610 cm−1) and PHTH (1450 cm−1) indicated the concentration of miR-21,miR-1246 and miR-126,respectively.In this manner,simultaneous and ultrasensitive detection of multiplex cancerrelated exosomal miR-21,miR-126 and miR-1246 in one sample was realized,which is beneficial for early diagnosis of cancers [34–36].
As a proof of concept,TEM was used to characterize the morphology and structures of different nanoparticles.Firstly,13 nm gold nanoparticles (AuNPs) were prepared (Fig.1A),followed with modification of anchor DNA (aDNA) and Raman signal molecules DTNB onto the AuNP surface to prepare the Au@aDNA@DTNB.Gold shells were further formed around the Au@aDNA@DTNB (Au@Au,inset in Fig.1A).Due to the similar lattice between Au and Ag,Ag atoms could be deposited on Au@Au quickly to form a goldsilver alloy shell (Fig.1B) after reduction by ascorbic acid.The dynamic light scattering (DLS) results of AuNPs displayed an increase after the formation of Au@aDNA and Au@Au (Fig.S2A in Supporting information).A red shift in the absorption peak of AuNPs could be observed after the forming Au@aDNA,Au@aDNA@DTNB and Au@Au nanoparticles (Fig.1C),respectively.Moreover,a novel strong silver absorption peak at 420 nm (Au@Au@Ag) was displayed,which presented the successful formation of Au@Au@Ag nanostructure [34].Besides,energy dispersive X-ray (EDX) results of gold or silver showed an optical absorption band peak at about 2.2 keV or 3 keV individually (Fig.S3A in Supporting information).The mapping image of Au@Au@Ag showed the distribution of Au and Ag in the synthesized nanoparticles,which proved the Ag shell structures (Fig.S3B in Supporting information).
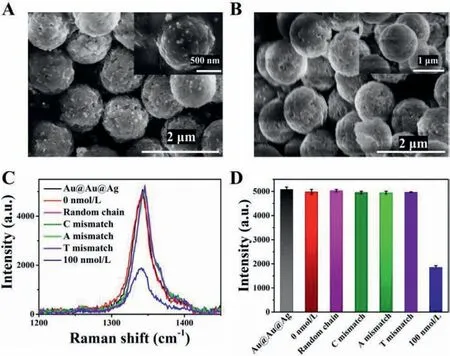
Fig.2.SEM of sandwich complex.(A) In the presence of target,the Raman probes were connected to the exterior of the capture probes because of DNA hybridization.(B) The control examination with no target.(C) SERS spectra of specific analysis.The Raman probes and capture probes were mixed with 100 nmol/L miRNA-21,100 μmol/L Random chain,single-base mismatch (C,A and T),and the blank samples (0 nmol/L).(D) SERS intensity of the characteristic peaks of DTNB (1333 cm−1)in Fig.2C.
After characterizing the nanostructure of Au@Au@Ag,we further investigated the SERS enhancements performance of different nanoparticles.As seen from Fig.1D,the Raman substrate fabricated with Au@Au showed enhanced Raman signals compared with the AuNPs,which was attributed to the Au shell.The substrate of Au@Au@Ag showed powerful Raman signals,and its intensity reached about 400 and 40 times than the Raman signal of the Au and Au@Au substrates,respectively.It is evidence of the role of Au shell and Ag shell to provide optimal SERS activities.We observed that the SERS spectroscopy of the Au@Au@Ag was highly uniform in time-dependent Raman spectra (Fig.S4 in Supporting information),which arose from their stable structures.
To evaluate the specificity of the SERS assay,miR-21 was taken as an example.In the presence of the miR-21,sandwich complex could be formed among the target miR-21,capture probes and the corresponding Raman probes due to the partial complement to the target miRNA of the Raman probes and the capture probes,respectively.There were some free SERS probes in the supernatant.In the case of absence of the target,complex won’t be formed,and the suspension contained almost all SERS probes added.The successful formation of sandwich complex had been demonstrated by SEM.As exhibited in Fig.2A,in the presence of target,the Raman probes were connected to the exterior of the MB because of DNA hybridization.Meanwhile,it could be observed that there were no Raman probes on the surface of capture probes in the blank control experiment.(Fig.2B).It also showed that the nonspecific adsorption between the Raman probes and capture probes is extremely low in this experiment.Meanwhile,the EDS elemental mapping (Fig.S2B in Supporting information) confirmed the existence of Au atoms and Ag atoms.We also tested the specificity of the Raman probes by designing oligonucleotide sequences with a single-base mismatch and a random sequence,respectively (Table S1 in Supporting information).As indicated in Figs.2C and D,the SERS signal of the 100 nmol/L fully complementary miR-21 was distinct from 100 μmol/L Random chain,single-base mismatch (C,A and T),Au@Au@Ag nanoparticles and the blank samples (0 nmol/L).These phenomena showed that the Raman probes could recognize and hybridize with the target miRNA specifically.There was no difference in Raman signals between Au@Au@Ag nanoparticles and blank samples (0 nmol/L),which showed no effect of the capture probes on the Raman signal.Those results also confirmed the low non-specific adsorption between Raman probes and capture probes.
Having demonstrated the biofunction and cognitive ability of Raman probes,we further utilized the Raman probes to detect miR-21,miR-1246,and miR-126,respectively.As shown in Figs.3A and B,as the concentration of miR-21 increased,the SERS intensity of the DTNB-encoded probes in the supernatant decreased.The change value of SERS intensity was obtained from the difference from presence of the target to absence of target.We observed a good linear response ranging from 1 nmol/L to 1 fmol/L.The fitted formula wasΔI1333=562.6 (lg[CmiR-21])+8923,the R-square (R2)value is 0.97,and the limits of detection (LODs) was approximately 700 amol/L.Correspondingly,as the concentration of miR-1246 increased,the signal intensity of 44DP-encoded probes in the supernatant was prone to be weaker (Figs.3C and D).The regression equation isΔI1610=366.2 (lg[CmiR-1246])+7106.5,theR2value was 0.96,and the LOD was approximately 2.46 amol/L.As the concentration of miR-126 increased,the signal intensity of PHTH-encoded probes in the supernatant was prone to be weaker (Figs.3E and F).The regression equation wasΔI1457=546.4 (lg[CmiR-126])+8249.6,theR2value was 0.95,and the LOD was approximately 589 amol/L.
In order to detect multiple miRNAs simultaneously,three Raman probes were preparedviathe functionalization of DNA probes on Au@Au@Ag nanostructure encoded by DTNB,PHTH or 44DP,respectively.SERS spectra of three Raman probes (Figs.4A and B)demonstrated that each kind of specific Raman probes could be explicitly recognized due to its unique spectroscopic fingerprint,which was capable of multiplex biorecognition.Subsequently,the specificity detection of miRNA was investigated by the mixture of different Raman probes.In the examination,miR-1246,selected as a model target,was added to the multiple reaction assay to observe whether the changes in the SERS intensity would be affected.After adding non-specific Raman probes,the association between the band intensity of DP and the concentration of the corresponding target miR-1246 remained unchanged.It confirmed that the crosstalk between the different Raman probes classes was negligible (Fig.S5 in Supporting information).
Subsequently,we selected cancer-associated miR-21,miR-1246,miR-126 as the targets to investigate the selectivity of the SERS array.Raman scattering peaks of 1333 cm−1(•),1610 cm−1(★),1457 cm−1(▲) are the characteristic peaks of DTNB,44DP,and PHTH,which were,respectively corresponded to the target miR-21,miR-1246,and miR-126.Divide the SERS intensity in the presence of the target by the intensity in the absence of the target to get theR1/R0ratio.Compared to the SERS signal of control probes (blank),the Raman signal was reduced in the supernatant after adding a target miRNA.Furthermore,when in the presence of two different synthetic miRNAs,the SERS intensities of two homologous probes were decreased.Similarly,after three different synthetic miRNAs were added,the SERS intensities were reduced (Figs.4C and D).Therefore,multiple miRNAs could be detected simultaneously by these SERS-based assays.
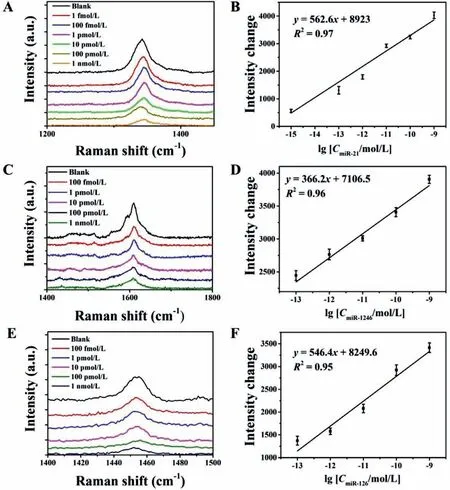
Fig.3.(A) SERS assay performance for the detection of different concentrations of miR-21.(B) Calibration graph of DTNB peak (1333 cm−1) versus the concentration of miR-21.(C) SERS assay performance for the detection of different concentrations of miR-1246.(D) Calibration graph of DTNB peak (1610 cm−1) versus the concentration of miR-1246.(E) SERS assay performance for the detection of different concentrations of miR-126.(F) Calibration graph of DTNB peak (1457 cm−1) versus the concentration of miR-126.Data are indicated as the mean ± SD.
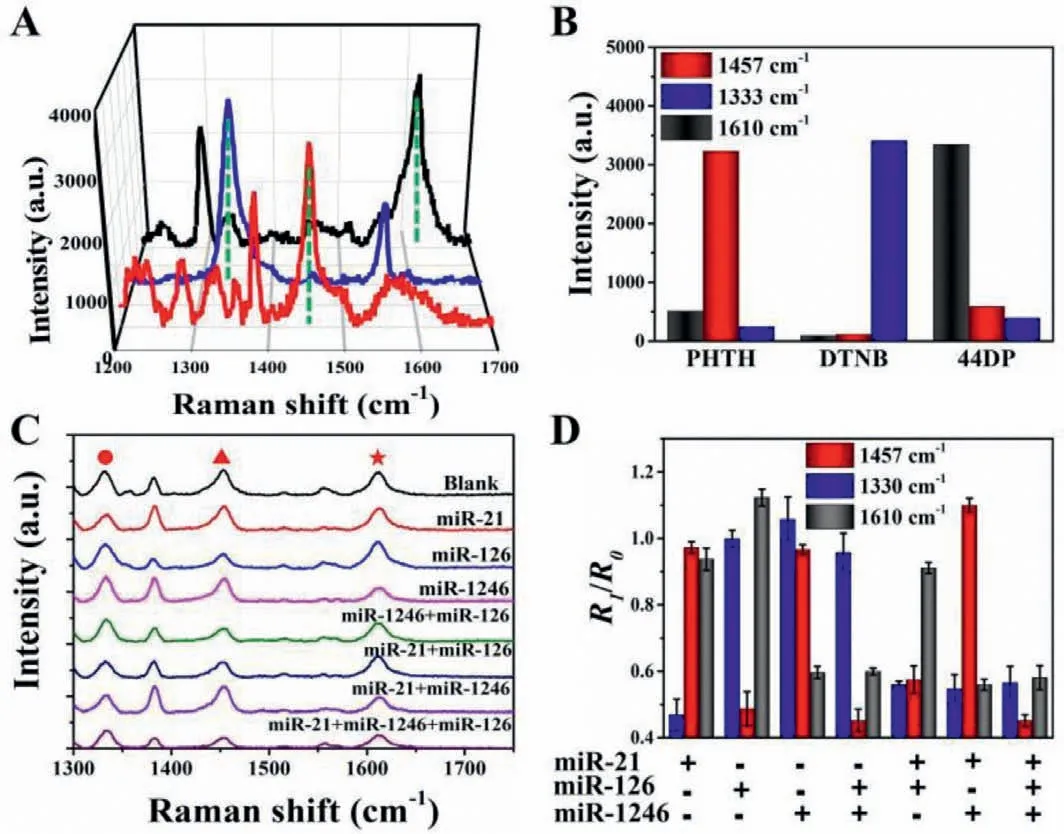
Fig.4.(A) SERS spectra of three Raman probes,which were prepared via the functionalization of DNA probe on Au@Au@Ag nanostructure encoded by DTNB,PHTH or 44DP.(B) The band intensities of three different Raman probes.(C) SERS sensor for the detection of miR-21,miR-126,miR-1246,miR-1246+miR-126,miR-21+miR-126,miR-21+miR-1246,and miR-21+miR-126+miR-1246.The mixture between capture probes and the SERS probes was used as a blank control.(D) The correlation analysis of SERS intensity in Fig.4C.
We further investigated the sensitivity of functionalized Raman probes in the detection of multiple miRNAs.Raman intensity of the typical peaks of DTNB-encoded probes,44DP-encoded probes,and PHTH-encoded probes was decreased with increasing concentrations of the miR-21,miR-1246,and miR-126.Fig.5A showed the quantitative detection of miR-21,miR-1246,and miR-126.As the concentration of miR-21,miR-1246,and miR-126 increased,the signal intensity of DTNB-encoded probes,44DP-encoded probes and PHTH-encoded probes in the supernatant was prone to be weaker,respectively.The LODs of the developed sensors for miR-21 (Fig.5B),miR-1246 (Fig.5C),and miR-126 (Fig.5D) was determined to be 1.076 fmol/L,4.57 fmol/L,and 0.068 fmol/L,respectively.As the signal amplification performance of above designed Raman probes,the SERS assay exhibited better capability in terms of sensitivity compared to the previously published literatures in Table S2 (Supporting information).Therefore,the SERS assay enabled highly sensitive quantification of multiplex miRNAs in one test.
To explore the feasible application in biological samples,the exosomal miR-21 was analyzed.There was not a significant difference in the SERS signal between diluted serum (20%) sample and buffer (Fig.S6 in Supporting information).Therefore,Raman probes had excellent anti-interference ability in serum.Afterward,we investigated the multiplex detection performance of our proposed method for exosomal miRNAs.TEM images and DLS analysis displayed that the size of the obtained exosomes size was about 150 nm and the morphology was round (Fig.6A),which matched very well with the published literature [6].The total RNA was extracted from exosomes obtained from MDA-MB-231 and HBL-100 cell culture supernatant.It was demonstrated that the expression levels of miR-21,miR-126,and miR-1246 in the MDA-MB-231 exosomes were higher than those of HBL-100 exosomes (Fig.6B).These results were in good accordance with previous reports [5],which suggested that this method had great potential in diagnosis application.
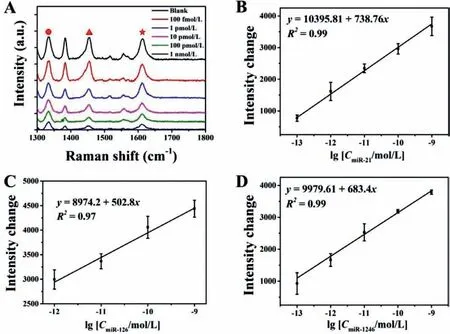
Fig.5.SERS biosensor for multiple-target detection simultaneously.(A) SERS spectra of the supernatant after adding miR-21,miR-126,miR-1246 with different concentrations.(B) Standard curve of the change in SERS signal (at 1333 cm−1) relative to the miR-21 concentration from 100 fmol/L to 1 nmol/L.(C) Standard curve of the change in SERS signal (at 1450 cm−1) relative to the miR-126 concentration from 1 pmol/L to 1 nmol/L.(D) Standard curve of the change in SERS signal(at 1610 cm−1) relative to the miR-1246 concentration from 100 fmol/L to 1 nmol/L.Data are denoted as the mean ± SD.
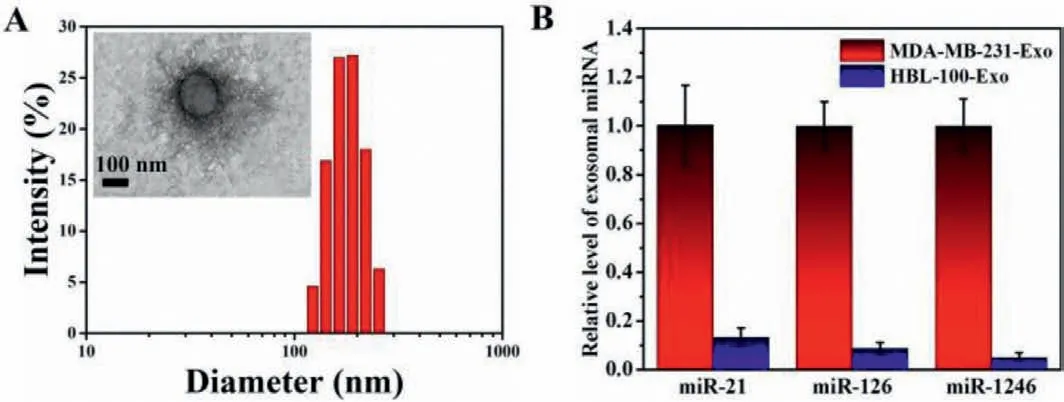
Fig.6.(A) DLS and TEM characterization of MDA-MB-231 exosomes.(B) SERS analysis of related expression levels of miR-21,miR-126,miR-1246 in MDA-MB-231 exosomes (MDA-MB-231-Exo) and HBL-100 exosomes (HBL-100-Exo).
We have developed a SERS assay for the detection of diseaserelated multiplex exosomal miRNAs.Such a SERS sensor consisted of asymmetric Au@Au@Ag nanoparticles with DNA probes as Raman probes and MB modified with capture DNA as capturing probes.The Raman probes can be effectively bound to the surface of MB by the sandwich hybridization in the presence of target miRNAs.Notably,three Raman probes were successfully constructed by introducing the different Raman signal molecules to the asymmetric Au@Au@Ag nanoparticles.Simultaneous and multiplex analysis of three target miRNAs was further performed by using different Raman probes as recognition signals.The LODs of miR-21,miR-1246,and miR-126 was determined to be 1.076 fmol/L,4.57 fmol/L,and 0.068 fmol/L,respectively.Therefore,the proposed SERS sensor can simultaneously detect multiple tumor-related exosomal miRNAs with high sensitivity and excellent selectivity,showing great potential for the early diagnosis of cancers.
Declaration of competing interest
The authors declare that they have no known competing financial interests or personal relationships that could have appeared to influence the work reported in this paper.
Acknowledgment
This work was supported by the Project of National Natural Science Foundation of China (Nos.21775036,21735002,21874035 and 22174044).
Supplementary materials
Supplementary material associated with this article can be found,in the online version,at doi:10.1016/j.cclet.2021.11.092.
 Chinese Chemical Letters2022年6期
- Chinese Chemical Letters的其它文章
- Photochemical defluorinative functionalization of α-polyfluorinated carbonyls via spin-center shift
- Methods of screening,monitoring and management of cardiac toxicity induced by chemotherapeutics
- Light-guided tumor diagnosis and therapeutics: From nanoclusters to polyoxometalates
- Nanofluidics for sub-single cellular studies:Nascent progress,critical technologies,and future perspectives
- Effective purification of oily wastewater using lignocellulosic biomass:A review
- Recent advances in microchip-based methods for the detection of pathogenic bacteria