
Microfluidic chip of concentration gradient and fluid shear stress on a single cell level
2022-07-11 03:39XuexiaLinJianlongSuShufengZhou
Chinese Chemical Letters 2022年6期
Xuexia Lin,Jianlong Su,Shufeng Zhou
Department of Chemical Engineering &Pharmaceutical Engineering,College of Chemical Engineering,Huaqiao University,Xiamen 361021,China
Keywords:Concentration gradient Fluid shear stress Single particle Computational fluid dynamics Microfluidic chip
ABSTRACT Concentration gradient and fluid shear stress (FSS) for cell microenvironment were investigated through microfluidic technology.The Darcy–Weisbach equation combined with computational fluid dynamics modeling was exploited to design the microfluidic chip,and the FSS distribution on the cell model with varying micro-channels (triangular,conical,and elliptical).The diffusion with the incompressible laminar flow model by solving the time-dependent diffusion–convection equation was applied to simulate the gradient profiles of concentration in the micro-channels.For the study of single cell in-depth,the FSS was investigated by the usage of polystyrene particles and the concentration diffusion distribution was studied by the usage of different colors of dyes.A successful agreement between model simulations and experimental data was obtained.Finally,based on the established method,the communication between individual cells was envisaged and modeled.The developed method provides valuable insights and allows to continuously improve the design of microfluidic devices for the study of single cell,the occurrence and development of tumors,and therapeutic applications.
Cell microenvironment has become an issue of major interest because it relates to the behavior and functions of cell,tissue and organ.Gradient and fluid shear stress (FSS) are the key components of the tumor microenvironment.Great efforts have been devoted to constructing the gradient and FSS of the microenvironmentin vitro.The integration of microfluidic technology is expected to a most significant technology for generation of chemical and physical gradient in a microfluidic chip because of its tight control of flow rate and maintaining spatiotemporal distribution.Microfluidic gradient generators are one of the most typical types of cell microenvironment simulators because of their wellcontrolled flow distribution and diffusion with laminar flow characteristics.Over the past decades,the gradient generator developed from the original T-channel to the tree-shape channel [1,2]and then derived from a variety of channels [3,4].These developed gradient generators have been widely employed to study tumor sprouting [5],soluble factors effect [6],hypoxic conditions[7]as well as other microenvironment factors inducing tumor angiogenesis [8].Most of these processes are also regulated by FSS from the extracellular matrix because flow inevitably generates FSS[9,10].Therefore,more and more attention has been drawn in recent studies on the response of cell to FSS.More importantly,microfluidic chip is one of the most powerful tools in the research of mechanical force such as FSS.The work of He and her co-workers has shown that FSS could enhance the specific cell endocytosis pathway and promote membrane protein internalization through the application of microfluidic technology [11].Fenget al.have reported that FSS enhanced the drug toxicity based on an integrated microfluidic platform microfluidic chip [12].Due to the high integration and dynamic cell culture,Abdalkader and his co-workers have even devised their technique to recapitulate the FSS of eye blinking [13].Although these systems seem to be well established for the investigation of the cell response to the gradient or FSS,systematic study on simultaneous investigation of the FSS and gradient analysis is still deficient,let alone the influence on the single cell level.
Microfluidic device has been a very suitable platform forinvitromimicking gradient and FSS microenvironment because it regulates critical elements such as diffusion,and precise control.A major challenge in the study of the gradient and FSS was to develop more accurate,more informative,and more predictive models than those which were currently available.The developed microfluidic chips have made major contributions to construct a gradient generator or FSS generator,ever to study the gradient and FSS inducing cell response or disease.But limited research of microfluidic technologies has been made on the intrinsic change of concentration gradient or/and FSS caused by the system in realtime,which would result in a defective model for further study.Numerical simulation can optimize the experimental project and effectively reduce the experimental cost and unnecessary reagent waste before microfluidic platform fabrication.More importantly,it can rapidly screen the designed microfluidic models,as well as predict the success or failure of many candidate models.Kobelet al.used fluid dynamics simulations in combination with particle image velocity to systematically optimize trap architectures,which greatly improved the capture efficiency of single cell and reduced the FSS on the captured cells [14].Cabaleiro designed a microfluidic concentration gradient generator shaped like the Christmas tree,and the numerical and experimental results of the chip show good agreement [15].Thus,the combination of the microfluidic technologies with numerical simulation could enhance the effectiveness of predicting the successful microfluidic chip for the investigation of the change of concentration gradient and FSS.
The main purpose of this work is to simultaneously study the concentration gradient and FSS on a single cell level based on the combination of microfluidic technology and fluid dynamics simulation.To the best of our knowledge,it is the first work combining both parameters on a single cell level.In the process,the generation of concentration gradients and the FSS on a single cell level was simulated,screened and evaluated by designing the channel length,the shape of the trap,and other parameters of the microchip.In accordance with the numerical simulation,a microfluidic chip for the investigation of single cell was made with a diffusion component and other micro-channels.Finally,the dispersed polystyrene particles (PS) and different colors of dyes were used to demonstrate the ability of the concentration gradient and FSS alternation on a single cell level,and the intercellular communication between two kinds of single cell was also simulated.This model is promising to further evaluate the performance of single cell in different tumor microenvironments and also can be a tool to study cell communication,heterogeneity and exploration of the occurrence and metastasis of tumors.
The main channel length (100,200 or 300 μm) and the shape(triangular,elliptical or circular) of the single cell trap in every unit were optimized by COMSOL Multiphysics 5.5 software.After parameters of the microchip were optimized,the microfluidic chip was manufactured using soft lithography as previously described[16].Briefly,the negative photoresist SU8–2035 (Microchem,MA,USA) was span on the silicon wafer at 2500 rpm for 40 s.After being baked (65 °C for 3 min,95 °C for 10 min) on a hot plate,the photoresist was covered by Cr photomask with structure design then exposed to UV light,and followed by post-exposure bake(65 °C for 3 min,95 °C for 9 min).Polydimethylsiloxane (PDMS)(base/curing agent ratio of 10:1) was poured onto the photomask and put into a vacuum oven to remove bubbles,and put in the oven at 70 °C for 2 h.Finally,the PDMS layer and a clean glass were plasma-treated for bonding.
COMSOL Multiphysics 5.5 software was used to simulate the performance of single cell capture,FSS and concentration diffusion.The flow field was obtained by solving the steady-state incompressible Navier-Stokes equation and the micro-channel walls were set as a no-slip boundary condition.The FSS distribution along the micro-channel wall can be computed using Eq.1:
whereτis the shear stress,μis the dynamic viscosity,dU/dzis the shear rate was obtained by replacing the formula of pressure result obtained by solving the Navier-Stokes equation in the COMSOL.
The FSS distribution on the cells and PS particles model surface was computed in COMSOL fluid-solid coupling module by Eq.2:

whereσis the stress tensor,then0corresponds to the undeformed surface element.Suspension cell and PS particles were modeled with a sphere of 16 μm in diameter.The umbonate morphology was used to model adherent cell,which has a maximum diameter of 16 μm and the maximum height of 5 μm.Both the models were set as elastic material and the properties of the cell model,PS particles model and perfusion medium were given in Table S1(Supporting information).
The concentration gradient distribution in the micro-channels was obtained by solving the Navier-Stokes equation,timedependent diffusion-convection in Eq.3.The concentration of the two inlet fluids is set to 100% (1.0,blue) and 0% (0.0,red),respectively.

whereC,u,D,∇are the concentration,flow velocity,diffusion coefficient,divergence respectively.
The 20 μm PS particles (Tianjin Bessler chromatographic technology development center,China) were diluted with the solution that contained 80% ultra-pure water and 20% ethanol followed by ultrasonic treatment for 10 min.The ultrasonic pretreatment could effectively avoid the agglomeration of PS particles.The PS particle solution was injected into the micro-channel through a flowing syringe pump.
For the study of the concentration diffusion,the blue solution was first injected through a flowing syringe pump at a flow rate of 0.019 μL/min,which is about 50 μm/s in micro-channel.After the blue solution filled the whole main micro-channel,the red solution was injected with the same flow rate.
One purpose of the microfluidic chip was to study the performance of the captured single cell.The microchip was composed of main micro-channel,resistance micro-channel and the single cell trap.The single cell was captured principle based on the least flow resistance path principle that was reported by Tan and Takeuchi [17].Using the Darcy-Weisbach equation to solve the Hagen-Poiseuille flow problem,for a rectangular micro-channel with a low aspect ratio (w≈h),the pressure drop is given by Eq.4:

whereC(α) is constantly defined by the aspect ratio,Qis the flow rate,μ is fluid viscosity,AandPare the cross-sectional area and perimeter of the channel,respectively.If the pressure drop is the same for O-A and O-B and O-A has a lower fluidic resistance than the O-B (Fig.S1 in Supporting information),the most of fluid will flow from junction O to A by higher flow rateQ1thanQ2:
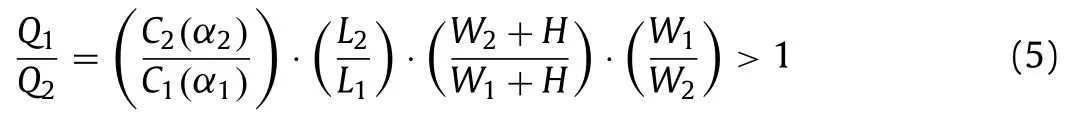
whereW1is the resistance micro-channel width,W2is the main micro-channel width,L1is the resistance micro-channel length,L2is the main micro-channel length.To effectively capture single cells and better cells survival,according to previous publications [15,17],the geometric dimensions of the chip as following:W1=8 μm,W2=25 μm,L1=5 μm,H=25 μm and the main channel length is 200 μm with flow ratio 2.3.TheC1(α1) value of resistance channel is 74.38 and the channelC2(α2) value is 56.91 [17].
In order to optimize the microchip structure,COMSOL was used to simulate the hydraulic resistance in the micro-channel,the FSS conditions that the cell model experienced,respectively.The fluid velocity is shown in Figs.1a-c.The flow rate ratio of different micro-channel lengths is shown in Fig.1d.The theoretic flow rate was calculated according to Eq.5.The average velocity across the section of the micro-channels was calculated by the surface average of the post-processing module in COMSOL,and then the flow rate of mode is calculated according to the formula (Eq.6):
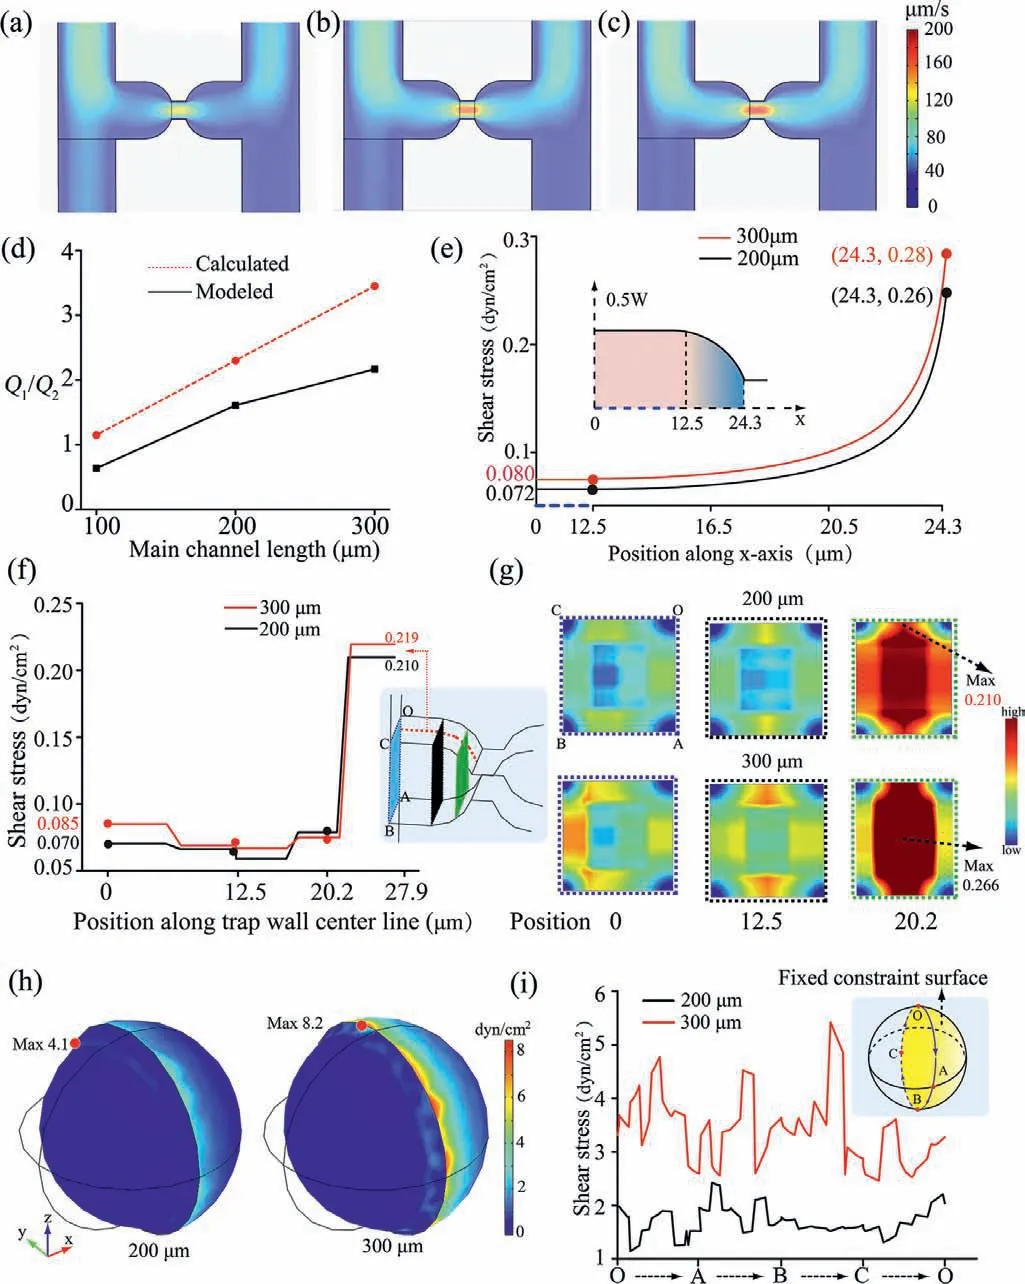
Fig.1.Velocity profiles of the three main micro-channel lengths: (a) 100 μm;(b)200 μm;(c) 300 μm.(d) Summary of flow rate data.The calculated (e) and modelsimulated (f) FSS distributions in the trap wall center line along a certain direction.(g) 2D graphics of cross-section FSS distribution from COMSOL 5.5 simulation.(h)3D graphics from COMSOL 5.5 simulation.(i) Captured cell model curved surface experienced the FSS distribution.The flow velocity at the inlet was set to 50 μm/s.The pressures at the outlets were set to 0 Pa.

The overall modeled trend was in accordance with theoretical calculation,while the discrepancy between theoretical calculated and modeled value resulted from the neglect of the hindrance from the of the micro-channel walls during the theoretical calculation process [13].The results showed that the flow rate ratio of the main channel with length of 200 and 300 μm was both greater than 1,indicating the single cell would be captured into the trap micro-channel because of more incoming fluid.
An increase in the flow rate ratio will lead to a significant increase of the FSS on the trapped cell.Thus,the FSS distributions on the trapped wall center line were analyzed and used data to extrapolate the FSS that cell experienced in the trap.For a dimensions channel,Eq.7 is generally used to calculate the FSS:
It is easily found that FSS is determined by the width of the trap.Further,the inlet center of the trap was defined as the origin to calculate the width of the circular arc region (Fig.1e).The position along x-axis andWis related through Eq.8:
whereris the radius of the circular arc.Substituting the Eq.8 into Eq.7,τcan be rewritten as:
The curve of Eq.9 is displayed in Fig.1e,showing that FSS increased as the length of micro-channel.The trends of FSS theoretical calculation (Fig.1e) were consistent with that of the results from model simulation (Fig.1f).It also indicated the trap with smaller width appeared to have higher FSS.Meanwhile,different position cross-sections (the blue,black and green rectangle in Fig.1f) were selected for further exploration of the FSS distribution of the trap inside.As a result we observed that as the width decreases,the FSS level increased from the edges of the wall to the center of the trap (BC edge in Fig.1g).This change rate is most obvious in chips with 300 μm long main micro-channel.However,the fluid pressure-driven FSS distributed on the cell surface is stronger than that on the cell-free micro-channels wall and large FSS may reduce cell viability [18].In order to directly measure the FSS distributions on cell surface,cells were modeled in COMSOL and then FSS was calculated by Eq.2.
Cells model and micro-channel domains were meshed using a free tetrahedral ultrafine mesh and a free triangular finer mesh,respectively (Fig.S2 in Supporting information).It was supposed that the hemispheroidal surface of cell model that was close to the resistance channel cannot move,and was defined as a fixed constraint (illustration in Fig.1i).The model simulation results indicated that the boundary of fixed constraint will cause larger FSS,and the FSS decreased from the boundary to the sides (Fig.1h).The FSS distributions along the boundary were analyzed (Fig.1i).It is evident that the magnitude FSS of the cells model experienced in the main micro-channel with 300 μm is about twice that in the main micro-channel with 200 μm.The maximum FSS of modeling in channels with both lengths is below the physiological FSS levels tolerance of vascular endothelial cells (∼10 dyn/cm2) [19].It is noteworthy that less FSS is beneficial for long term cell culture and high cell viability.Moreover,the FSS that cells experienced can be reduced by decreasing the flow velocity,and further decreased for the decreasing velocity along the main micro-channel since the captured cell cannot completely block the fluid flow.As a result,the subsequent captured single cell experienced a less FSS.Therefore,the length of the main micro-channel was taken as 200 μm for further study.
Trap shape with different geometries can produce different flow line that may introduce cells into different positions which can cause aggregation,and different FSS conditions that the cells experience during culture.Therefore,triangular [20],elliptical [21]and circular [22]traps which have been previously reported were simulated for single cell capture.The different trap shapes have the same length and width of the trap channel and main microchannel.As shown in Fig.2d,the calculation results of the flow ratio are consistent,because that is mainly determined by the resistance channel dimension,while the simulation results are different.In addition,triangular and elliptical trap shapes induced more focused streamlines than circular trap shape,facilitating the captured cell to occupy positions to more effectively block fluid flow(Figs.2a-c).After cells were captured and adherent in the triangular and elliptical trap shape,their experienced FSS was simulated.Adherent cells model was mashed using a free tetrahedral ultrafine mesh (Fig.S3 in Supporting information),and the bottom surface was defined as a fixed constraint,as shown in Fig.2f.As indicated in Fig.2e,the maxima of FSS occurred at the boundary.Fig.2f shows the FSS distributions along the boundary from which we can observe that the adherent cell model in the elliptical trap experienced less FSS than in a triangular trap.Furthermore,the adherent cell experienced much less FSS compared with suspension cell model.For most cultured cells,the maintenance of low levels of FSS is vital to the preservation of their viability and function and allows long term cell culture [23,24].On the other hand,the elliptical trap has more space compared with triangular trap for cell proliferation and differentiation.Therefore,the elliptical trap was selected for further study.From the simulation results above,our microfluidic chip can capture single cell in theory.
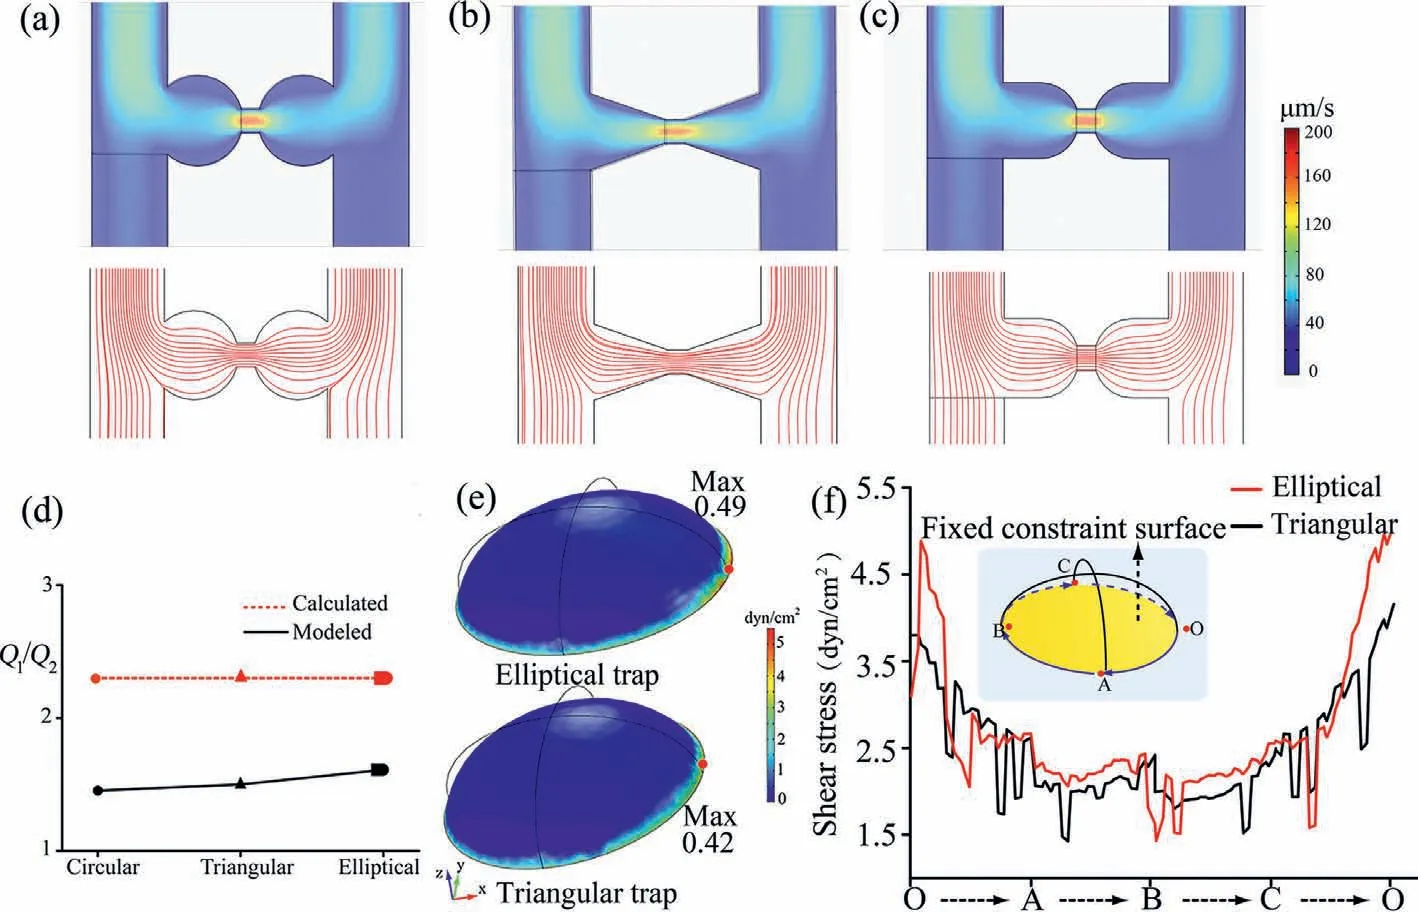
Fig.2.Velocity profiles and streamlines distribution of the four analyzed geometries: (a) circular,(b) triangular,(c) elliptical.(d) Summary of flow rate data.(e) 3D graphics of adherent cells model experienced FSS in elliptical and triangular trap shapes.(f) The adherent cells model bottom curve experienced FSS value.The flow velocity at the inlet was set to 50 μm/s.The pressures at the outlets were set to 0 Pa.
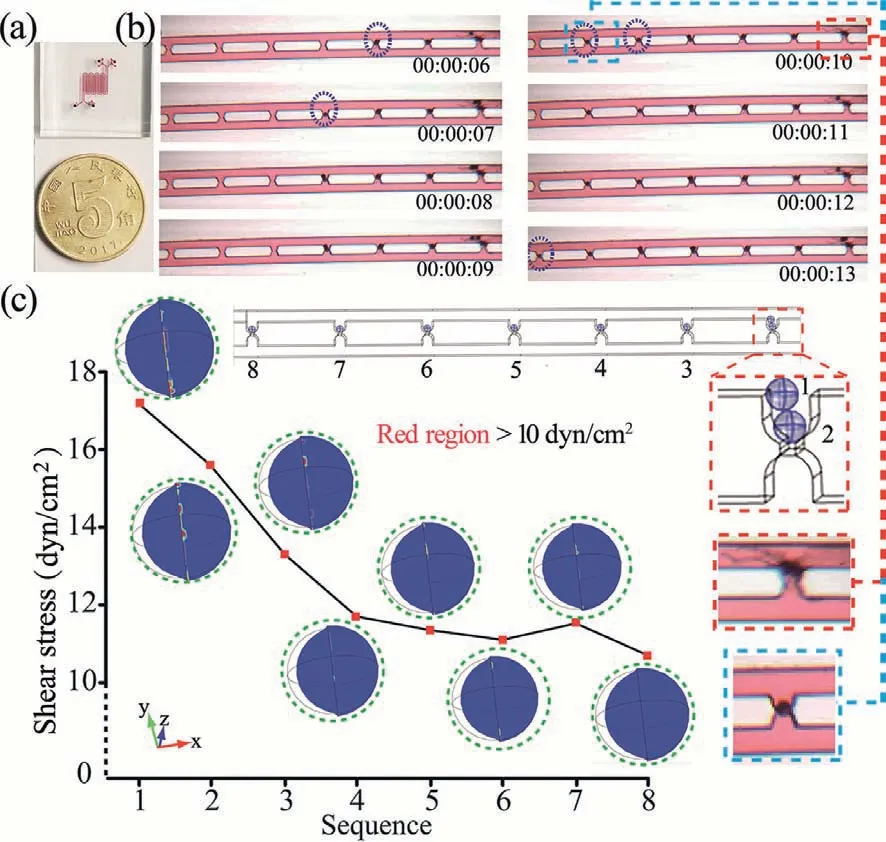
Fig.3.(a) The structure of the microchip.(b) PS particles loaded experiment.(c)COMSOL 5.5 simulation results.The flow velocity at the inlet was set to 50 μm/s.The pressures at the outlets were set to 0 Pa.
After these preliminary works,the PS particles were used as a model to demonstrate single particle/cell capture under the optimized modeled parameters.The actual device used in our experiments is shown in Fig.3a and Fig.S4 (Supporting information).The microfluidic chip contains 81 single cell pairing trap units that were completely consistent with the model constructed in the software.As shown in Fig.3b,the PS particle entered into the trap in sequence according to the principle of fluidic resistance.It was also observed that two PS particles aggregated in the first trap.Notably,as the PS particles capture increased,the morphology of two PS particles began to ropy compared with other captured PS particles as shown in Fig.3c.This phenomenon was considered to be tightly associated with FSS.Therefore,the PS particles were modeled in COMSOL according to their position in the traps (Fig.S5 in Supporting information).It was observed the FSS distribution in regions on the surface of PS particle 1 and 2 model is greater than 10 dyn/cm2,thus changing the morphology of PS particle.By quantifying the relationship between the max FSS and captured position the max FSS that PS particles model experienced was found to decreases as the PS particles trap increases.This phenomenon is related to the gradual decrease in flow velocity in the main microchannel.In this sense,the device has the capability to study FSS influence on the single cell level.The observed PS particles aggregation in other traps can be explained by that the microchannel is too high,so the redundant leakage after a particle occupies a trap caused too much fluid through,resulting in multiple particles in a trap.It was expected that the single capture efficiency can be improved by further optimizing the height of the chip or other experimental conditions.
After demonstrating that the microfluidic chip has the capability to capture the single particle/cell,we studied whether the concentration gradient can be formed.To answer this question,the modeling was developed to study the time dependent concentration.Fig.4a depicts the results of time-dependent concentrations of the two outlets.After 650 s the concentration gradient is full,reaching a steady state.Fig.4b shows the results of concentration diffusion of the fabricated microchip at 650 s.The full animation results of the time-dependent concentration study were shown in GIF S1 (Supporting information).The diffusion layer is driven downstream along the main micro-channel by fluid flowing and color change was observed.When liquid passes through the U-shaped micro-channel,the directions of diffusion on both sides changed,due to the change in resistance (Fig.4b).Combined with the velocity streamlines diagrams (Fig.S6 in Supporting information),it was speculated that the distribution of the dye in the main micro-channel was governed mainly by diffusion,whereas convection forces were dominant in trap.The concentration distribution results were further visually demonstrated by plotting the concentrations at the center of the semicircle of the 81 traps (The detailed trap unit sequence naming is shown in Fig.S7 in Supporting information) on both sides of the main channels (Fig.4c),respectively.Compared to traditional gradient systems [3,25,26],this microfluidic chip has capacity of generating multiple gradients with gradual change and a definite concentration gradient distribution.Therefore,the microfluidic chip has a good potential to test the response of single cell to a range of reagent concentrations or cell to cell communication mediation by molecules.For instance,this interesting concentration distribution is similar to calciuminduced calcium release wave propagation,while the frequency of Ca2+oscillations can control gene expression.Therefore,this microfluidic chip is expected to be feasible for understanding intracellular signaling and further studying the heterogeneity of cells[27].In addition,this time-dependent computational model made it possible to predict the time required to reach steady-state during the experiment,which was about 11 min at a flow velocity of 50 μm/s.To validate the model predictions,blue dye was injected by a flowing syringe pump.The resistance micro-channel led to a surface tension induced force resisting the fluid to enter another main micro-channel while the other inlet and two outlets of the chip were all open (Fig.4d1) [28].Then red dye was injected when blue dye liquid filled fully the whole main microchannel.Since main micro-channel was full of liquid,the resistance to flow is greater than the surface tension induced force,leading liquid flow through the resistance micro-channel.After about 12 min the gradient reached a steady-state (Fig.4d2).We further measured the average gray value in the trap from Fig.4d2,the relationship with the trap sequences was obtained by converting the gray value into a percentile (Fig.4e).As compared to the simulation results in Fig.1c,the change of concentration presented the same trend,but changed more gradually,respectively.This difference can be considered as that the simulation process would not take surface tension between two trap units that led to a more sufficient diffusion.Based on the above observation,the results of model prediction and experimental gradient profiles produced similar agreement.Taken altogether,it was demonstrated the designed microfluidic chip consists of multiplexing the analysis of FSS and gradient at a single cell level.
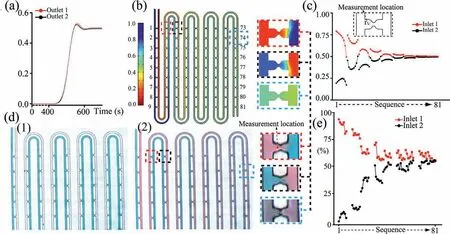
Fig.4.(a) Distribution of time dependent concentration values of the dye at the two outlets.(b) The COMSOL 5.5 software simulates the concentration diffusion 2D diagram.The color coded bar presents the colors as concentration values expressed as the percentage maximum concentration.(c) Simulation results of the relationship between gradient and trap sequence.(d) Dye diffusion diagram on both sides of the channel.(e) Experiment results of the relationship between gradient and trap sequence measured by Image J.The flow velocity at the inlet was set to 50 μm/s.The pressures at the outlets were set to 0 Pa.
The potential application of the microfluidic platform in intercellular communication of individual cell was studied.First,after the cells adhere,the velocity profiles of micro-channel were showed (Fig.S8a in Supporting information),and the second cell was captured for the modeled micro-channel withQ1/Q2=1.5507>1 (Fig.S8b in Supporting information).Once every single cell is captured on both sides of the resistance channel,one of the most important ways of intercellular communication is that the secretion of one cell diffuses into the extracellular medium,and is subsequently sensed by the neighboring cells.To simulate this process,the concentration of cell-secreted molecules is set to 100%(1.0,red) and the diffusion of the secreted molecule to the second cell type was analyzed.As shown in Fig.S8c (Supporting information),the concentration of cell-secreted molecules gradually increases downstream in the main channel.The concentration values that the second cell experienced were plotted (Fig.S8d in Supporting information).Interestingly,the adequacy of intercellular communication depends on the local concentration of cell-secreted molecules and molecules flow into the microchannel,resulting in multiple concentration gradients,which provide capacity for analysis of intercellular communication mediated by cellular secretions.For instance,previous studies have shown that carcinoma cells can secret a protease to induce soluble E-cadherin shedding in adjacent epithelial cells leading to epidermal growth factor receptor (EGFR) activation and the eventual trans-differentiation of the normal epithelial cells [29].However,the relationship between the concentration of protease and the carcinogenesis of normal cells is not clear.The fabricated microfluidic chip and the developed modeling would have the capacity to quantify this relationship.Therefore,one of very important applications of this modeling is envisaged to study the cell interaction between individual cells.
In summary,our study presented a microfluidic chip for the study of FSS and concentration gradient analysis at single cell level.Simulation computation was used to optimize the trap hydrodynamic conditions of different main micro-channel lengths and trap geometries,and determine the optimal microchannel geometry parameters.The FSS and concentration gradient were modeled and analyzed.The numerical result of single cell capture was validated by PS particles and the concentration gradient was validated by various kinds of colourant.The intercellular communication between individual cells was also modeling.Although more improvements including a variation of the trap unit number and flow velocity are required,the proposal has the potential to be exploited in the cell microenvironment to study human diseases,the occurrence and development of tumors,therapeutic resistance and therapeutic applications in a single cell level.
Declaration of competing interest
The authors declare that they have no known competing financial interests or personal relationships that could have appeared to influence the work reported in this paper.
Acknowledgments
This work was supported by National Natural Science Foundation of China (No.21804045),Fujian Provincial Department of Science and Technology (No.2019I0014),Promotion Program for Young and Middle-aged Teachers in Science and Technology Research of Huaqiao University (No.ZQN-PY612).
Supplementary materials
Supplementary material associated with this article can be found,in the online version,at doi:10.1016/j.cclet.2021.10.026.
 Chinese Chemical Letters2022年6期
- Chinese Chemical Letters的其它文章
- Photochemical defluorinative functionalization of α-polyfluorinated carbonyls via spin-center shift
- Methods of screening,monitoring and management of cardiac toxicity induced by chemotherapeutics
- Light-guided tumor diagnosis and therapeutics: From nanoclusters to polyoxometalates
- Nanofluidics for sub-single cellular studies:Nascent progress,critical technologies,and future perspectives
- Effective purification of oily wastewater using lignocellulosic biomass:A review
- Recent advances in microchip-based methods for the detection of pathogenic bacteria