
A time-coded multi-concentration microfluidic chemical waveform generator for high-throughput probing suspension single-cell signaling
2022-07-11 03:39YirnGuoPengChenZholongGoYiweiLiShunjiLiXiojunFengBiFengLiu
Chinese Chemical Letters 2022年6期
Yirn Guo,Peng Chen,Zholong Go,Yiwei Li,Shunji Li,Xiojun Feng,Bi-Feng Liu,∗
a The Key Laboratory for Biomedical Photonics of MOE at Wuhan National Laboratory for Optoelectronics-Hubei Bioinformatics and Molecular Imaging Key Laboratory,Systems Biology Theme,Department of Biomedical Engineering,College of Life Science and Technology,Huazhong University of Science and Technology,Wuhan 430074,China
b The Key Laboratory of Ministry of Education for Image Processing and Intelligent Control,School of Artificial Intelligence and Automation,Huazhong University of Science and Technology,Wuhan 430074,China
Keywords:Microfluidics Dynamic stimulation Time code High-throughput Single-cell array
ABSTRACT The cellular response to the complex extracellular microenvironment is highly dynamic in time and type of extracellular matrix.Accurately reconstructing this process and analyzing the changes in receptor conformation on the cell membrane surface and intracellular or intercellular signaling has been a major challenge in analytical chemistry and biophysical methodology.In this paper,a time-coded multiconcentration microfluidic chemical waveform generator was developed for the dynamic signaling probing with single-cell array of high temporal resolution,high throughput,and multi-concentration combination stimulation.Based on innovative microchannel structure,sophisticated external control methods and multiplexing technology,the system not only allowed for temporally sequential permutations of the four concentrations of stimuli (time code),but also generated pulsed and continuous waveforms at different frequencies in a highly controllable manner.Furthermore,the single-cell trap array was set up to effi-ciently capture cells in suspension,dramatically increasing throughput and reducing experiment preparation time.The maximum frequency of the platform was 1 Hz,and one cell could be stimulated at multiple frequencies.To show the ability of the system to investigate rapid biochemical events in high throughput,pulse stimulation and continuous stimulation of different frequencies and different time codes,combined with four concentrations of histamine (HA),were generated for probing G protein-coupled receptor(GPCR) signaling in HeLa cells.Then,statistical analysis was performed for the mean peak height and mean peak area of the cellular response.We believe that the time-coded multi-concentration microfluidic chemical waveform generator will provide a novel strategy for analytical chemistry,biophysics,cell signaling,and individualized medicine applications.
The cellular response to the complex extracellular microenvironment is highly dynamic in time.It consists of multiple intracellular and intercellular dynamic signals,including gene regulatory networks,cell signaling networks,protein interactions,cytokine concentration gradients released from neighboring cells,biochemical responses in the extracellular matrix,and cell-to-cell interactions [1–3].Such sophisticated and complex temporal dynamic signals are challenging to study using conventional static biological analysis methods.With the advent of many new technologies,it is scientifically important to simulate or reconstruct the complex and dynamic extracellular microenvironment and analyze the intra-or intercellular signaling to deeper understand the regulatory mechanisms of life at the cellular level [4].
The intracellular G protein-coupled receptors (GPCRs) mediated a series of key physiological eventsin vivo,through which various hormonal signals,as well as extracellular environmental stimulation,could be responded [5].Currently,with the flourishing development of structural biology,the three-dimensional (3D) fine structure of many GPCRs had been resolved by taking ultra-high resolution 3D photographs of GPCRs molecules with X-ray.However,their 3D structures were usually in a certain static state and their resolved environment was not the surface of living cells.Since the conformation of GPCRs was very unstable and "active",it was a hot and challenging issue to detect their dynamic conformational changes and the dynamics of their mediated downstream signaling molecules,such as the second messenger signal-calcium signal [6–10].How can cells recognize and sense dynamic extracellular signals (changes in the concentration and frequency of signal molecules) with high fidelity through GPCRs in the complex and dynamic extracellular environment? How do cells process and decode extracellular signals? Based on the resolved 3D structure of GPCRs,a profitable way to study the signaling pathway of GPCRs was combining the dynamic administration of multiple drug (ligand) stimuli outside living cells with optical imaging and molecular biology labeling tools to observe the conformational dynamics and dynamic response of intracellular signaling molecules.
High resolution of dynamic signaling pathways in GPCRs often requires two key technologies: high-resolution signal detection and highly controlled perturbation of the extracellular environment.The former had been developed rapidly [11–15],but the latter still faced many challenges.Traditional methods for extracellular environment manipulation were mainly based on microperfusion [16],but the drawback was the inflexible solution switching.Microfluidic chip-based cell stimulation had many advantages,such as fast solution switching time (as fast as sub-microsecond level),high solution controllability,and high temporal resolution,making it one of the most favorable platforms for studying intracellular dynamic signals [17–23].In 2001,Takayamaet al.successfully implemented localized cellular drug delivery using microfluidic laminar flow technology.For the first time,they explored the relationship between intracellular mitochondrial movement and cytoskeleton,extending the microfluidic cell biology research to the subcellular domain [24].The method was simple,controllable,and nondestructive to cells and was being adapted and improved by other scientists rapidly,becoming the most favorable method for microfluidic cell biology research.Since cells were in a complex dynamic environment under physiological conditions,cell biology research had evolved from static stimulation to dynamic stimulation,which facilitated realistic simulation of the physiological environmentin vivo.It was able to obtain data that was not available from static stimulation as well [25–29].Sabounchiet al.first introduced the traditional rapid perfusion technique to microfluidic chips using negative pressure in the side channels to immobilize cells.The drug flowed over the immobilized cells for rapid stimulation from the upstream channels [30].The use of negative pressure,however,might affect the cells.Hersenet al.then used a pneumatic pressure-driven fluid to generate a square wave signal for rapid switching to study the effect of dynamic osmolarity square wave stimulation on yeast cells [31].Still,the stability of the rapid switching process needed to be improved.Kinget al.proposed a signal generator method based on laminar flow-encoded switching (FES),which was used to study the effect of tumor necrosis factorα(TNF-α) on NF-κB transcriptional activation and apoptosis at different times in a high-throughput and efficient manner[32].Chingozhaet al.gave dynamic external stimulation based on captured single-cell arrays to detect changes in calcium signals in T cells with high throughput and more homogeneous stimulation[33,34].In addition,various capture structures on the chip were developed for investigating single cells,particularly single suspension cells [35–41].Each of these microchip technologies had its advantages,but achieving multiplexed cellular dynamic drug stimulation and thus studying intracellular dynamic signaling response remains a significant challenge.
Recently,our group proposed a precise and sensitive hydrodynamic gating technique and a number of optimized versions that could generate richly varied chemical stimulation patterns to obtain intracellular signals,while ensuring high temporal and spatial resolution and high accuracy [42–45].To probe single-cell dynamic signals,a new concentration gradient generator with a multi-channel synchronized hydrodynamic gating technique was developed to generate a series of chemical waveforms with different amplitudes and frequencies,and enabled multi-set of experiments in parallel [46].This paper proposed a new method to probe single-cell dynamic signals based on a microfluidic chip with a time-coded multi-concentration chemical waveform generator.The system had four independent sample inlets,which could encode four different concentrations of drugs at different frequencies and in different time sequences to study the dynamic response of cells.By adjusting the order of encoding,the platform enables both continuous and pulsed waveform stimulation.Cell trap array set up in the stimulation channel allowed for rapid capture of suspension single cells,simplified experimental preparation,and increased ease of operation.
The system device consisted of five independent E/P transducers (T-2001,Bellofram,USA) as multi-channel pressure control module,a LabVIEW program as signal control module,and a microfluidic chip (Fig.1a).The E/P transducers were output to each of the four sample inlets and two buffer inlets of the microfluidic chip with 0.1% accuracy,thus controlling the fluid switching within the microchip.The dynamic chemical signals with different frequencies were regulated with the outputs of a voltage output module(NI-9264,National Instruments,USA) which was controlled by a program in LabVIEW (National Instruments,USA).
A polydimethylsiloxane (PDMS)-glass hybrid microchip with a cell trap array was designed.The main channel of the chip was shown in Fig.1b,and it was axisymmetric.The reservoirs S1–S4,B1,B2,O1–O3 corresponded to sample inlet 1,sample inlets 2–4,buffer inlets 1,2,outlets 1–3.The channel height was approximately 30 μm.The widths of the corresponding channels were labeled in Fig.S1 (Supporting information),while the widths of all other channels were 200 μm except for the labeled channels and their symmetric channels.Fig.1c showed the cell trap array in the channel,which was marked with red box in Fig.2a.Its detailed dimensions were shown in Fig.1d,there was a 3 μm gap between the capture structure and the bottom glass slide.The working principle of the trap was: when the cell was not captured,the solution could pass through the gap;once a cell was captured,the gap will be blocked by the cell,and the solution would bypass the capture structure on both sides,which ensured that there was one and only one captured cell per capture structure (Fig.1e) [47].To obtain the cell trap array,the chip was fabricated using an overlay technique.Correspondingly,two masks were used,as shown in Fig.S2 (Supporting information).The first mask (Fig.S2a) could produce the gap between the capture structure and the slide,and the second mask (Fig.S2b) was the main channel of the microchip.The key to accomplishing a more ideal overlay operation was that the graphics of the two exposures should overlap as much as possible,which required a more skillful operation technique.
Before sample injection,the chip channel needed to be treated so that the cells could enter smoothly.First,the fabricated PDMSglass hybrid microchip was placed in a plasma cleaner with the voltage set to 800 V for 2 min,which increased the hydrophilicity of the inner surface of the microchannel.After cleaning,a 75%ethanol solution was quickly added to all reservoirs.The ethanol solution played a role in sterilization and maintained the hydrophilicity inside the channels.Subsequently,the microchip was placed in the ultra-clean bench and irradiated with ultraviolet light for 30 min.Then,the chips would be further cleaned in the ultraclean bench with ethanol solution and cell culture medium under negative pressure with a syringe.This step was repeated three times.
Numerical simulation was used to make the chip design optimized,by visualizing the concentration distribution at different stimulation states.Two-dimensional numerical simulations based on the finite element method (FEM) were performed on the modeling software COMSOL Multiphysics (COMSOL AB,Sweden).The modeled fluids were set up as a laminar flow model and a dilute matter transfer model [46].Typical results of the concentration distribution of the FEM simulation were shown in Fig.2.The four stock liquids A–D were different concentrations of fluorescein solution,and the concentrations were set to 1–4.Figs.2a–d showed the concentration distributions of solutions A–D in the stimulation phase,respectively.
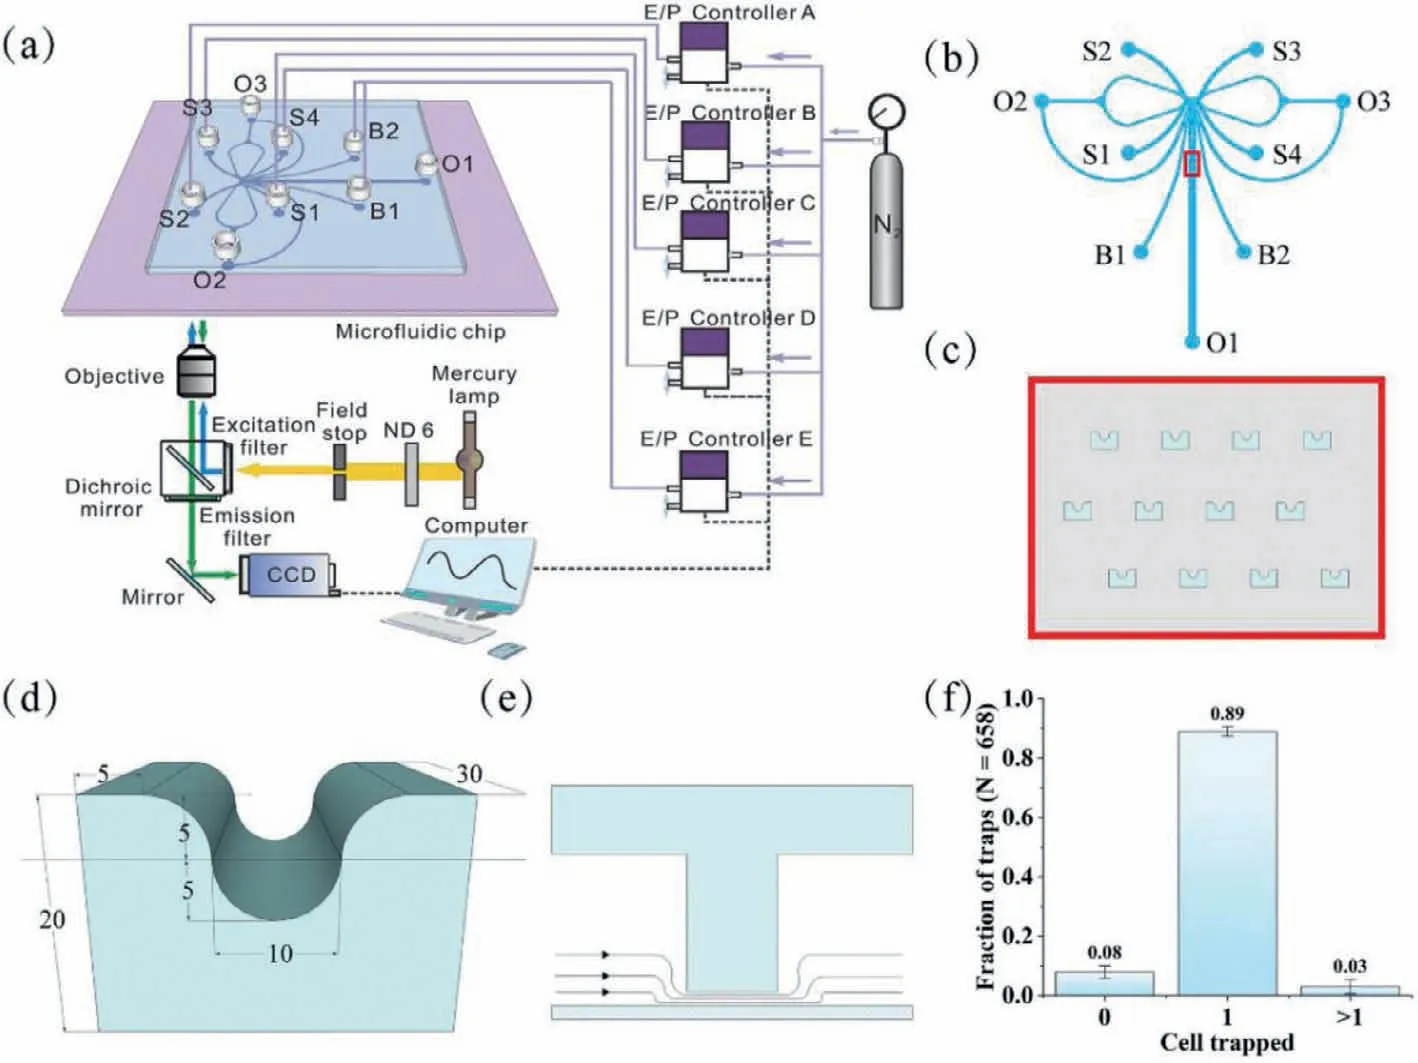
Fig.1.Schematic of the experiment setup and microfluidic chip design.(a) Schematic of the experiment setup.The light path was represented by color lines with arrows.Fine purple lines denoted pneumatic connections,and dashed lines represented the electrical connection.(b) The design of channels.(c) A larger image of the area marked with the red box in (a).(d) The cell trap construction.The dimensional units in the figure were in μm.(e) The section of the cell trap.(f) Capture efficiency.
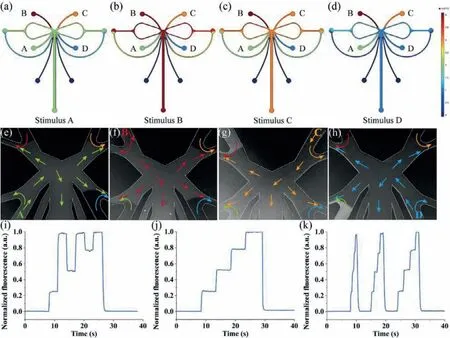
Fig.2.System evaluation.(a–d) The simulation result of the device concentration profile of stimulus A–D,respectively.(e–h) Results of the flow visualization experiments corresponding to (a–d).(i) A constant fluorescein injection time of 3 s,and the time code of the four solutions was ADBDCD.(j) A constant fluorescein injection time of 3 s,and the time code of the four solutions was ABCD.(k) Test of the limiting temporal resolution.
To test the stability,reproducibility,and limiting temporal resolution of the system,fluorescein solutions were used to evaluate the system.150 μL fluorescein solutions with concentrations of 0,10,20 and 30 μmol/L were introduced to the reservoirs S1–S4 of the microfluidic chip,respectively.For the convenience of description,these four solutions were named solutions A–D.Equal volumes of Hank’s balanced salt solution (HBSS) were introduced to reservoir B1 and B2.The evaluation experiments were performed with an inverted fluorescence microscope,and approximately 300 μm downstream of the gating structure was selected as an observation area for waveform image acquisition.The actual results of stimulation A–D were shown in Figs.2e–h in turn,which was corresponding to Figs.2a–d.The flow direction of the four solutions was indicated by the green,red,orange,and blue arrows,respectively.Since switching the pressure of each inlet allowed precise control of the frequency,the system could generate a variety of time-coded waveforms at various frequencies and concentrations.Some of the typical waveforms were shown in Figs.2i and j: (i) A constant injection time of 3 s for each solution,and the time code was solution ADBDCD;(j) a constant injection time of 5 s for each solution,and the time code was ABCD.More time codes for different frequencies,concentrations,and even different drugs could be generated on demand.To further understand the limiting temporal resolution of the system,a series of coded waveforms was generated with short to long periods (Fig.2k).The stimulation periods of individual stimuli for the three waveforms were 0.5,1 and 2 s from left to right.Obviously,no plateau appeared when the stimulation period was 0.5 s,which means that stable stimulation could not be achieved at this frequency.When the period was 1 and 2 s,a stable stimulation could be formed.Therefore,it could be determined that the limiting temporal resolution of the platform was 1 Hz.
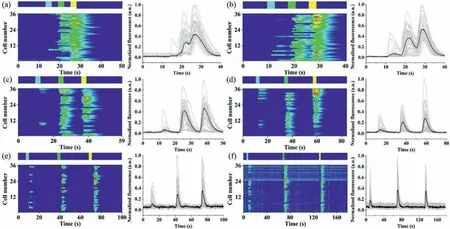
Fig.3.Detecting single-cell dynamic response to histamine pulse stimulation of a constant time code and different frequencies.The fluorescence change in single cells(Fluo-4-loaded HeLa cells) was showing on heat maps (left) and time plots (right).The vertical coordinates in the heatmaps mean the number of cells tracked for analysis,and each gray line in the time plots represented a single cell response,while the black line represented the average cell response.The concentrations of solutions A–D were 10,20,30,and 0 μmol/L,respectively.(a–f) Single-cell responses to stimulus A–C with constant time code ADBDCD,constant inject time of 3 s,and various buffer time of 3 s,5 s,10 s,20 s,30 s,and 60 s,respectively.The striped band above each heat map indicated the stimulation time A (sky blue),B (green),C (yellow),and buffer time(dark blue) of the ordered stimulations.
To test the single cell capture effect of the system,HeLa cell suspension at a concentration of about 1 × 10⁶cells/mL was fed to evaluate the system.150 μL of cell suspension was introduced to reservoir B1 and B2 of the chip,and the same volumes of HBSS were added to reservoirs S1–S4.A small air pressure (about 0.1 kPa) was applied at reservoirs B1 and B2,and the cell suspension would rapidly flow into the cell trap array channel and be captured.The capture process could be completed in approximately 2,3 min.Typical results of capturing single cells were shown in Fig.1f.A statistical analysis of the cell capture of 327 traps showed that 3% of the capture structures captured no cell,89% captured single cells,and 8% captured two or more cells.In other words,about 97% of the traps captured cells,and the percentage of which captured single cells was as high as 92%,showing the excellent ability to capture single cells.
The dynamic responses of HeLa single-cell arrays were first studied by pulsed stimulation of the same time code and different frequencies.Histamine (HA) was the chemical stimulus.Sample inlets S1–S4 were added with 150 μL of HA solutions at concentrations of 10,20,30 and 0 μmol/L,respectively,denoted as solutions A–D for the convenience of description.Buffer inlets B1 and B2 were both added with 150 μL of HBSS.In the buffer state,the inlets B1 and B2 were under high pressure,making the buffer solution fill the cell array channel.When the stimulation started,the S1 inlet pressure was increased momentarily and the inlets S2–S4,B1 and B2 pressures were decreased,making the HA solution fill the cell array channel.The concentration of cytoplasmic Ca2+was recorded by charge-coupled device (CCD) camera real-time imaging with Fluo-4/AM.The time code used for the experiments was ADBDCD.Heat maps (left) and corresponding time plots (right) of the response of single cells to different frequencies were shown in Fig.3,and 36 single cells were selected for tracking in each plot.In the single stimulation from Figs.3a–f,the injection time of solution ABC was 3 s and kept constant;the injection time of solutionD(the buffer time) gradually increased,followed by 3,5,10,20,30 and 60 s.When the buffer time was short (3 s),the responses of the three stimuli were continuous,and no independent response was generated.Starting from 5 s,an independent signal peak appeared for each stimulus response.Since the concentration of the three stimuli was sequentially increasing,the number of responding cells was also increasing.
Analysis of the mean intensities of the three responses in each plot was shown in Fig.4,which revealed that the mean response of the cells increased with increasing stimulant concentration,regardless of the buffer time.However,the response intensities of 20 μmol/L and 30 μmol/L HA became increasingly similar as the buffering time increased (Figs.4a–f).As shown in Figs.4c–f,the response intensity of the cells was significantly enhanced when the stimulation concentration was increased from 10 μmol/L to 20 μmol/L.However,when the concentration was increased from 20 μmol/L to 30 μmol/L,there was only a slight increase in response intensity,and responses of 20 μmol/L were even greater than 30 μmol/L.It also confirmed that the optimal concentration(25 μmol/L) of HA did exist,which was reported in the previous study of our group.
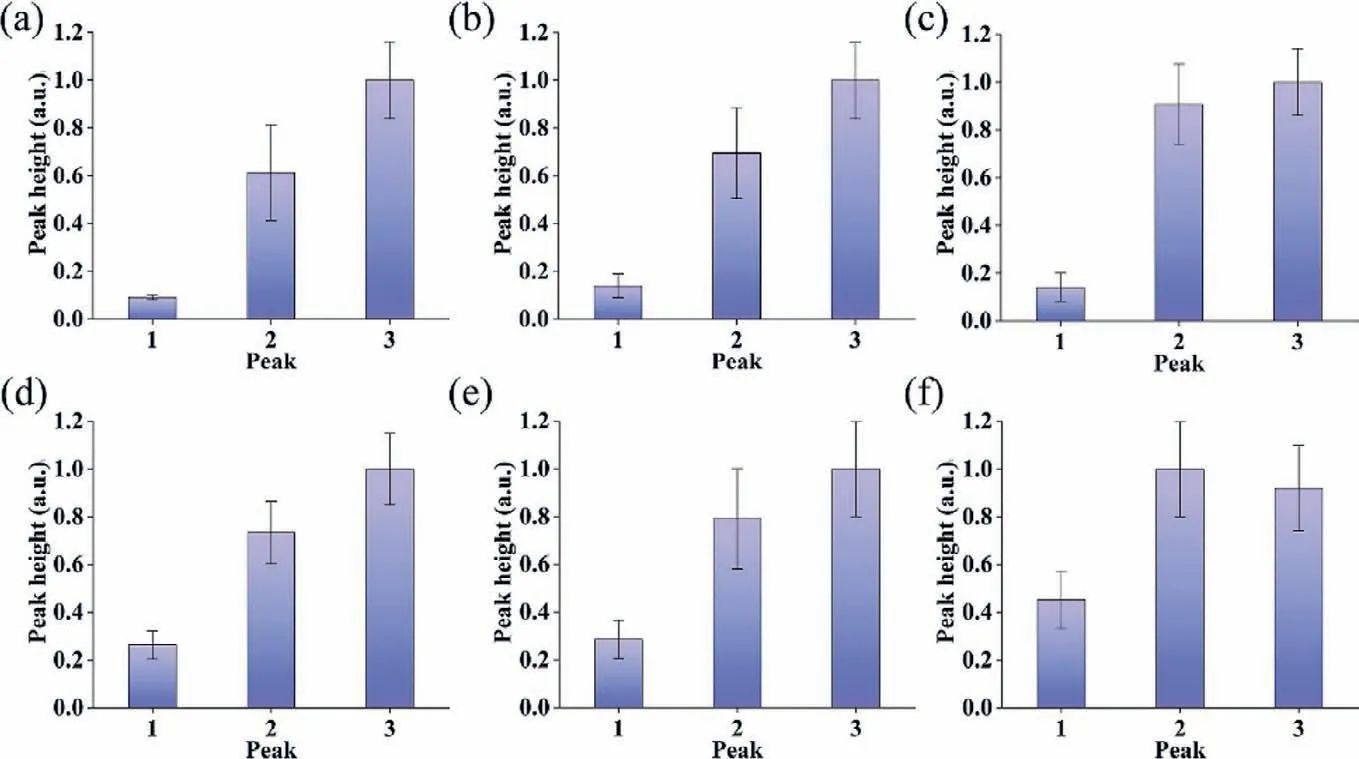
Fig.4.The peak heights of the average responses of single-cell response to histamine pulse stimulation of a constant time code and various frequencies.(a–f) The peak heights corresponded to Figs.3a–f.
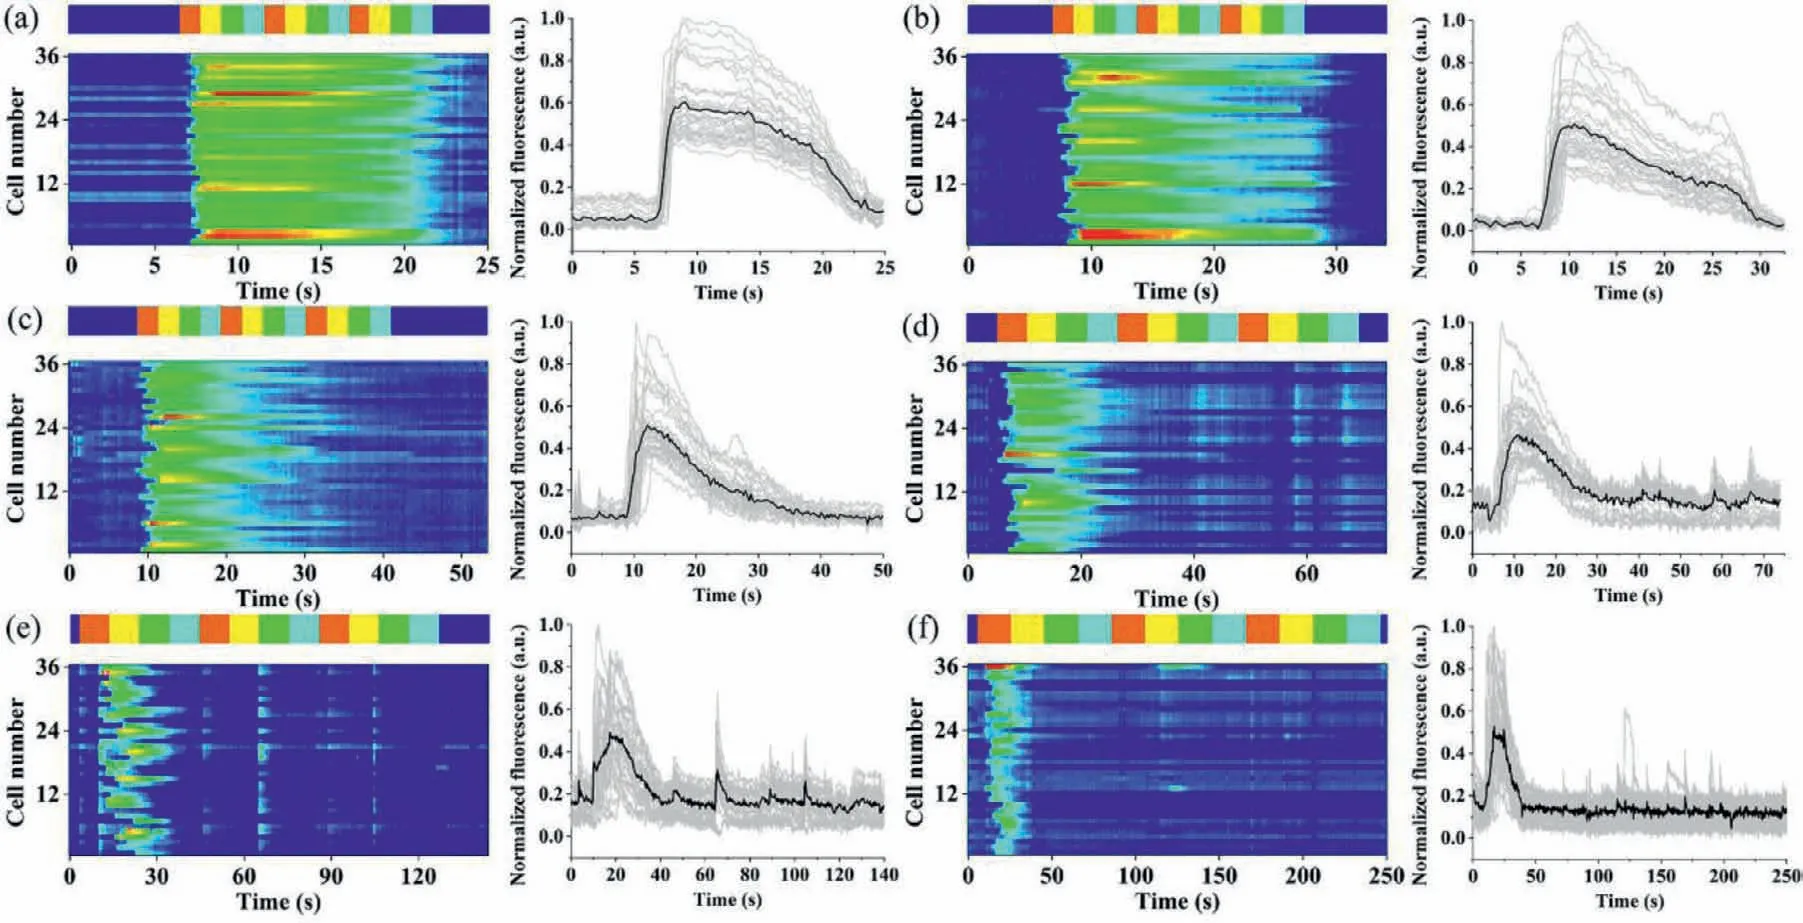
Fig.5.Detecting single-cell dynamic response to histamine continuous stimulation of a constant time code and different frequencies.The fluorescence change in single cells(Fluo-4-loaded HeLa cells) was showing on heat maps (left) and time plots (right).The vertical coordinates in the heatmaps mean the number of cells tracked for analysis,and each gray line in the time plots represented a single cell response,while the black line represented the average cell response.The concentrations of solution A–D were 10,20,30,and 40 μmol/L in turn.(a–f) Single-cell responses to stimulus A–D with constant time code ABCABCABC,and various stimulation time of 1–3 s,5 s,10 s,and 20 s,respectively.The striped band above each heat map indicated the stimulation time A (red),B (yellow),C (green),D (sky blue),and buffer time (dark blue) of the ordered stimulations.
The platform could generate not only pulse waveforms of different frequencies with the same timing code,but also continuous waveforms.In the experiment,sample inlets S1–S4 were added with 150 μL of HA solutions at concentrations of 10,20,30 and 40 μmol/L,respectively,denoted as solutions A–D for ease of description.Buffer inlets B1 and B2 were both added with 150 μL of HBSS.In the buffer phase,the inlets B1 and B2 were under high pressure,which made the buffer solution fill the cell array channel.When switching to the stimulation phase,the pressure of S1 inlet was increased momentarily,and the pressures of inlet S2–S4,B1 and B2 were decreased,making the HA solution fill the cell array channels.The experiments were performed using a time code of solution ABCD and repeated three times consecutively.The heat maps (left) and time plots (right) of the single-cell response to different frequencies were shown in Fig.5,with 36 single cells selected for tracking in each graph as well.The single stimulation periods from Figs.5a to f gradually increased,in the order of 1–3,5,10 and 20 s.It could be seen that the cell response tended to enhance and then weaken during the stimulation process,regardless of the stimulation period.When the stimulation time was short(Fig.5a),many cells responded to each stimulation.As the stimulation period increased (Figs.5b and c),the number of cells responding in the late stimulation period gradually decreases.However,when the stimulation cycle grew further (Figs.5d–f),the cells again appeared to respond intermittently.The possible reason was that,at the beginning,when the cellular stimulus did not reach the optimal concentration,the cellular response increased with the increase of the stimulus concentration.As the stimulation continues,the cells became desensitized and the response gradually decreases.When the period was further increased,the cell state was slightly restored and a weak response appeared again.
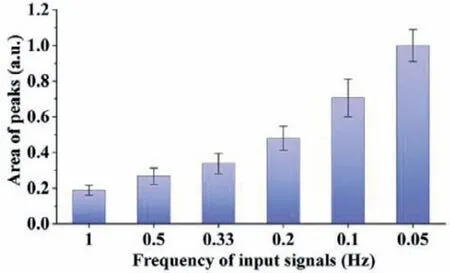
Fig.6.The peak area of the average single-cell response to histamine continuous wave of a constant time code and various frequencies.
The peak area of the average response throughout the stimulation process was analyzed in Fig.6,and it was found that the peak area of the average cellular response tended to increase with the increase of the stimulation period.In other words,although the cellular response appeared to be very weak in the late phase of long-duration stimulation from the single-cell plots,it was still evident that more cellular calcium responses appeared in the longduration stimulation.
In summary,we proposed a microfluidic platform with a timecoded multi-concentration generator combined with a single-cell trap array,which enabled the study of dynamic response in a single cell by generating chemical waveforms of multiple concentrations with different time codes and various frequencies simultaneously.To verify the stability,reproducibility,and applicability of the platform,numerical simulations,flow visualization experiments,and limiting time resolution evaluations were performed.The platform had a maximum frequency of 1 Hz and allowed stimulation of one cell at multiple frequencies.HeLa cells were chosen to be the study model,and pulsed chemical waveform and continuous chemical waveform at different frequencies with different time codes were successfully implemented.As a proof of concept,only two coding modes for four concentrations of stimuli were shown here.However,the platform was much more than that,and could also perform multiple modes of coding for different kinds of stimuli according to the experiment’s needs.We believe that this platform will provide new methods and ideas for probing dynamic cell signaling and elucidating cell signaling pathways.
Declaration of competing interest
The authors declare no competing financial interest.
Acknowledgments
The authors gratefully acknowledge the financial support from the National Natural Science Foundation of China (Nos.22074047,21775049 and 31700746),the Hubei Provincial Natural Science Foundation of China (No.2020CFB578) and the Fundamental Research Funds for Central Universities,HUST (Nos.2020kfyXJJS034 and 2021GCRC056).
Supplementary materials
Supplementary material associated with this article can be found,in the online version,at doi:10.1016/j.cclet.2021.09.080.
 Chinese Chemical Letters2022年6期
- Chinese Chemical Letters的其它文章
- Photochemical defluorinative functionalization of α-polyfluorinated carbonyls via spin-center shift
- Methods of screening,monitoring and management of cardiac toxicity induced by chemotherapeutics
- Light-guided tumor diagnosis and therapeutics: From nanoclusters to polyoxometalates
- Nanofluidics for sub-single cellular studies:Nascent progress,critical technologies,and future perspectives
- Effective purification of oily wastewater using lignocellulosic biomass:A review
- Recent advances in microchip-based methods for the detection of pathogenic bacteria