
Waste-to-wealth: Functional biomass carbon dots based on bee pollen waste and application
2022-07-11 03:38FeishiShanLijuanFuXiangyuChenXiangyanXieChengshuangLiaoYinxiaZhuHaoyuXiaJingZhangLiYanZhouyuWangXiaoqiYu
Chinese Chemical Letters 2022年6期
Feishi Shan,Lijuan Fu,Xiangyu Chen,Xiangyan Xie,Chengshuang Liao,Yinxia Zhu,Haoyu Xia,Jing Zhang,Li Yan,Zhouyu Wang,Xiaoqi Yu
Department of Chemistry, School of Science,Xihua University, Chengdu 610039, China
Keywords:Waste-to-wealth Biomass carbon dots Bee pollen Plant growth regulation Application
ABSTRACT Waste utilization is not only the protection of the environment and the practice of green chemistry,but also one of the ways to develop new materials.Herein,we report two biomass carbon dots which prepared from bee pollen waste by one-step hydrothermal method.The new two carbon dots were used in sensing,cell imaging and plant growth regulation.The differences in the structure and properties of the two carbon dots were evaluated by TEM,XPS,TG and various spectroscopic methods.Both two carbon dots contain abundant functional groups,polyatomic doping,excellent water solubility and stable photoluminescence.Due to these good properties,we have demonstrated its versatile applications in Fe3+sensing,cell imaging and plant growth regulation.It shows sensitive and specific Fe3+ responsiveness and good biocompatibility.This research provides a green and simple method for the recycling and reuse of bee pollen waste,and also provides a reference for the application of biomass carbon dots.
Carbon dots (CDs),a novel carbon nanomaterial,have attracted the attention and research of many scholars due to their outstanding applications in analytical sensing [1–8],bioimaging[9–13],photocatalytic [14–17]and plant growth regulation [18–22].Biomass carbon dots (BCDs) are carbon dots prepared with biomass as a precursor.As one of the branches of CDs,its performance and application should not be underestimated.There are many reports on the preparation of biomass into CDs [23,24].But if biomass waste can be directly developed into CDs functional materials,this will become a very attractive resource recovery program,which also conforms to the idea of green chemistry.The World Bank has estimated that by 2025,the amount of bio-waste in urban areas around the world may reach 2.2 billion tons per year.The most common biological waste disposal methods are microbial decomposition,thermal degradation and landfill.The facts show that the realization of the green application of biomass waste is imminent [25].
China is a large cole planting country.As of 2019,the national planting area is as high as 6,5830.9 km2.Bee pollen (BP) is rich in amino acids,flavonoids and carbohydrates [26].Among them,brassinosteroid is one of the essential active substances in bee pollen,and it has recognized as a highly effective,broad-spectrum and nontoxic plant growth regulator.Every year,brassinosteroid was extracted from BP,and the amount of BP waste after extraction is staggering.However,the waste still contains a large amount of organic matter.The preparation and application of the waste into CDs is the recycling and reuse of resources and alleviating environmental pollution to a certain extent,which has significant research value.
Herein,we report two BCDs,which prepared from BP waste after extracting 14-hydroxylated brassinosteroid and pollen polysaccharide,and their applications for Fe3+sensing,cell imaging and plant growth regulation.As shown in Scheme 1,we obtained two kinds of BP waste.One is the pollen (WBP) after extracted with water,and the other is the pollen (EBP) extracted with ethanol.After hydrothermal treatment at 180 °C for 24 h,we obtained some brown suspension after filtration of the product to remove the insoluble residues.The filtrate was dialyzed against a dialysis bag with a molecular weight cut-off of 1000 for 48 h.During the dialysis process,the water was changed 3 times.Two kinds of BCDs are obtained after freeze-drying (WBCDs and EBCDs).
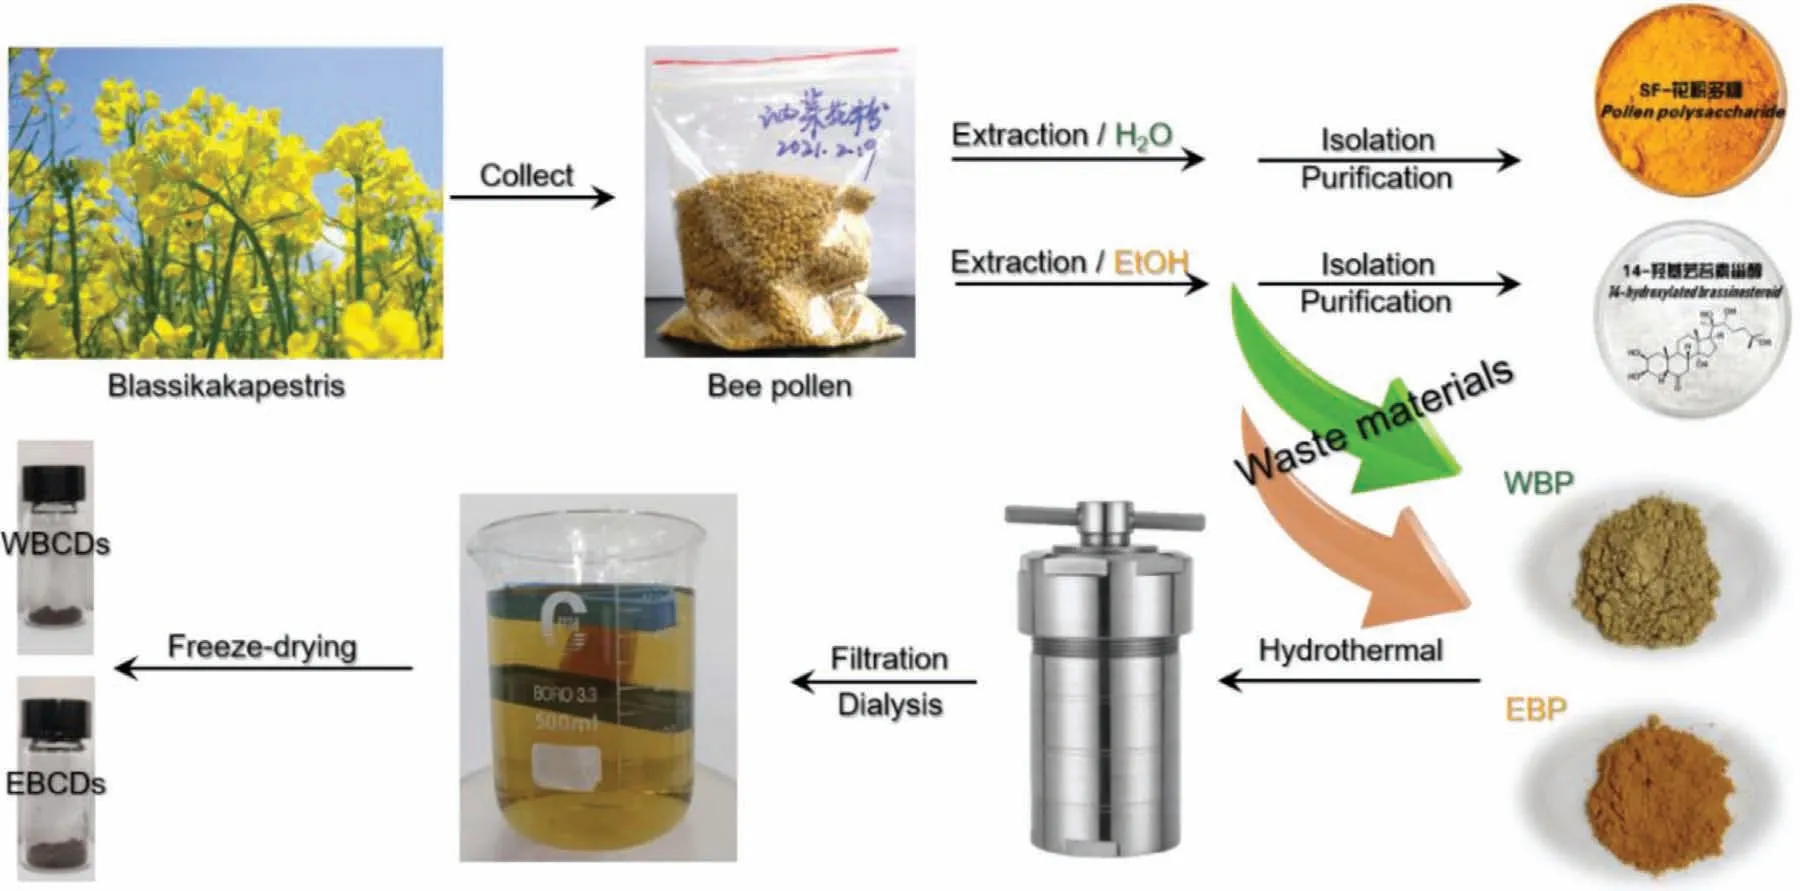
Scheme 1.The preparation of WBCDs and EBCDs.
It should be noted that if the CDs are post-treated according to the method reported in the literature [27],only ultrafiltration by 0.2 μm membrane,the obtained CDs are not loose powders but viscous colloids.Disperse it in water,the resulting solution is also obviously turbid,which is different from the several CDs samples obtained by our research group in the early stage.Later,after purifying the CDs using a dialysis bag with a molecular weight cut-off of 1000,the resulting solution was clear and transparent.Biomass raw materials are also composed of many organic small molecules,polymers and chiral substances.In the process of hydrothermal preparation,several new small molecules or polymers would be formed after the recombination,ring closure,addition and other reactions of the active functional groups in each component.These molecules and polymers are further condensed into chains,and the chains form a network,cross-link each other,and partly carbonize at high temperatures,and finally form carbonized polymer dots.Along with the formation of carbonized polymer dots,several byproducts are inevitably produced.Without deep purification,pure CDs products will not be obtained.
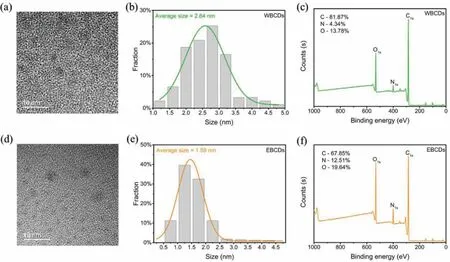
Fig.1.Characterization of the WBCDs: (a) TEM,(b) size distribution and (c) XPS spectra;Characterization of the EBCDs: (d) TEM,(e) size distribution and (f) XPS spectra.
As shown in Figs.1a,b,d and e,the size range of WBCDs is 1.0–5.0 nm and the average size is 2.64 nm,while the size range of EBCDs is 0.25–4.5 nm and the average size is 1.59 nm,all of which are small-sized CDs.It is worth mentioning that the TEM characterization of WBCDs and EBCDs are significantly different.WBCDs is better crystallinity,while the crystal lattice of EBCDs is blurred in the HRTEM image (Fig.S2 in Supporting information).This is due to the different products extracted from bee pollen by water and ethanol,and the residual substances are also different.Compared with WBP,the EBP contains more pollen polysaccharide.Then,in the prepared CDs,pollen polysaccharide can react with each other to form larger polymer cages,while the formation of polymer cages is relatively difficult in WBP.Therefore,WBCDs was more likely to form crystalline carbon cores,while EBCDs has tended to form polymer shells,which have also been verified by Dynamic light scattering (DLS).DLS images show that the average size of WBCDs in aqueous solution is 100.4 ± 54.3 nm,while the average size of EBCDs is 206.2 ± 75.0 nm.In addition,WBCDs can detect graphene D peak and G peak signals by Raman spectroscopy,but EBCDs cannot (Fig.S3 in Supporting information).This also proves that WBCDs has formed a deeper carbon core and the graphene structure is clear,while EBCDs has more inclined to create high polymer cages.In addition,we tested the XRD data of two carbon dots,and the results are shown in the Fig.S4 (Supporting information).The XRD patterns of the two carbon dots reflect the structural characteristics of amorphous carbon,which are consistent with the basic properties of carbon dots.
To clarify the surface state of the CDs (such as the polymer cage outside the carbon core and the surface functional groups),we conducted elemental analysis on the two CDs.The results of XPS show that WBCDs and EBCDs are composed of three elements:C,N and O.However,their contents are obviously different.As shown in Figs.1c and f,the C atom content of WBCDs is as high as 81.87%,while the content of N and O atoms is only 4.34% and 13.78%.The C atom content of EBCDs is 67.85%,but the ratio of N and O atoms has increased to 12.51% and 19.64%.The richer N element content has laid the foundation for plant growth regulation.WBCDs correspond to C 1s (284.80 eV),N 1s (399.96 eV) and O 1s(532.02 eV),respectively.The high-resolution XPS spectrum of C 1s (Fig.S5a in Supporting information) shows three peaks,namely C–C (284.80 eV),C–O/C–N (286.00 eV) and C=O (288.34 eV).As shown in Fig.S5b (Supporting information),the high-resolution spectrum of N 1s can be deconvolved into two peaks of 399.96 and 401.64 eV,which are attributed to C–N and N–H.As a highresolution spectrum of O 1s,there are two peaks at 532.02 and 533.56 eV,which are assigned as O=C and O–C bonds respectively (Fig.S5c in Supporting information).EBCDs correspond to C 1s (284.80 eV),N 1s (400.13 eV) and O 1s (531.67 eV).The high-resolution spectrum of C 1s can be deconvoluted into three peaks of 284.80,285.96 and 288.24 eV,which attributed to the C–C bond,C–O/C–N bond,and C=O bond (Fig.S5d in Supporting information).As shown in Fig.S5e (Supporting information),as a high-resolution spectrum of N 1s,there are two peaks at 400.13 and 402.09 eV,assigned as N–C and N–H bonds,respectively.The high-resolution XPS spectrum of O 1s (Fig.S5f in Supporting information) shows two peaks,O=C (531.67 eV) and O–C(533.18 eV).The FTIR results are more similar than the difference between the two CDs shown by XPS.The FTIR spectra of WBCDs and EBCDs show that the surface functional groups of the two CDs are almost the same (Fig.S6 in Supporting information).The peak around 1200 cm−1corresponds to the vibration of C–O,and the peak around 1400 cm−1corresponds to the C–N bond.The characteristic peak at 1580 cm−1is attributed to the stretching vibration of the C=O bond.The unique peaks at 1720 and 3400 cm−1belong to-COOH,which are caused by the vibration of C=O bond and O–H bond,respectively.The characteristic peak near 2900 cm−1is due to the vibration of the C–H bond.The characteristic peak around 3300 cm−1is derived from the stretching vibration of the N–H bond.
In order to more clarify the difference in the structure of the two CDs,we conducted a thermogravimetric analysis on them.The weight loss of the two CDs is roughly similar by TG/DTG curve (Fig.S7 in Supporting information).The curve is also similar to most reports [28].The entire weight loss process can be divided into three stages.First,the dissociation of the outermost functional groups and small molecules.Second,the dissociation of the polymer cage,which is also the most crucial stage.Third,the dissociation of carbon nuclear.However,it is worth mentioning that the DTG curve of WBCDs fluctuates after 350 °C,while the DTG curve of EBCDs is relatively stable.This may be caused by the difference in the carbon core of the two CDs.WBCDs have a clear graphene carbon core.As the temperature gradually increases,the carbon core will also be damaged to varying degrees.Therefore,the DTG curve fluctuates,while EBCDs have clear polymer properties.The polymer cage is larger and more complex.When the temperature is raised,the weight loss basically occurs on the dissociation of the polymer cages.Therefore,its DTG curve is smoother than that of WBCDs.This can also be well explained by the residual amount.The residual amount of WBCDs is about 17%,and the residual amount of EBCDs is about 34%.Since the polymer cages of EBCDs are larger than WBCDs,the polymer cages ‘protect’the carbon core during the thermal dissociation process.So the residual amount of EBCDs is much greater than that of WBCDs,which again supports the difference in the structure of the two CDs.In summary,the surfaces of the two CDs are rich in functional groups,the graphene carbon core structure of WBCDs is clearer,and the polymer properties of EBCDs are relatively outstanding.
Since CDs were discovered in 2004 [29],their photoluminescence (PL) properties have consistently attracted the attention of many scholars [30–34].For this reason,we have carried out detailed characterization of the PL properties of WBCDs and EBCDs.As shown in Fig.2,the absorption and emission spectra of the two CDs are almost the same in the low concentration state,and the aqueous solutions all show blue PL.Furthermore,we tested the excitation wavelength dependence of the two CDs.Both WBCDs and EBCDs exhibit apparent excitation wavelength dependence related to the carbon core’s defect state and the complex polymer cages on the surface (Fig.S8 in Supporting information).To apply CDs to the field of sensing and cell imaging,we must know the changes in their PL properties with pH.Fig.S9 (Supporting information) shows that the PL intensity of the two CDs has the same trend with pH under the BR buffer system.In an acidic environment,both two CDs show higher PL intensity,but in an alkaline condition,the opposite is true.This may be caused by protonation of the functional groups or molecules on the surface of the CDs.When the functional group has combined with H+or OH−,the surface molecules or functional groups undergo charge transfer,which affects the PL intensity of the CDs.In a neutral environment,the PL intensity of the two CDs is relatively stable,which provided the basis for subsequent applications.Concentration dependence is also one of the properties of CDs.As shown in Figs.S10a and b (Supporting information),when the concentration has increased,the absorption intensity of the two CDs also increases linearly.However,the absorption of WBCDs is weaker than that of EBCDs at the same concentration,and the color of WBCDs is also lighter than that of EBCDs (Figs.S10c and d and insets in Supporting information).The PL intensity of the two CDs both increase first and then decrease.The maximum PL intensity of WBCDs corresponds to a concentration of 500 μg/mL,while the concentration of EBCDs is 100 μg/mL.When a certain concentration has reached,the decrease in PL intensity is caused by the internal filtering effect(IFE).When the solution becomes dark,it has absorbed excitation light while absorbed a large amount of emitted light,thereby decreasing in PL intensity.Excellent water solubility is the property of most CDs.In addition to water,it must be clear whether other organic solvents can dissolve CDs.Therefore,we explored the solubility of 10 common organic solvents to CDs.Both CDs can be dissolved in water,methanol and DMSO.WBCDs can also be dissolved in DMF.However,CDs have shown poor solubility in other solvents (Fig.S11 in Supporting information).The two CDs can only be dissolved in a strong polar solvent,which may be related to the polarity of the two CDs and the surface functional groups.Finally,we tested the absolute fluorescence quantum yields of two aqueous solutions of carbon dots.The WBCDs is 2.15% and the EBCDs is 4.80%.
For a newly developed material,we need to understand its stability and applicable environment in detail.Therefore,we have investigated the absorption and emission behavior of the two CDs at different temperatures (Fig.S12 in Supporting information),in salt solutions (Fig.S13 in Supporting information),and at different times (Fig.S14 in Supporting information).The spectrums have not changed significantly,indicating that they are suitable for applications in multiple environments.To further clarify the stability of the CDs,we used a high-power UV lamp to irradiate the two aqueous solutions of CDs.Fig.S15 (Supporting information) shows that the absorption spectra did not change significantly when it tested at different time points,but the emission intensity varied with the illumination time.The extension has been gradually reduced,and the maximum reduction is nearly 50%.The possible reason is that the high-power ultraviolet lamp has produced ·OH with a high oxidation potential.•OH has destroyed the emission center of CDs,thereby quenching the PL.But what makes us very puzzled and curious is that the absorption spectra of the two CDs have not changed.The possible reason is that the nuclear state is mainly for absorption,while the surface state is mainly for emission.The damage of•OH to the emission center has mainly concentrated on the surface state,and the nuclear state for supply and absorption has little effect.Therefore,there is almost no change in the absorption spectrum.But the PL intensity gradually decreases.The real reason remains to be further verified.Since the PL of CDs can be quenched by•OH,can other substances with strong oxidizing properties quench the PL of CDs? We investigated the emission spectra at different concentrations with H2O2as the quencher.It can be seen from Fig.S16 (Supporting information),the PL of CDs can also be quenched by H2O2to a certain extent,indicating that the two CDs have difficulty maintaining in a strongly oxidizing environment.
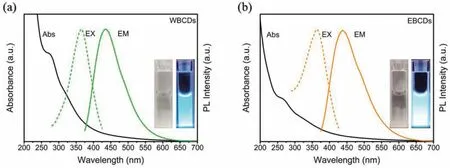
Fig.2.UV–vis,PL emission,and PL excitation spectra in aqueous solution of the WBCDs (a) and EBCDs (b).
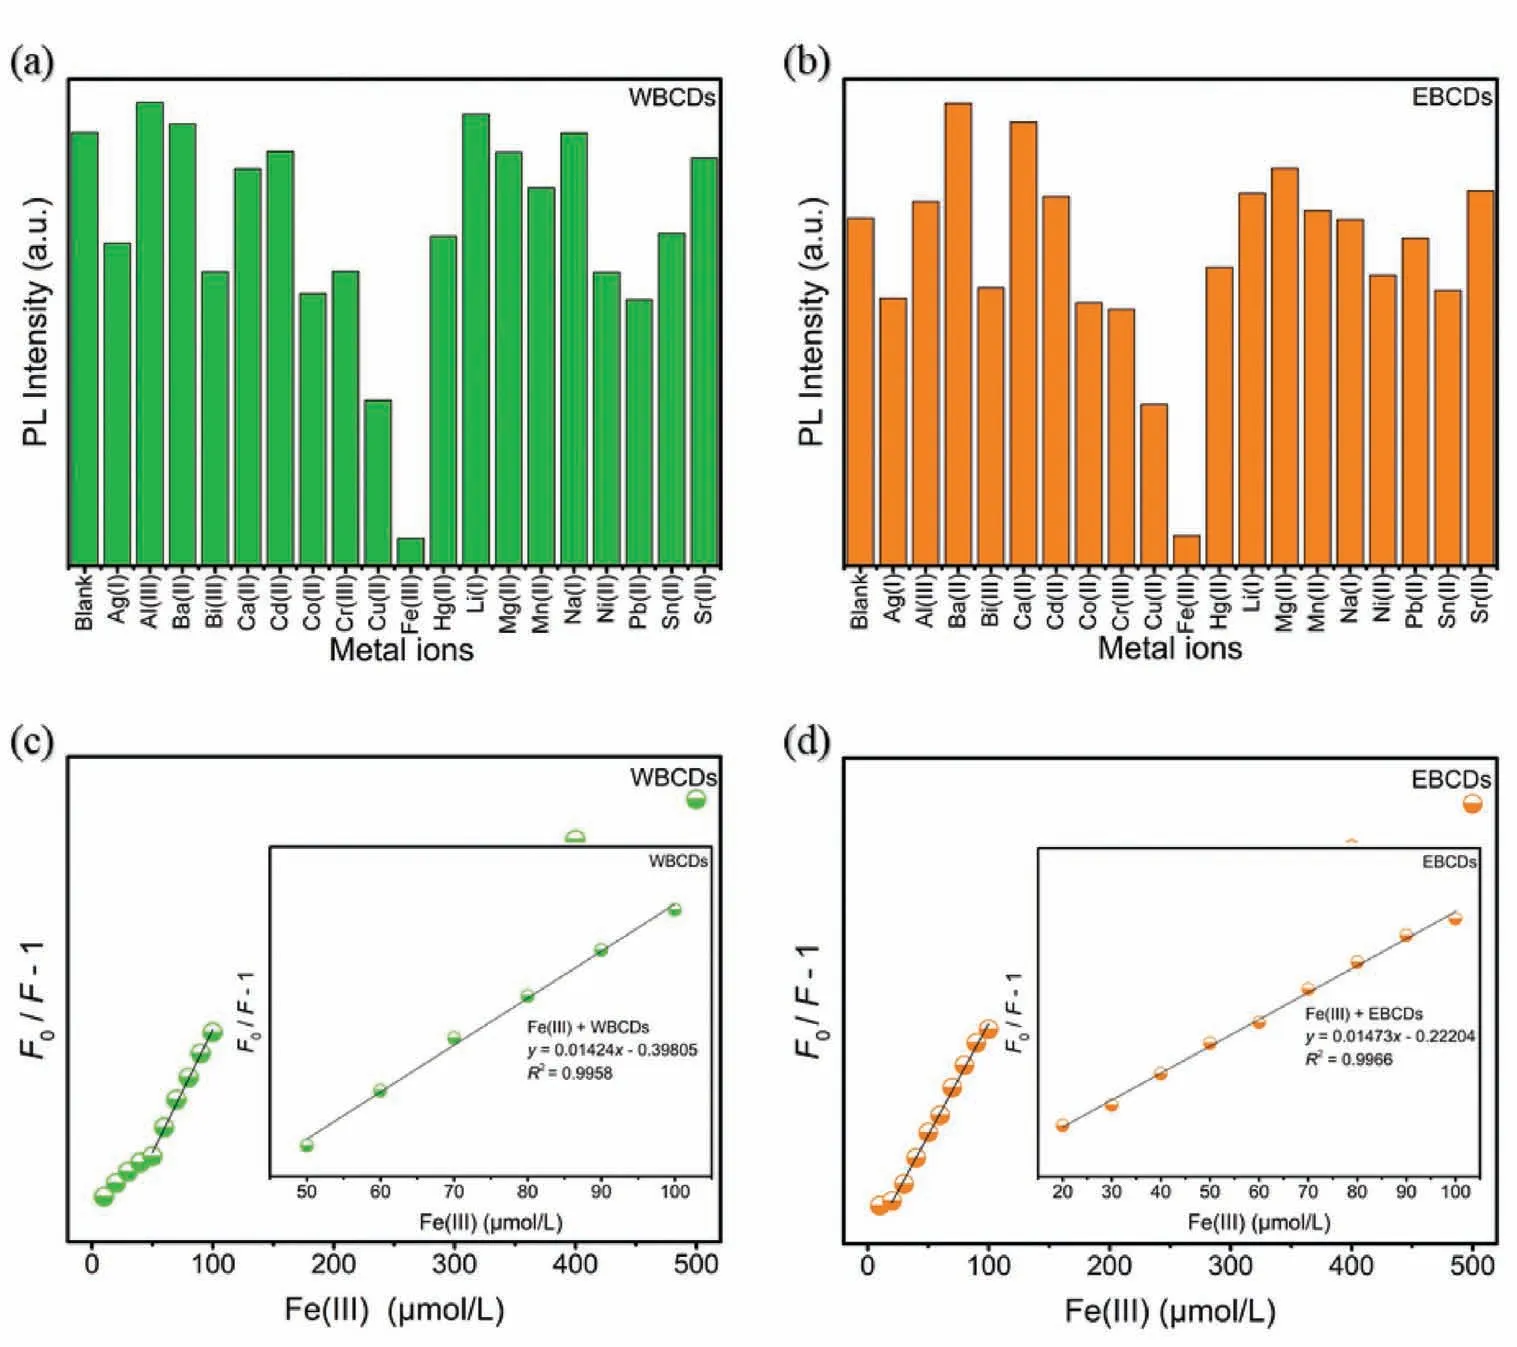
Fig.3.PL response of (a) WBCDs,(b) EBCDs (30 μg/mL) in the presence of different metals (λex=365 nm),all the concentration of the metal ions is 0.01 mol/L;PL spectra of (c) WBCDs,(d) EBCDs (30 μg/mL) in the presence of different amounts of Fe3+ in water.Fe3+ concentration from low to high is 0,5,10,20,30,40,50,60,70,80,90,100,200,300,400 and 500 μmol/L,respectively.The inset is the Stern-Volmer plot of the quenching of the PL of WBCDs and EBCDs by Fe3+.
The influence of different anions and cations on CDs is important for the investigation of material stability and it is also an extension of the application of CDs.We have investigated the influence of 20 kinds of cations and 19 kinds of anions on the PL of two CDs.As shown in Fig.S17 (Supporting information),the two CDs have no obvious response to all anions,but generally respond (or enhance or quench) to cations (Figs.3a and b).What is more worth mentioning is that Fe3+quenches both CDs significantly.Compared with other types of metal ions,WBCDs and EBCDs exhibit high sensitivity and selectivity to Fe3+.Subsequently,we further studied the ability of two CDs as a PL sensor to detect Fe3+quantitatively.
The Stern-Volmer equation can be used to analyze PL quenching(Eq.1),

among them,FandF0are the PL intensity in the presence and absence of Fe3+,[Q]is the concentration of Fe3+,τ0is the PL lifetime of the CDs,Kis the Stern-Volmer quenching constant,andkqis the quenching rate constant.
It can be seen from Figs.3c and d that the PL intensity will decrease when different concentrations of Fe3+are added to the aqueous solutions of WBCDs and EBCDs.With the increasing of Fe3+concentration,the quenching of WBCDs and EBCDs PL becomes more thorough.When the concentration of Fe3+is less than 100 μmol/L,theF0/F−1 and Fe3+concentrations have a good linear relationship.The linear equations arey=0.01424x−0.39805(R2=0.9958) andy=0.01473x−0.22204 (R2=0.9966),respectively (insets in Fig.3).The reason of PL quenching may be the non-radiative electron transfer from the excited state of the CDs to the Fe3+d orbital.In addition,as a sensor,the sensitivity of response is also an essential indicator.For this reason,we studied the PL intensity at different times after adding Fe3+to the CDs solution.As shown in the Fig.S18 (Supporting information),the quenching of the two CDs by Fe3+can be completed instantly,which provides the basis for rapid detection.Meanwhile,F0/F−1 is a linear function of Fe3+concentration and the LODs is 27 μmol/L and 15 μmol/L (3σrule) respectively.Therefore,both WBCDs and EBCDs can be used as Fe3+sensors.
To clarify the PL quenching mechanism of Fe3+on WBCDs and EBCDs,we investigated the absorption spectra,the influence of temperature and the change of PL lifetime of two CDs in the presence of Fe3+.It can be seen from Figs.S19a and b (Supporting information) that the absorption spectrum and intensity did not change significantly when different concentrations of Fe3+were added to the aqueous solution.This shows that there was no apparent static intermediate product formed between Fe3+and CDs.Therefore,the possibility of static quenching can be excluded.In addition,the number of collisions between Fe3+and CDs increases with the increasing of temperature,which causes the increasing of quenching constant (Fig.S20 in Supporting information).The temperature dependence can also prove that the quenching method is dynamic quenching.Furthermore,the mechanism is investigated through the life of PL.When Fe3+is added,the life of the two CDs is shortened,which supports the dynamic quenching mechanism (Fig.S21 in Supporting information).However,quenching and saturation may occur when the concentration of Fe3+is too high (over 350 μmol/L).According to the results of time-correlated single photon counting (TCSPC),theτ0obtained is 2.97 ns and 2.92 ns,respectively,andK=10,170 L/mol,so the calculatedkq=3.46 × 10¹²L mol−1s−1andkq=4.28 × 10¹²L mol−1s−1.Thekqis about 1 × 10¹⁰L mol−1ss−1which caused by the quenching of diffusion-controlled.Thekqof WBCDs and EBCDs is significantly larger than the limit of diffusion control,which means certain chemical bonds maybe exist between Fe3+and the functional groups on the CDs surface.For example,coordinate bonds between Fe3+and carboxyl groups or amino groups maybe exist on the surface of CDs.
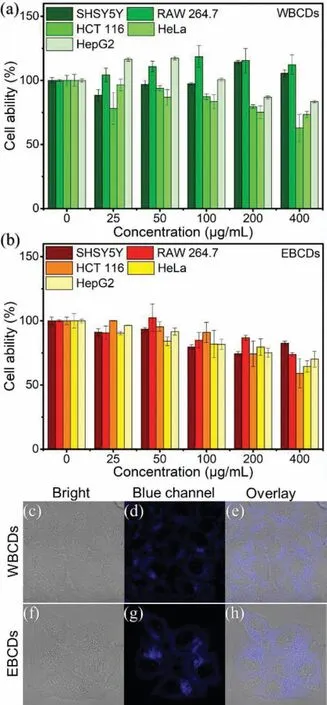
Fig.4.The viability of four cells after incubating with various concentrations of the (a) WBCDs and (b) EBCDs (0–400 μg/mL) for 24 h.Confocal fluorescence images of live HepG2 cells: (c-e) Image of HepG2 cells with WBCDs;(f-h) image of HepG2 cells with EBCDs.The images were acquired upon excitation at 405 nm and PL emission was collected at 410–505 nm.
As we all know,biocompatibility is one of the advantages of CDs.In order to evaluate the biocompatibility of the two CDs and their potential application in cell imaging,it is necessary to evaluate the cytotoxicity of WBCDs and EBCDs.The cytotoxicity of the two CDs has been determined by the MTT method.We incubated five kinds of cells (SHSY5Y,RAW264.7,Hela,HCT116 and HepG2) with different concentrations (25–400 μg/mL) of WBCDs and EBCDs solutions for 24 h.As shown in Figs.4a and b,WBCDs showed toxicity to HCT116,HeLa and HepG2 cells,but showed no obvious toxicity to the other two cells at the same concentration.EBCDs have shown slight toxic to five types of cells at high concentrations.For applications,both WBCDs and EBCDs need to achieve cell imaging.The concentration of CDs has been carefully selected to achieve cell labeling under the premise of ensuring cell viability.Confocal laser microscopy was used to confirm the cell imaging capabilities of WBCD and EBCD.Incubate HepG2 cells with 100 μg/mL WBCDs or EBCDs for 15 min.When HepG2 cells were excited at 405 nm,they showed blue PL (Figs.4c-h).It can be found that both WBCDs and EBCDs can enter cells smoothly and accumulate in the cytoplasm.
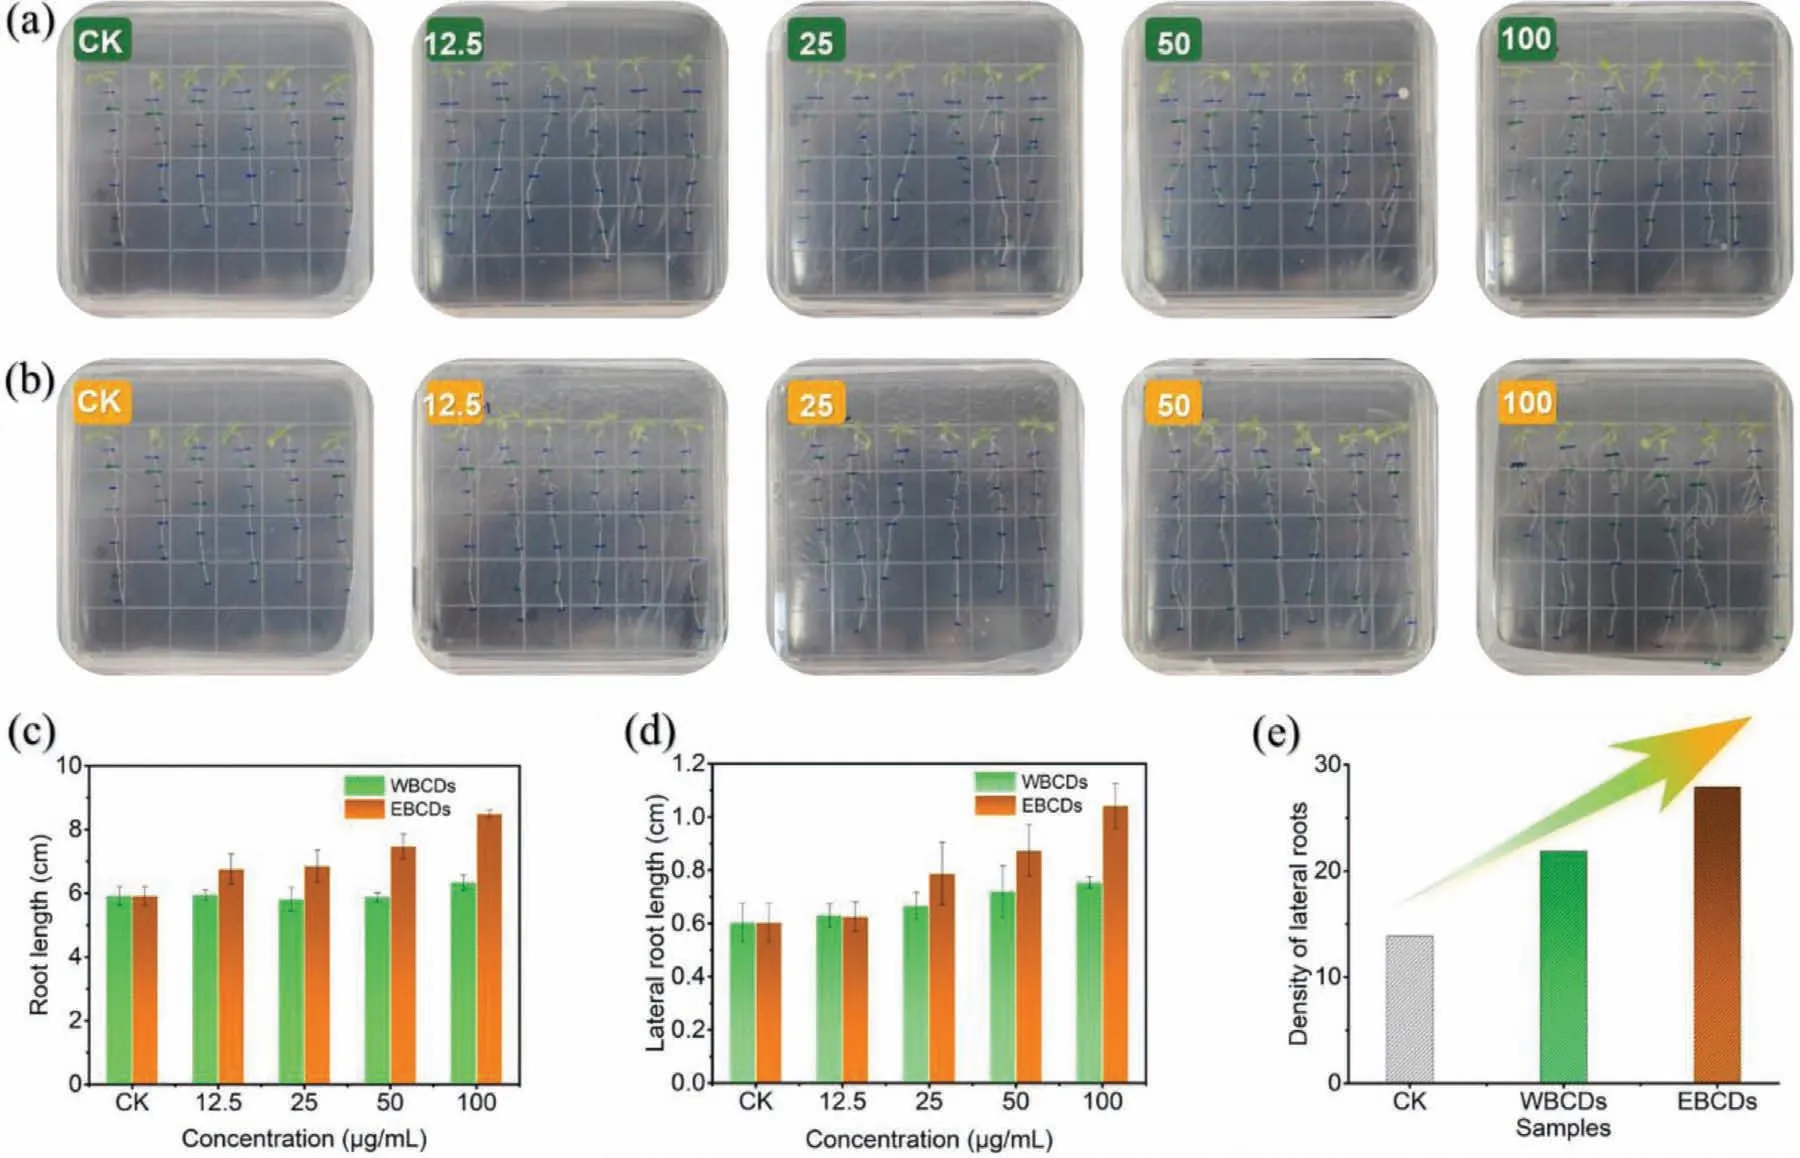
Fig.5.Effects of (a) WBCDs and (b) EBCDs on the growth and development of Arabidopsis after incubation for 5 days with natural lighting.(c) Root length,(d) lateral root length and (e) lateral root length and number of Arabidopsis in different BCDs solutions with concentrations of 0,12.5,25,50 and 100 μg/mL (from left to right).
Recently,CDs have been reported to increase plant growth [35–37].As mentioned above,brassinosteroid is a broad-spectrum plant growth regulator which is extracted from bee pollen.Is it possible that CDs made from bee pollen waste can also be used in plant growth regulation? Using the classicArabidopsismodel,we studied the influence of CDs on the plant growth regulation.As shown in Figs.5a and b,the length of the main and lateral roots ofArabidopsishas gradually increased with the increasing of the concentration of CDs (0,12.5,25,50,100 μg/mL).And the growthpromoting effect of EBCDs is better than that of WBCDs (Figs.5c and d).The possible reason is that the N and O content of EBCDs is higher than WBCDs,which has enhanced the biocompatibility and biological activity of EBCDs.More importantly,the ‘density’(the product of the length and the number of lateral roots) of lateral roots has been dramatically improved.As shown in Fig.5e,with the concentration increasing,both CDs significantly promote the ‘density’of the lateral roots.The ‘density’of the lateral roots in WBCDs increased 57% compared with the blank control,while the ‘density’of the lateral roots in EBCDs increased nearly 100%.Both two CDs are hopeful to be developed into plant growth regulators.
In summary,we have prepared two biomass CDs from bee pollen waste through a one-step hydrothermal method.WBCDs and EBCDs have shown excellent dispersibility in aqueous solutions and uniform in size.The two CDs have different crystalline states.WBCDs carbon core has high crystallinity,while EBCDs polymer shell is more pronounced.Both WBCDs and EBCDs contain many heteroatoms and highly functionalized oxygen and nitrogencontaining groups.Notably,both WBCDs and EBCDs have shown excellent sensing performance for Fe3+in water.The LODs is 27 μmol/L and 15 μmol/L,respectively.The quenching mechanism has been proved to be dynamic quenching by various means.At the same time,the excellent biocompatibility allows the two CDs to be used in cell imaging and plant growth regulation,especially in the promotion of the ‘density’ofArabidopsislateral roots.In any case,functional CDs derived from agricultural pollen waste were reused in agricultural field,which provides a friendly way for biomass waste recycling,green chemistry and new material development.
Declaration of competing interest
We declare that we have no financial and personal relationships with other people or organizations that can inappropriately influence our work.We declare that we do not have any commercial or associative interest that represents a conflict of interest in connection with the work submitted.All authors have seen and approved the final version of the manuscript being submitted.They warrant that the article is the authors’original work,has not received prior publication and is not under consideration for publication elsewhere.
Acknowledgments
This work was financially supported by the National Natural Science Foundation of China (No.21877082),Sichuan Science and Technology Program (No.2021YFG0291),International Science and Technology Innovation Cooperation Project of Sichuan Province(No.21GJHZ0092),Sichuan Province Innovation and Entrepreneurship Project (No.S202110650037) and the Undergraduate Scientific and Technological Innovation Project (No.2020029),Xihua University.
Supplementary materials
Supplementary material associated with this article can be found,in the online version,at doi:10.1016/j.cclet.2021.12.094.
 Chinese Chemical Letters2022年6期
- Chinese Chemical Letters的其它文章
- Photochemical defluorinative functionalization of α-polyfluorinated carbonyls via spin-center shift
- Methods of screening,monitoring and management of cardiac toxicity induced by chemotherapeutics
- Light-guided tumor diagnosis and therapeutics: From nanoclusters to polyoxometalates
- Nanofluidics for sub-single cellular studies:Nascent progress,critical technologies,and future perspectives
- Effective purification of oily wastewater using lignocellulosic biomass:A review
- Recent advances in microchip-based methods for the detection of pathogenic bacteria