Safety Evaluation of Water Environment Carrying Capacity of Five Cities in Ningxia Based on Ecological Footprint of Water Resources
Chang LU, Rui XI, Zhengjun HEI, Lian TANG,2,3*
1. School of Civil & Hydraulic Engineering, Ningxia University, Yinchuan 750021, China; 2. Engineering Research Center of Ministry of Education for Efficient Utilization of Modern Agriculture Water Resources in Arid Areas, Ningxia University, Yinchuan 750021, China; 3. Research Team of Ministry of Education for Efficient Utilization of Modern Agriculture Water Resources in Arid Areas, Ningxia University, Yinchuan 750021, China
Abstract [Objectives] To make safety evaluation of water environment carrying capacity of five cities in Ningxia based on ecological footprint of water resources. [Methods] With the help of the grey relational model, 15 indicators were selected from the natural, economic, and social aspects, and the most influential factors in the three fields were selected. Based on the concept of ecological priority, the water resources carrying capacity of the five cities in Ningxia from 2010 to 2019 was calculated with the help of the water resources ecological footprint model. Then, the indicators of the water resources ecological footprint model were coupled with the existing indicators to establish a comprehensive evaluation indicator system. Finally, the changes of the water environment carrying capacity of the five cities in Ningxia were analyzed with the help of the principal component analysis (PCA). [Results] The ecological pressure of water resources and the ecological deficit of water resources in the five cities were relatively large. Specifically, Yinchuan City had the most obvious deficit of water resources but good carrying capacity; Zhongwei City had a large ecological deficit of water resources, poor carrying capacity, and the largest ecological pressure index of water resources; Guyuan City had low water resources ecological deficit, water resources ecological carrying capacity and water resources ecological pressure index. [Conclusions] Through the analysis of the coupling indicator system, it can be seen that the water environment carrying capacity of the five cities is in an upward trend, indicating that the water environment in each region tends to become better.
Key words Water environment carrying capacity, Grey relation analysis (GRA), Principal component analysis (PCA), Water resources ecological footprint, Influencing factors
1 Introduction
The five cities (Yinchuan, Shizuishan, Wuzhong, Guyuan, and Zhongwei) in Ningxia have different locations, different water resources endowment conditions, and different economic and social development states, so their water resources carrying capacity show different characteristics[1]. Through analyzing the ability of the water environment in the region to maintain the coordinated development of the economy, society and ecology in the region, Li Lilietal.[2]obtained the status of the carrying capacity of the regional water environment, and found the situations of regional water resources. At present, there are many research methods such as fuzzy comprehensive evaluation method, principal component analysis (PCA) method, analytic hierarchy process (AHP), vector model method, grey relational method,etc.[3-10]. In order to avoid the subjective influence of a single model, researchers usually combine multiple models to analyze the carrying capacity of the water environment from both subjective and objective perspectives[11-13]. Considering the close relationship between ecology, water resources and water environment, more and more researchers apply the water resources ecological footprint model to water resources research[14]. Chen Zhengleietal.[15]used the improved water ecological model to calculate the water environment carrying capacity of Shandong Province, analyzed the dynamic changes and spatial distribution of the local water ecological footprint, and came up with recommendations for maintaining the ecological safety and health of water bodies. With the help of LMDI and the water resources ecological footprint model, Zhao Ziyangetal.[16]analyzed the water resources ecological footprint of Henan Province, found out the factors that had significant influence on the water resources ecological health, and put forward suggestions for realizing the healthy development of the water resources ecological footprint. Yue Chenetal.[17]introduced the ecological footprint of water resources and comprehensively analyzed the changes of the ecological carrying capacity of water resources in Beijing over the past 10 years. In this study, by coupling the ecological footprint of water resources with the water environment, we not only evaluated water resources from an ecological perspective, but also evaluated surface water and groundwater resources, and comprehensively analyzed water resources from the perspectives of industrial water use, land area, population, and precipitation. Using grey relational method and PCA method, we selected the main influencing factors. Through qualitative and quantitative analysis[18], we compared the factors of the five cities in Ningxia, and established a water environment carrying capacity evaluation indicator system based on ecological priority by integrating the ecological footprint of water resources. Finally, with the help of principal component analysis, we deeply discussed the changing trends and influencing factors of the water environment carrying capacity of the five cities in Ningxia.
2 Research methods
2.1 Grey relation methodIn this study, with the help of the grey correlation method, we reduced the dimension of the indicators, calculated the correlation degree of the indicators, selected the higher correlation degree as the evaluation indicator, and selected the closely related factors for comparison[19], so as to reduce the processing difficulty.
2.2 Ecological footprint of water resourcesWe used the water resources ecological footprint model to calculate the water resources ecological footprint and the carrying capacity. We plotted line charts to reflect the changes in the carrying capacity of the water environment in each year. The water environment in the study area was comprehensively evaluated by means of three indicators: ecological surplus (deficit) of water resources, ecological footprint of ten thousand yuan GDP, and water resources ecological pressure index[15,20].
2.3 Principal component analysis (PCA)The PCA can not only ensure the integrity of data information, but also can convert multiple factors into a few irrelevant factors, reflecting the main information to the greatest extent, the method is simple and objective, and more scientific[21]. In this study, we used PCA to evaluate the water environment carrying capacity.
3 Indicator selection and analysis process
The carrying capacity of water environment is closely related to regional economy, society and nature. On the basis of existing literature research[10,19-21], following the principles of availability, representativeness and operability of indicator selection, we initially selected 15 indicators from natural, economic, and social fields to analyze the water environment carrying capacity of five cities in Ningxia (Table 1).
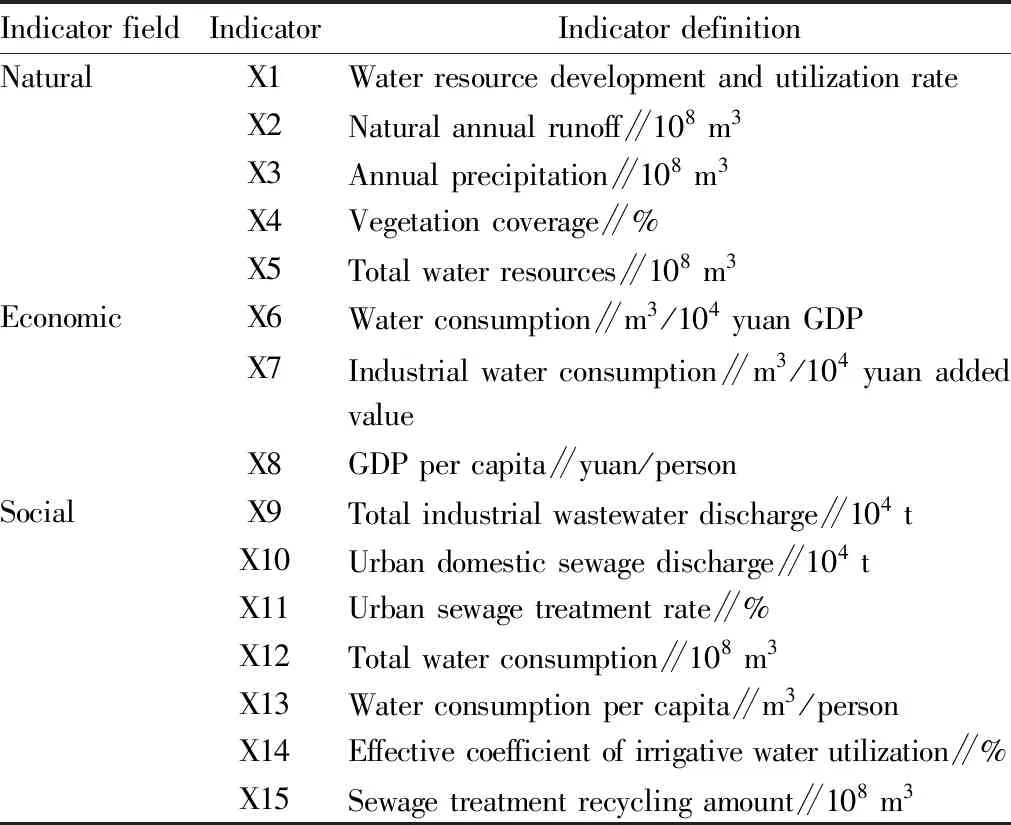
Table 1 Water environment carrying capacity indicators of five cities in Ningxia
4 Construction of water environment carrying capacity evaluation indicator system
In order to further select representative indicators that can truly reflect the water environment carrying capacity of the five cities and eliminate the overlap of indicator information, we used the grey correlation method to screen the indicators. The water environment carrying capacity data were mainly collected from theChinaStatisticalYearbook,NingxiaStatisticalYearbookandNingxiaWaterResourcesBulletinin the period of 2010-2019.
After the mean processing of the original data, we conducted the grey correlation analysis with the aid of SPSS and EXCEL software, and the indicators were ranked according to the correlation degree. In order to avoid different reference sequences leading to different subsequent results and reduce subjective impact, we adopted the grey relational matrix method[21]. Taking Yinchuan City as an example, the reference sequence was changed in turn for analysis, and the grey correlation matrix was obtained, and the average value of each indicator was sorted (Table 2).
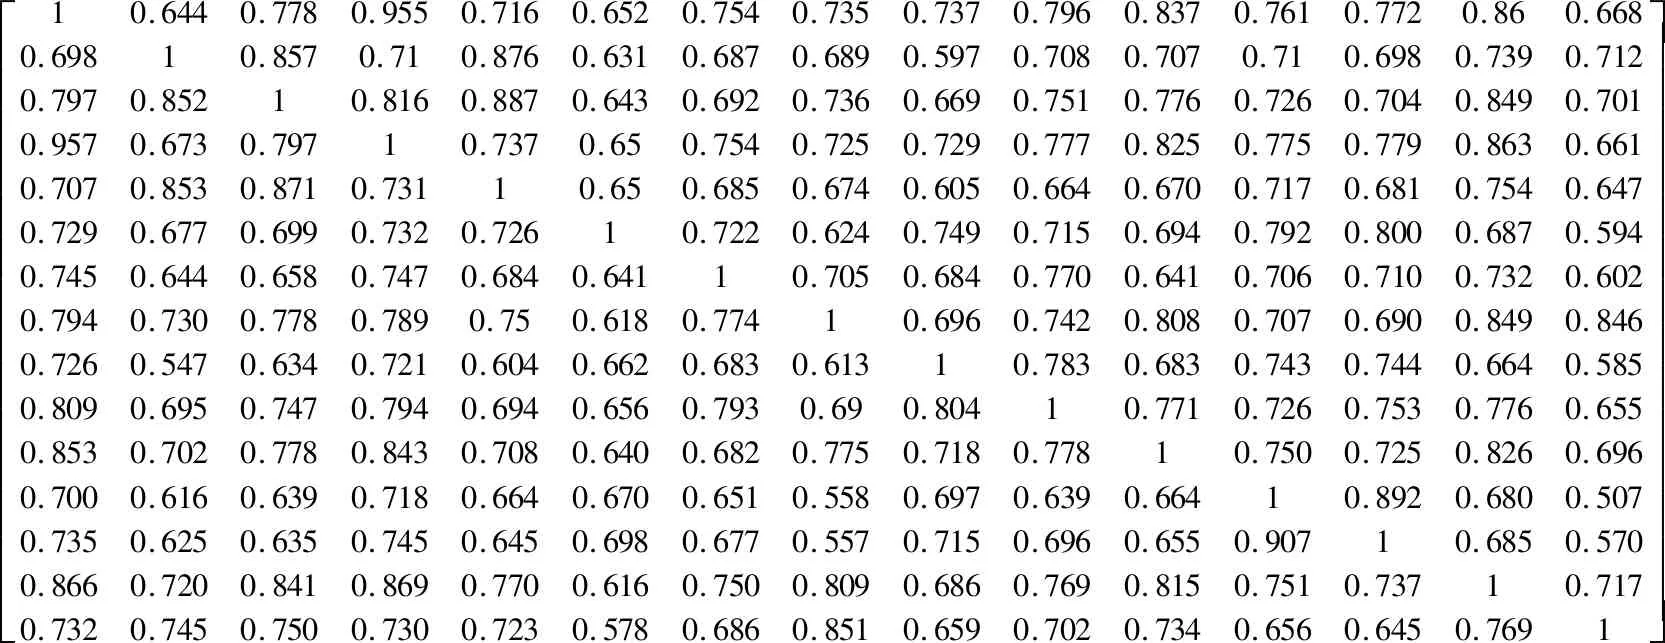
Table 2 Grey correlation matrix of Yinchuan City
In order to better reflect the ecological concept, from the evaluation of water resources ecological footprint model indicators on the basis of grey relational screening, we added water resources ecological footprint per capita (X16, expressed in ha/person), water resources ecological carrying capacity per capita (X17, expressed in ha/person), ecological footprint of water resources per 10 000 yuan GDP (X18), and water resources ecological pressure index (X19), and finally established the indicator system (Table 3).

Table 3 Evaluation indicators of water environment carrying capacity based on water resources ecological footprint model
5 Evaluation and analysis of water environment carrying capacity of five cities in Ningxia
5.1 Analysis of results based on water ecological footprint modelUsing the calculation formula[15, 20], we calculated the ecological footprint of water resources and the water resources carrying capacity of the five cities in Ningxia, as shown in Fig.1.
Through analyzing Fig.1, we can see that the ecological footprint of Yinchuan City had a large change range, and Guyuan City had the smallest. Besides, we can see that Yinchuan, Shizuishan, and Wuzhong cities had roughly the same trend in the line chart of water resources carrying capacity. Among them, Shizuishan City was the oldest industrial base, its water resource ecological carrying capacity changed greatly, and there were also some problems in the later recovery. On the whole, Guyuan City had a relatively high carrying capacity and a relatively good water resource environment, while Zhongwei City had the lowest water resource ecological carrying capacity and a poor water resource environment.

Fig.1 Water resources ecological footprint and water resource ecological carrying capacity of five cities in Ningxia
According to the ecological deficit (surplus) of water resources in the five cities of Ningxia, the utilization efficiency of ten thousand yuan GDP, and the ecological pressure index of water resources, it can be seen that there were large deficits in water resources in the five cities, and the deficit in Yinchuan was the most obvious. The pressure index of water resources of the five cities were all greater than 1, and the water resources deficit and pressure index of Guyuan City were relatively small, indicating that the water environment pressure of Guyuan City was relatively small, and the pressure index of water resources of Zhongwei City was the largest. In addition, the obvious decline in the water resources ecological footprint of ten t housand yuan GDP in various regions shows that the efficiency of water resources utilization in the region was continuously improving, and the water resources situation was improving year by year.
5.2 Analysis of key factors of water environment carrying capacity and its influenceUsing SPSS 22.0, we preprocessed the indicators of the five cities, calculated the eigenvalues and variance contribution rates of the components of the five cities, and selected the components with a cumulative percentage greater than 85% as the principal components.
5.2.1Principal component eigenvalues and cumulative contribution rate calculation results. The correlation coefficient value of the principal component loading matrix was proportional to the influence size, and the main influence factors between different regions had significant differences. In the first principal components in Shizuishan City, X6 and X18 played a role in promoting the carrying capacity of water environment, while X8 played a certain inhibitory role. In the second principal component, X17 played a promoting role; in the third principal component, X15 played an inhibitory role; the contribution rate and factor correlation coefficient of the fourth principal component were small and could be ignored. These indicate that the first principal component is mainly the influence of water resources and ecological water use in economic development; the second principal component is mainly the influence of ecological carrying capacity, with a contribution rate of 27.3%; the third principal component reflects that the sewage treatment situation was poor, which had a certain restraint on the local water environment. In the first principal component of Wuzhong City, X2, X5 were promoting factors, while X1, X6, X19 were inhibitory factors; X12 had a promoting effect on the second principal component; the third principal component could be ignored. These indicate that natural water resources and economic factors have a relatively obvious impact on the water environment of Wuzhong City, and the total water consumption also has a certain inhibitory effect. In the first principal components of Guyuan City, X12, X8, X17, and X18 played a promoting role, while X12, X13, and X16 in the second principal components played a promoting role. The third principal components could be ignored. The use of water resources and natural water resources had the most significant influence on the local water environment during economic development and social development. The lower water consumption promoted the improvement of the carrying capacity of the water environment, the ecological footprint of water resources per capita was small, and the ecological carrying capacity per capita was significantly larger than the other four cities. These factors also promoted the restoration of the carrying capacity of the local water environment. In the first principal component of Zhongwei City, X1, X6, and X18 played inhibitory role, while X2, X4, and X5 played a promoting role; in the second principal components, X12 and X17 played a promoting role. These indicate that the water environment carrying capacity of Zhongwei City is related to economic development, water resources and water consumption. Zhongwei City consumed a lot of water in the process of economic development, which has a great impact on the carrying capacity of the local water environment. The ecological footprint of water resources per ten thousand yuan GDP was relatively high, and the development and utilization rate declined year by year, which is not conducive to the restoration of the carrying capacity of the water environment.
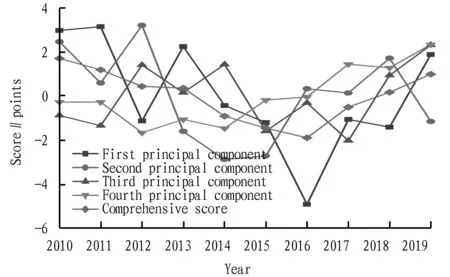
Fig.2 Line chart of water environment carrying capacity score of Yinchuan City
5.2.2Calculation results of score coefficient matrix. The principal component score is the coefficient corresponding to each factor multiplied by the factor, and the principal component score multiplied by the respective cumulative contribution rate corresponds to the corresponding comprehensive score. The positive or negative of each component score only represents the relative position of the water environmental carrying capacity of the value in a specific region, and the comprehensive score is positively correlated with the water environmental carrying capacity[22].
Taking Yinchuan City as an example, it can be seen from the comprehensive scores of the principal components that the water environment carrying capacity of Yichuan City first decreased and then increased, and a turning point appeared in 2016. Through analyzing the changes of the original data and the line chart of the carrying capacity score, it can be seen that there is a certain lagging effect in the changes of the carrying capacity. The first principal component had the highest contribution rate and the most significant influence. From the beginning to the turning year, the water consumption per capita and the water ecological footprint per capita dropped by 48.6%, and the water ecological pressure index decreased by 52.9%. Therefore, the first principal component played the most significant role in the restoration of the carrying capacity of the water environment in Yinchuan City. In the same way, we calculated the principal component scores and comprehensive scores of the other four cities, and the results are shown in Fig.3.
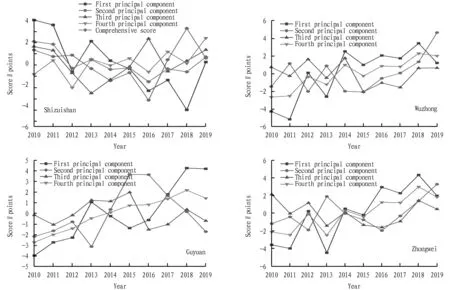
Fig.3 Line chart of water environment carrying capacity scores of the other four cities
The water environment carrying capacity of Shizuishan City first decreased and then increased, and there was a lag in the change of the water environment carrying capacity, and the turning year was also 2016. In 2013-2014, the annual precipitation and natural annual runoff decreased significantly, and the urban domestic sewage treatment rate decreased in 2016, all of which exerted an impact on the carrying capacity of the water environment. The cumulative contribution rate of the first principal component was the largest and the score trend was roughly the same as that of the comprehensive score. Through analyzing the main influencing factors of the first principal component, it can be known that before the turning point, water consumption per ten thousand yuan GDP decreased by 55.5%, and the ecological footprint of water resources per ten thousand yuan of GDP decreased by 61.0%, while the correlation coefficient of water resources ecological footprint per ten thousand yuan GDP was relatively small. Therefore, the ecological footprint of water resources per ten thousand yuan GDP had a larger contribution to the improvement of the carrying capacity of the water environment. The local water resources ecological pressure index and water resources ecological carrying capacity per capita were relatively good, but as an old coal mine industrial base, the area was seriously polluted, the water quality was poor, and the urban sewage treatment rate was not high, so it needs to be considered in the future control.
The water environment carrying capacity of Wuzhong City showed a fluctuating upward trend. In some years, the natural annual runoff and precipitation were low, resulting in a certain reduction in the water environment carrying capacity of the corresponding years. Water consumption per ten thousand yuan GDP decreased significantly, and the effective coefficient of irrigative water utilization increased, which improved the carrying capacity of the water environment. However, in recent years, Wuzhong City’s economy has continued to develop, population density has gradually increased, water consumption has increased, and the development and utilization efficiency of water resources has decreased year by year, which has a certain restraint on the carrying capacity of the local water environment. Therefore, Wuzhong City should improve water resource development and utilization rate, protect natural water, and focus on water resource utilization efficiency in economic development.
The water environment carrying capacity of Guyuan City generally shows a fluctuating upward trend. In 2016, the discharge of urban domestic sewage in Guyuan City surged while the treatment rate did not change much. The large amount of domestic wastewater discharge led to a small reduction in the carrying capacity of the regional water environment. In the first principal component, the ecological footprint of water resources per ten thousand yuan GDP decreased by 64% during the study period, and the correlation coefficient was 0.928, indicating that this factor has a greater impact. Guyuan City is the only one of the five major cities in Ningxia that is not along the Yellow River. The amount of evaporation is large, and the amount of water resources and water consumption will directly affect the carrying capacity of the water environment. The increase in population leads to an increase in urban sewage discharge. Therefore, Guyuan City should also improve the utilization efficiency of water resources, save water, and pay attention to the ecological problems of water resources in economic development.
The overall water environment carrying capacity of Zhongwei City shows a rising trend. During the study period, the vegetation coverage has increased from 14.8% to 38.24%, which is 2.58 times of the original. The GDP per capita increased, water consumption per ten thousand yuan GDP decreased, and total water consumption was low. Therefore, the local water environment carrying capacity is currently recovering well. The trend of the first principal component is roughly the same as that of the comprehensive score, and the contribution rate is high. Therefore, in the development of Zhongwei City, it is necessary to focus on natural and economic impacts. As an emerging city, Zhongwei City has a rapid economic development and rapid development of characteristic agriculture and heavy industry, which greatly increases the water consumption per ten thousand yuan GDP and water resources demand. In this situation, Zhongwei City should make rational use of water resources while developing, pay attention to improving water resource development and utilization rate, and reduce water consumption per ten thousand yuan GDP and ecological footprint of water resources.
6 Conclusions and discussion
(i) In the grey relational analysis, some indicators were screened out in different regions. Through analysis, it can be seen that the sewage treatment recycling amount between regions has always been low, so X15 has little impact on the carrying capacity of the water environment. However, for Shizuishan City as an old industrial base, this indicator is still worth exploring. Except for Yinchuan City, the indicator X9 (total industrial wastewater discharge) has been low in other regions in recent years, which has little impact on the water environment carrying capacity of their respective regions. The GDP per capita of Yinchuan has always been relatively high, so the effect of this indicator is weak. The water consumption per ten thousand yuan GDP of Yinchuan City has been low in the later period, while the Water consumption per ten thousand yuan GDP of Guyuan City has always been at a low value, and compared with the other three cities, this indicator is at a low level, so the indicator does not play a significant role. For Shizuishan City, Wuzhong City and Zhongwei City, X7 (industrial water consumption per ten thousand yuan of added value) has basically remained unchanged in recent years, so it plays a small role.
(ii) Through the analysis of the water resources ecological footprint model and the coupling indicator system on the carrying capacity of the water environment in Ningxia, it can be known that the corresponding changing trends of the carrying capacity are roughly the same. The carrying capacity of the five cities in Ningxia is on the rise, indicating that Ningxia has recovered well in recent years for the water environment, and the governance effect is remarkable. According to the analysis of the calculation results of the evaluation indicators, the ecological footprint of ten thousand yuan GDP in Ningxia has been in an obvious downward trend in recent years, indicating that the water resources utilization efficiency in various regions is gradually improving.
(iii) The traditional water environment carrying capacity evaluation only reflects the corresponding results based on the evaluation indicators, and cannot reflect the changes of water ecology and the dynamic characteristics of water, and it is difficult to clearly reflect the consumption of water resources. However, the water resources ecological model has been recognized by many scholars in the long-term research, and has better universal application and comprehensiveness in the research of water resources. Therefore, we made a more in-depth evaluation of the water environment carrying capacity of the five cities in Ningxia from the ecological point of view with the help of the water resources ecological footprint model.
 Asian Agricultural Research2022年5期
- Asian Agricultural Research的其它文章
- Status Investigation and Countermeasures of Green Development of Black Talc Industry Chain in Guangfeng District, Jiangxi Province
- Cloning and Bioinformatics Analysis of TpiA Gene of Vibrio alginolyticus HY9901
- Inhibitory Effect of Lactic Acid Bacteria on Salmonella
- Antagonistic Effects of Sphingomonas and Pseudomonas aeruginosa on 4 Kinds of Pathogenic Bacteria of Ginseng
- Bioinformatics Analysis of Xylanase xynMF13-GH10 Gene from Mangrove Fungi
- Methodological Research in the Field of Civil Aviation Safety
