Prognostic value of preoperative enhanced computed tomography as a quantitative imaging biomarker in pancreatic cancer
Jian-Feng Gao, Yu Pan, Xian-Chao Lin, Feng-Chun Lu, Ding-Shen Qiu, Jun-Jun Liu, He-Guang Huang
Abstract BACKGROUND Pancreatic ductal adenocarcinoma (PDAC) is one of the most lethal malignancies with high mortality and short survival time. Computed tomography (CT) plays an important role in the diagnosis, staging and treatment of pancreatic tumour.Pancreatic cancer generally shows a low enhancement pattern compared with normal pancreatic tissue.AIM To analyse whether preoperative enhanced CT could be used to predict postoperative overall survival in patients with PDAC.METHODS Sixty-seven patients with PDAC undergoing pancreatic resection were enrolled retrospectively. All patients underwent preoperative unenhanced and enhanced CT examination, the CT values of which were measured. The ratio of the preoperative CT value increase from the nonenhancement phase to the portal venous phase between pancreatic tumour and normal pancreatic tissue was calculated. The cut-off value of ratios was obtained by the receiver operating characteristic (ROC) curve of the tumour relative enhancement ratio (TRER),according to which patients were divided into low- and high-enhancement groups. Univariate and multivariate analyses were performed using Cox regression based on TRER grouping. Finally, the correlation between TRER and clinicopathological characteristics was analysed.RESULTS The area under the curve of the ROC curve was 0.768 (P < 0.05), and the cut-off value of the ROC curve was calculated as 0.7. TRER ≤ 0.7 was defined as the lowenhancement group, and TRER > 0.7 was defined as the high-enhancement group. According to the TRER grouping, the Kaplan-Meier survival curve analysis results showed that the median survival (10.0 mo) with TRER ≤ 0.7 was significantly shorter than that (22.0 mo) with TRER > 0.7 (P< 0.05). In the univariate and multivariate analyses, the prognosis of patients with TRER ≤ 0.7 was significantly worse than that of patients with TRER > 0.7 (P < 0.05). Our results demonstrated that patients in the low TRER group were more likely to have higher American Joint Committee on Cancer stage, tumour stage and lymph node stage (all P < 0.05), and TRER was significantly negatively correlated with tumour size (P < 0.05).CONCLUSION TRER ≤ 0.7 in patients with PDAC may represent a tumour with higher clinical stage and result in a shorter overall survival.
Key Words: Pancreatic cancer; Computed tomography; Diagnostic imaging; Kaplan-Meier curve; Prognosis;Survival analysis
INTRODUCTION
Pancreatic adenocarcinoma is a highly malignant tumour with an estimated 56770 new cases and 45750 deaths in the United States in 2019, according to the American Cancer Society[1]. Very few patients with pancreatic adenocarcinoma have the opportunity for surgical treatment due to the low early diagnosis rate[2]. Surgery is the only potential curative treatment for resectable pancreatic cancer, and adjuvant chemotherapy, mainly gemcitabine-based regimen, is often used to improve outcome[3,4]. In recent years, neoadjuvant chemoradiotherapy has shown efficacy in improving the prognosis of patients with pancreatic cancer[5]. However, the overall prognosis is still unsatisfactory, with a 5-year survival rate as low as 8%[6]. Considering the extremely poor prognosis of pancreatic cancer, it is important to identify indicators of poor prognosis preoperatively or postoperatively. Currently, multiple diagnostic techniques are used to evaluate the aggressiveness or malignancy of pancreatic cancer to formulate the best treatment plan.
A previous study on endoscopic ultrasonography showed that the strain rate of the tumour was positively correlated with the stromal ratio of pancreatic cancer. The stroma of the tumour contributes to tumour growth and progression and plays an important role in chemotherapy resistance. Patients with a high strain rate had a poor prognosis postsurgery, but the survival of locally advanced pancreatic cancer patients receiving nab-paclitaxel and gemcitabine regimen chemotherapy had been improved[7].Another study showed that tumour size, tumour-lymph node-metastasis (TNM) stage and distant metastasis were significantly correlated with overall survival (OS) in pancreatic cancer[8]. Computed tomography (CT) imaging has been widely used in the diagnosis, staging and treatment planning of pancreatic cancer[9]. Pancreatic cancer tumours generally show a low enhancement pattern compared with normal pancreatic tissue[10]. CT texture analysis is also used to evaluate the prognosis of pancreatic cancer[11,12]. Low vascular distribution and high metabolism in pancreatic cancer are important factors in evaluating invasiveness[13].
The purpose of this study was to evaluate the prognostic value of preoperative enhanced CT as a quantitative imaging biomarker in patients with pancreatic cancer based on the imaging characteristics of poor blood supply and CT examination.
MATERIALS AND METHODS
Patient population
The Ethics Committee of Fujian Medical University Union Hospital, Fuzhou, China, approved this retrospective study and waived the requirement for informed consent (No. 2020KY0141).
From March 2011 to May 2018, a total of 138 consecutive patients diagnosed with pancreatic adenocarcinoma who underwent surgical resection in our department were reviewed. The last followup time was February 2020. The inclusion criteria were as follows: (1) Age over 18 years; (2) no neoadjuvant chemoradiotherapy and no previous history of gastrointestinal and pancreatic surgery; (3)nonenhanced and enhanced CT performed within 30 days before surgery; and (4) pancreatic adenocarcinoma confirmed by postoperative pathology. The exclusion criteria were as follows: (1) Stage IV pancreatic cancer; (2) severe complications or multiple primary cancers; (3) obvious pancreatic parenchymal atrophy, large cystic changes of the tumour and calcareous deposition; and (4) loss to follow-up. Patient sex, age, preoperative CT images, preoperative serum carbohydrate antigen 19-9(CA19-9), tumour site, tumour size, American Joint Committee on Cancer (AJCC) (2017) TNM staging,lymph node metastasis, postoperative pathology and differentiation grade, postoperative OS and other data were collected for analysis.
CT image acquisition
CT examination was performed on a 16-row CT scanner (Bright Speed Elite, GE Health care, United States) or a 64-row CT scanner (Discovery CT750 HD, GE Health care, United States). The CT scanning parameters for all phases were as follows: Gantry rotation speed, 0.5 s; tube voltage, 120 kVp; effective amperage, 210 mAs-260 mAs; matrix, 512 × 512; field of view, 350 mm-512 mm; and slice thickness, 5-10 mm. After a nonenhanced scan, 1.5 mL/kg of nonionic contrast agent (ioversol injection, 320 mg of iodine per millilitre, Jiangsu Hengrui Medicine Co., LTD, Jiangsu Province, China) was injected with an automatic syringe at 3.0 mL/s. Using the bolus-tracking technique, a pancreatic parenchymal (PP) phase scan was performed 7 s after the enhanced value of the descending aorta at the aortic hiatus reached 150 HU, and a portal venous (PV) phase scan was performed 25 s after the PP phase scan. CT imaging data were uploaded to the Picture Archiving and Communication System (PACS) (Guangzhou YLZ Ruitu Information Technology Co., LTD, Guangzhou, Guangdong Province, China). In the process of collecting and reviewing the CT imaging results of the patient’s imaging data, we tried our best to make the quality of each patient’s tumour image meet our requirements.
The CT images and tumour relative enhanceement ratio (TRER) were analysed by two experienced radiologists using PACS. The region of the overall tumour (ROT) was delineated along the tumour edge at the largest and most visible level. Four regions of interest (ROIs) with diameters of 0.2-0.3 cm were randomly selected from the normal pancreatic tissue that were more than 1.0 cm away from ROT while avoiding obvious blood vessels, pancreatic ducts, pancreatic fissures and sites susceptible to intestinal gas interference. The average CT values of these 4 ROIs were used as CT values of pancreatic tissue outside the tumour (PTOT).
Tumour enhancement amplitude (TEA) = ROT value of the PV phase – ROT value of the nonenhancement phase.
Pancreas enhancement amplitude outside tumour (PEA) = PTOT value of the PV phase – PTOT value of the nonenhancement phase.
TRER = TEA/PEA.
Statistical analysis
SPSS 25.0 for Windows software from IBM was used to establish a database for statistical analysis.Among the patients’ baseline data, those with a normal distribution of measurement data were represented by the mean ± SD, and an independent sample t test was used for comparisons between groups. The data with a nonnormal distribution were represented by the median and interquartile spacing, and comparisons between groups were tested by the nonparametric Mann-Whitney U test.Enumeration data were expressed in terms of frequency, and comparisons between groups were performed by the chi-squared test or Fisher’s exact test. In the analysis of the relationship between TRER and OS, a receiver operating characteristic (ROC) curve was drawn. When the ROC curve was obtained,the “Coordinates of the Curve” and the corresponding “Sensitivity” and “1-Specificity” could be obtained, and their corresponding Youden indices could be calculated. The TRER corresponding to the maximum value of all Youden indices was the cut-off value of the ROC curve. The patients were divided into two groups according to the cut-off value. The corresponding survival curve was estimated by the Kaplan-Meier method (log-rank test). Cox regression was performed for the univariate (enter model) and multivariate analyses (forward LR model). In the case of correlation analysis between TRER and clinicopathological characteristics, when the clinicopathological features were grouped as unordered categorical variables, the chi-squared test was used for analysis and the Cramer’s V correlation coefficient was calculated; When the clinicopathological features were grouped as ordinal categorical variables, Spearman rank correlation was used for analysis and the Spearman’s correlation coefficient was calculated. The results were considered statistically significant below the bilateral 5%significance level.
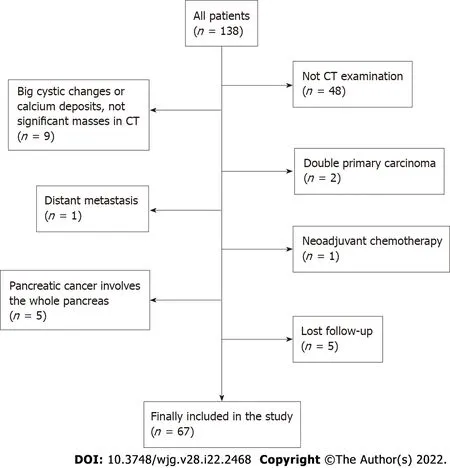
Figure 1 The study flowchart for patient selection. CT: Computed tomography.
RESULTS
Patient characteristics
Of 138 patients, a total of 71 were excluded from the study (a flowchart of patient selection is shown in Figure 1). Ultimately, 67 patients were enrolled in the study. The clinical characteristics of the 67 patients in our study are summarized in Table 1. The mean age of 67 patients was 60.2 ± 10.0 (range, 35-80) years old, with 42 males (62.7%). The tumour was located in the head or uncinate of the pancreas in 44 patients (65.7%) and other sites in 23 patients (34.3%). The median postoperative OS of all patients was 12.3 mo (range, 1.7-42.8 mo).
CT value, TRER and CT enhancement situation
The CT values of the nonenhancement and PV phases in tumour and extratumoural regions are shown in Table 2. The median TRER was 0.57 (interquartile range, 0.41-0.78).
In the analysis of CT images, we also found that the CT values of ROT and PTOT gradually increased from the nonenhancement phase to the PV phase, but not all CT values of the PV phase were higher than those of the PP phase (Table 3).
Survival analysis
The ROC curve was drawn according to TRER, as shown in Figure 2A. The area under the curve of the ROC curve was 0.768 (P = 0.007). The cut-off value of the ROC curve was calculated to be 0.7, and the patients were classified according to the cut-off value. TRER ≤ 0.7 was defined as the low-enhancement group, TRER > 0.7 was defined as the high-enhancement group, and the Kaplan-Meier survival curve analysis results showed that the median survival (10.0 mo) with TRER ≤ 0.7 was significantly worse than that (22.0 mo) with TRER > 0.7 (P < 0.05) (Figure 2B). Typical CT images of the low- and highenhancement groups are shown in Figures 3 and 4, respectively.
There was no significant difference in age, sex, tumour location, CA19-9, tumour differentiation,vascular invasion, surgical margin or adjuvant chemotherapy distribution between the low-and highenhancement groups except the AJCC stage (P = 0.015) (Table 4).
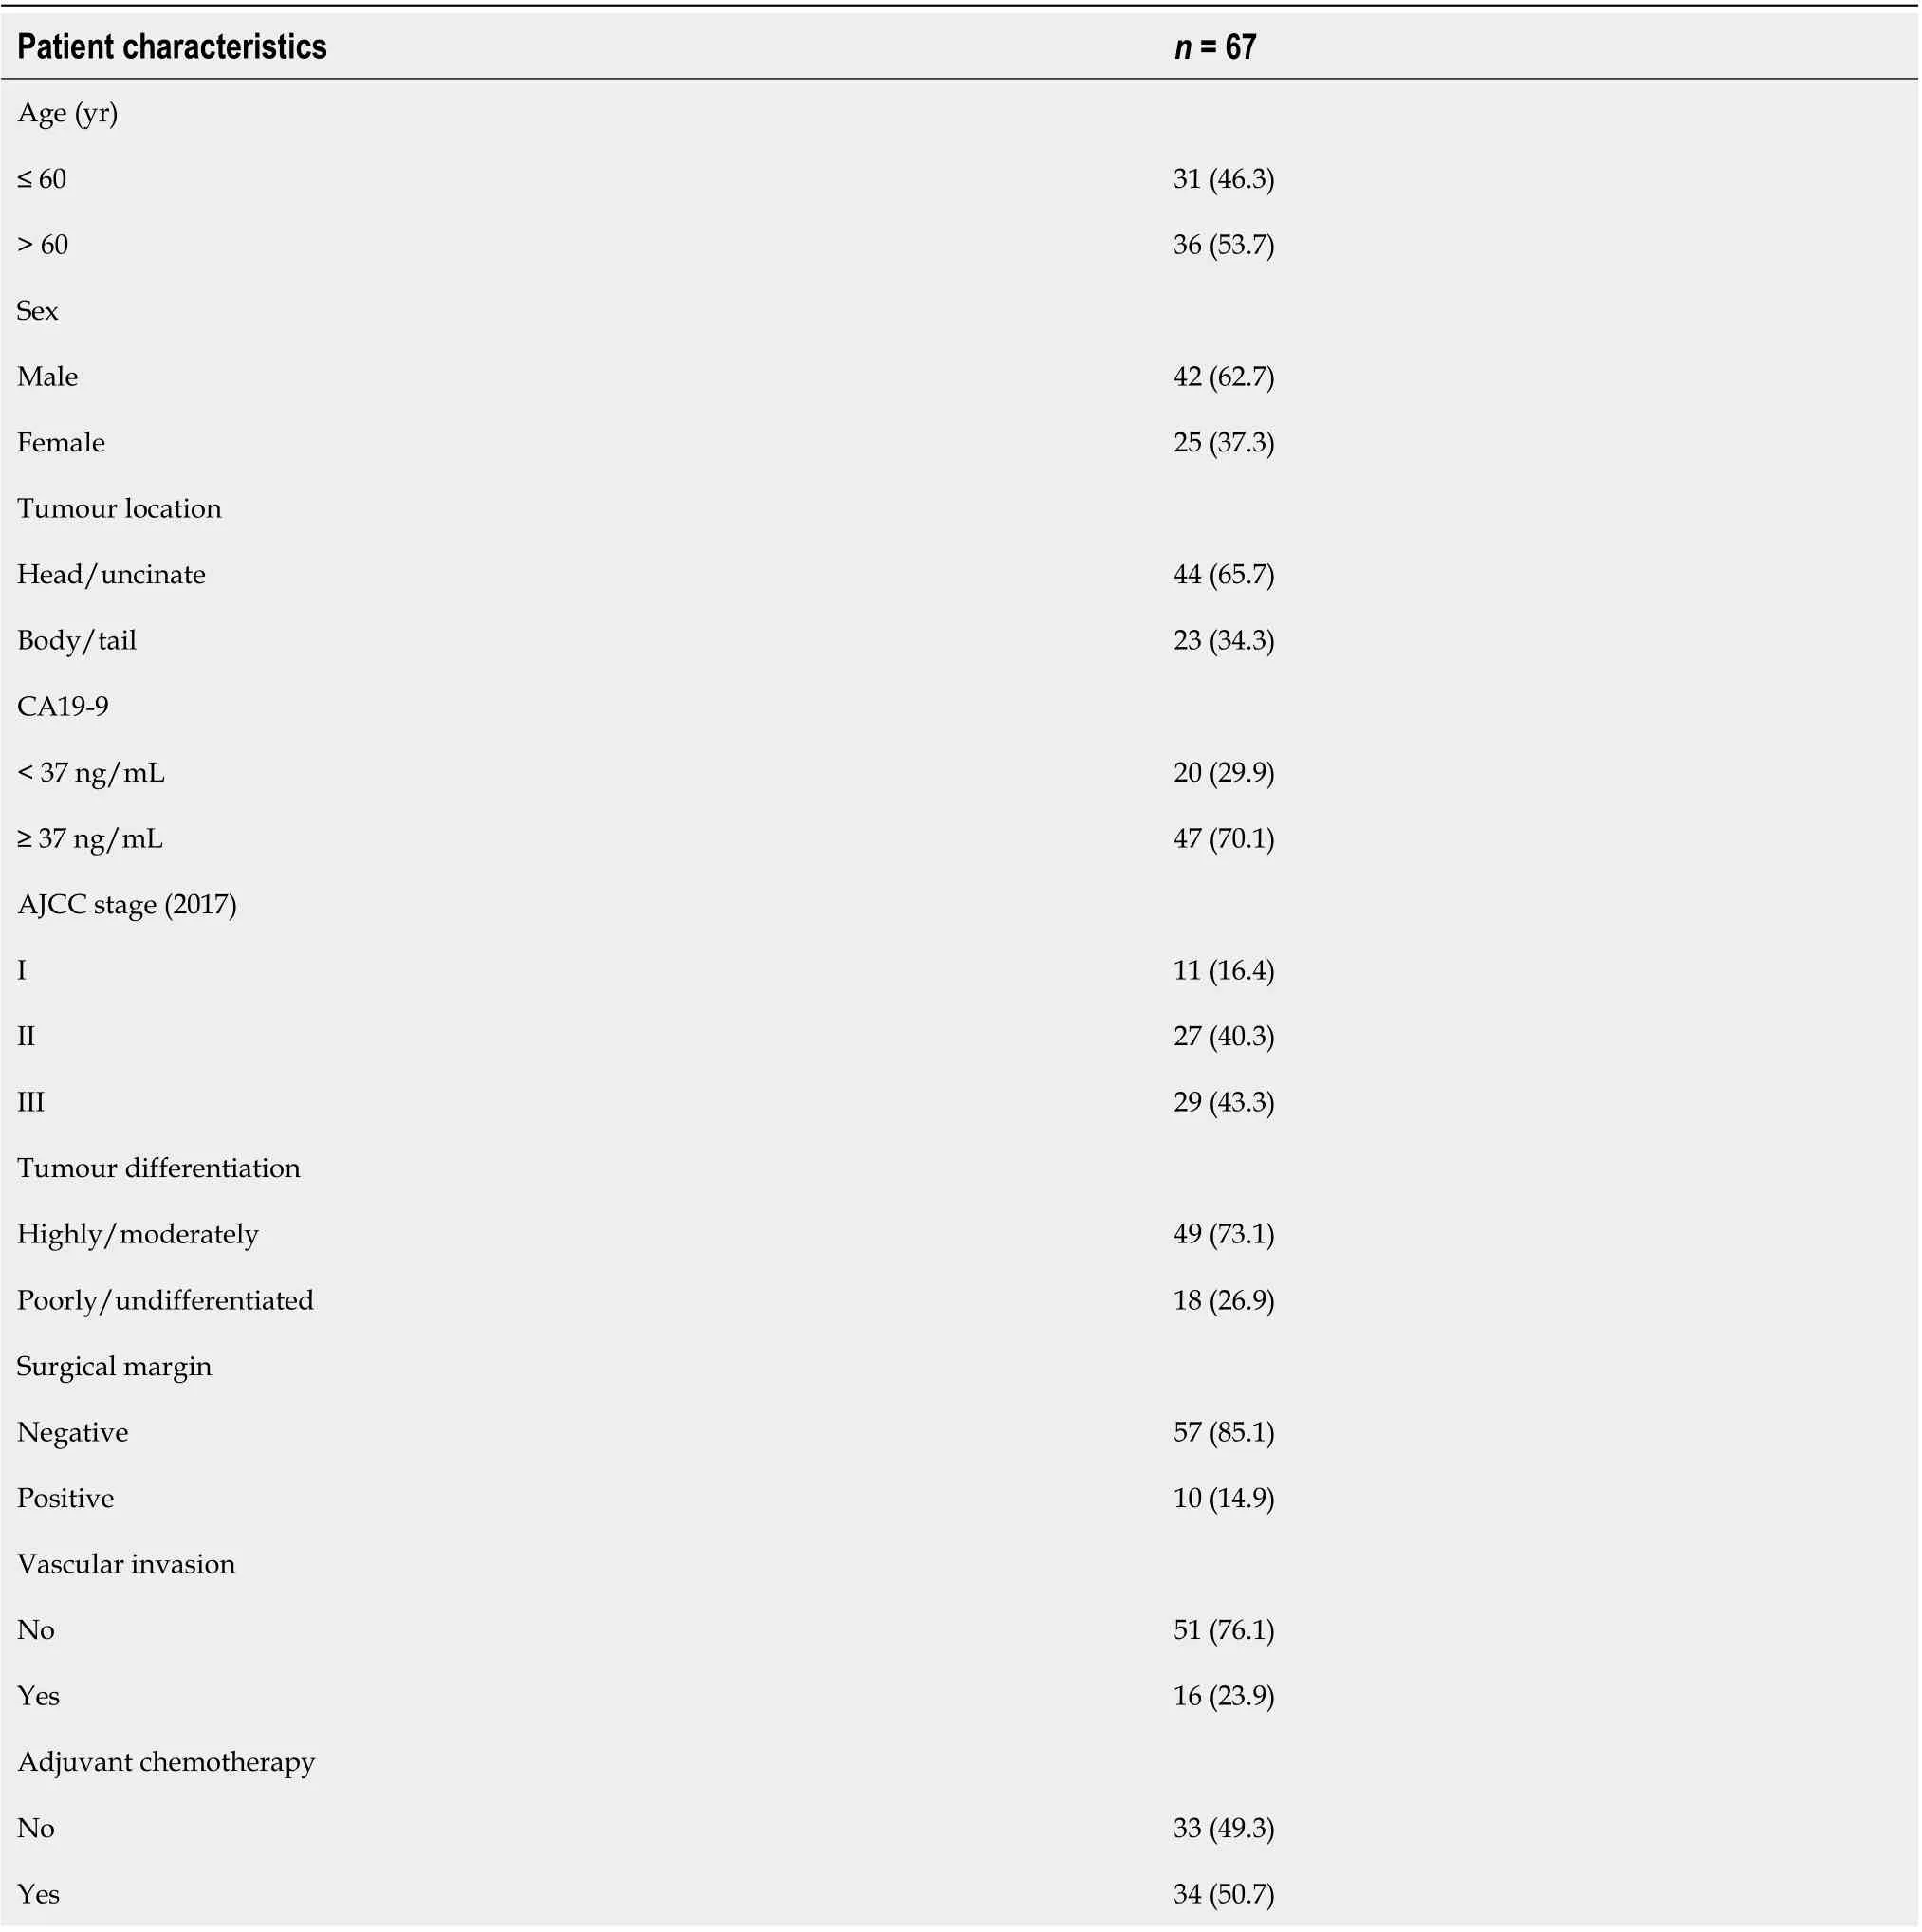
Table 1 Patient characteristics, n (%)
Univariate and multivariate analyses
Univariate and multivariate analyses of Cox regression were performed for clinical data and TRER(Tables 5 and 6). In the univariate analysis, AJCC stage (P = 0.005), preoperative CA19-9 (P = 0.033),postoperative adjuvant chemotherapy (P = 0.000) and TRER (P = 0.001) were significantly correlated with postoperative OS, while other factors had no significant influence on postoperative OS. In the multivariate analysis, preoperative CA19-9 (P = 0.015), tumour differentiation (P = 0.001), surgical margin (P = 0.008), postoperative adjuvant chemotherapy (P = 0.000) and TRER (P = 0.009) were significantly correlated with postoperative OS.
Correlation between TRER and clinicopathological characteristics
A correlation analysis was conducted between TRER and clinicopathological characteristics (Table 7).The results showed that TRER was not significantly correlated with tumour location, preoperative serum CA19-9, lymph node metastasis, vascular invasion, or tumour differentiation (all P > 0.05).However, TRER was significantly correlated with AJCC stage (P = 0.003, Spearman correlation coefficient = -0.353), T stage (P = 0.005, Cramer’s V correlation coefficient = 0.343), and N stage (P =0.046, Spearman correlation coefficient = -0.245). The analysis of the relationship between TRER andtumour size showed that TRER was negatively correlated with tumour size (P = 0.001) (Figure 5).

Table 2 Computed tomography attenuation values and tumour relative enhancement ratio

Table 3 Computed tomography enhancement situation comparing the portal venous phase to the pancreatic parenchymal phase

Figure 2 The receiver operating characteristic curve and Kaplan-Meier survival curve analysis. A: The receiver operating characteristic curve of tumour relative enhancement ratio (TRER) for patients with pancreatic ductal adenocarcinoma. The area under the curve was 0.768 (P = 0.007). The cut-off value was 0.7; B: Kaplan-Meier survival curve of postoperative overall survival for low-TRER patients and high-TRER patients. TRER: Tumour relative enhancement ratio.
DISCUSSION
Pancreatic cancer is a tumour with a very poor prognosis. CT plays important roles in the diagnosis of pancreatic cancer and the evaluation of the relationship between tumours and peripheral blood vessels.Our study found the clinical value of enhanced CT as a quantitative image in predicting the prognosis of pancreatic cancer.
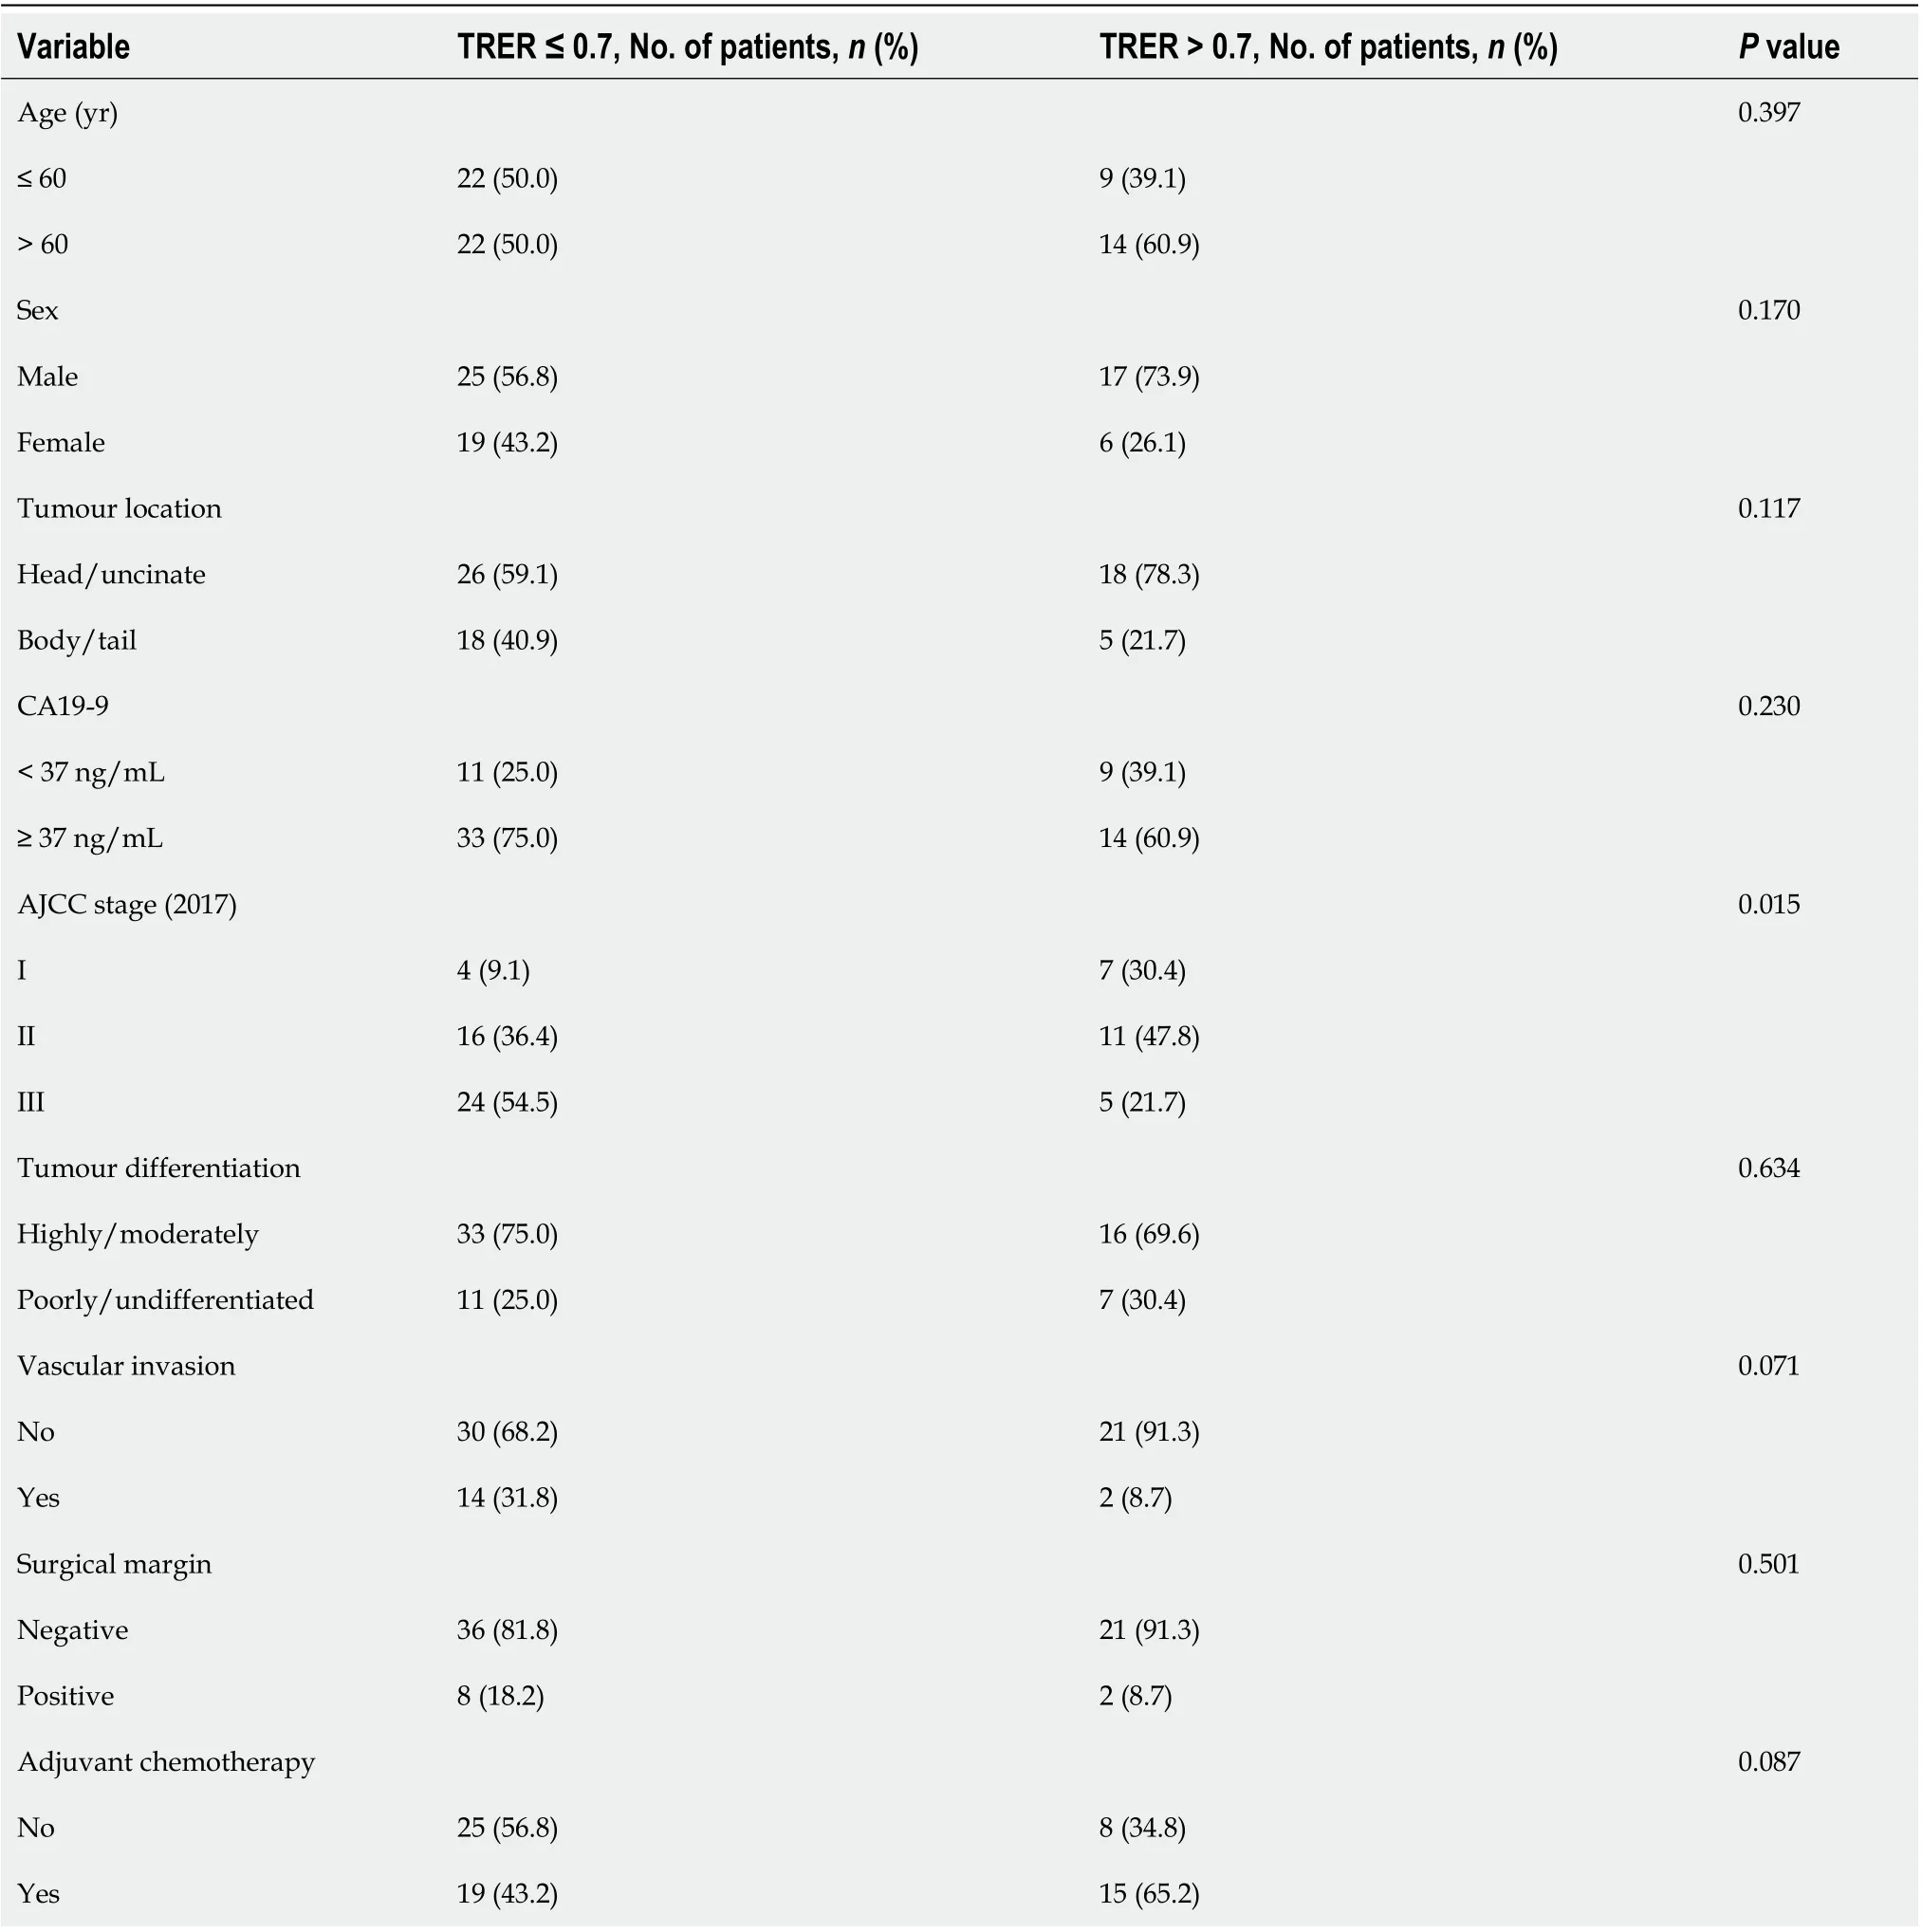
Table 4 Baseline characteristics of the low-and high-enhancement groups
For patients with pancreatic cancer, TNM staging, tumour size, lymph node positive rate, log odds of positive lymph nodes, R0 resection and other factors are related to patient recurrence-free survival and OS[14-16]. Our analysis results showed that patients in the low TRER group were more likely to have higher TNM stage, T stage and N stage, and TRER was significantly negatively correlated with tumour size, demonstrating that TRER could be used to predict the postoperative OS of pancreatic cancer.However, in our study, the tumour stage (AJCC) was significant in the univariate analysis but not in the multivariate analysis. This difference might be due to the relatively small sample size. Many imaging techniques combining qualitative and quantitative information with pathological findings of the tumour have been used to analyse the aggressiveness of the tumour to determine the prognosis of the patient from preoperative imaging information. Dynamic contrast-enhanced CT (DCE-CT) also shows potential value in predicting tumour response to treatment and outcome[17,18].
Currently, the qualitative analysis of CT images has gained increasing attention for the prognostic analysis of pancreatic cancer. Pancreatic adenocarcinoma, unlike other solid tumours, is known as a cold tumour with insufficient blood supply. The pathological type of 90% pancreatic cancer is invasive ductal adenocarcinoma, which is one of the most stromal malignant tumours[19,20]. The pancreas is a retroperitoneal organ, very close to the common hepatic artery, celiac artery, portal vein, superiormesenteric vessels, and splenic vessels. As pancreatic cancer progresses, it has early infiltration or perivascular desmoplastic reactions, which can influence its direct blood supply. The correlation analysis in our study showed that the vascular invasion rate in the low TRER group was higher (31.8%)than that in the high TRER group (8.7%), but P = 0.071, which might be due to the relatively small sample size.
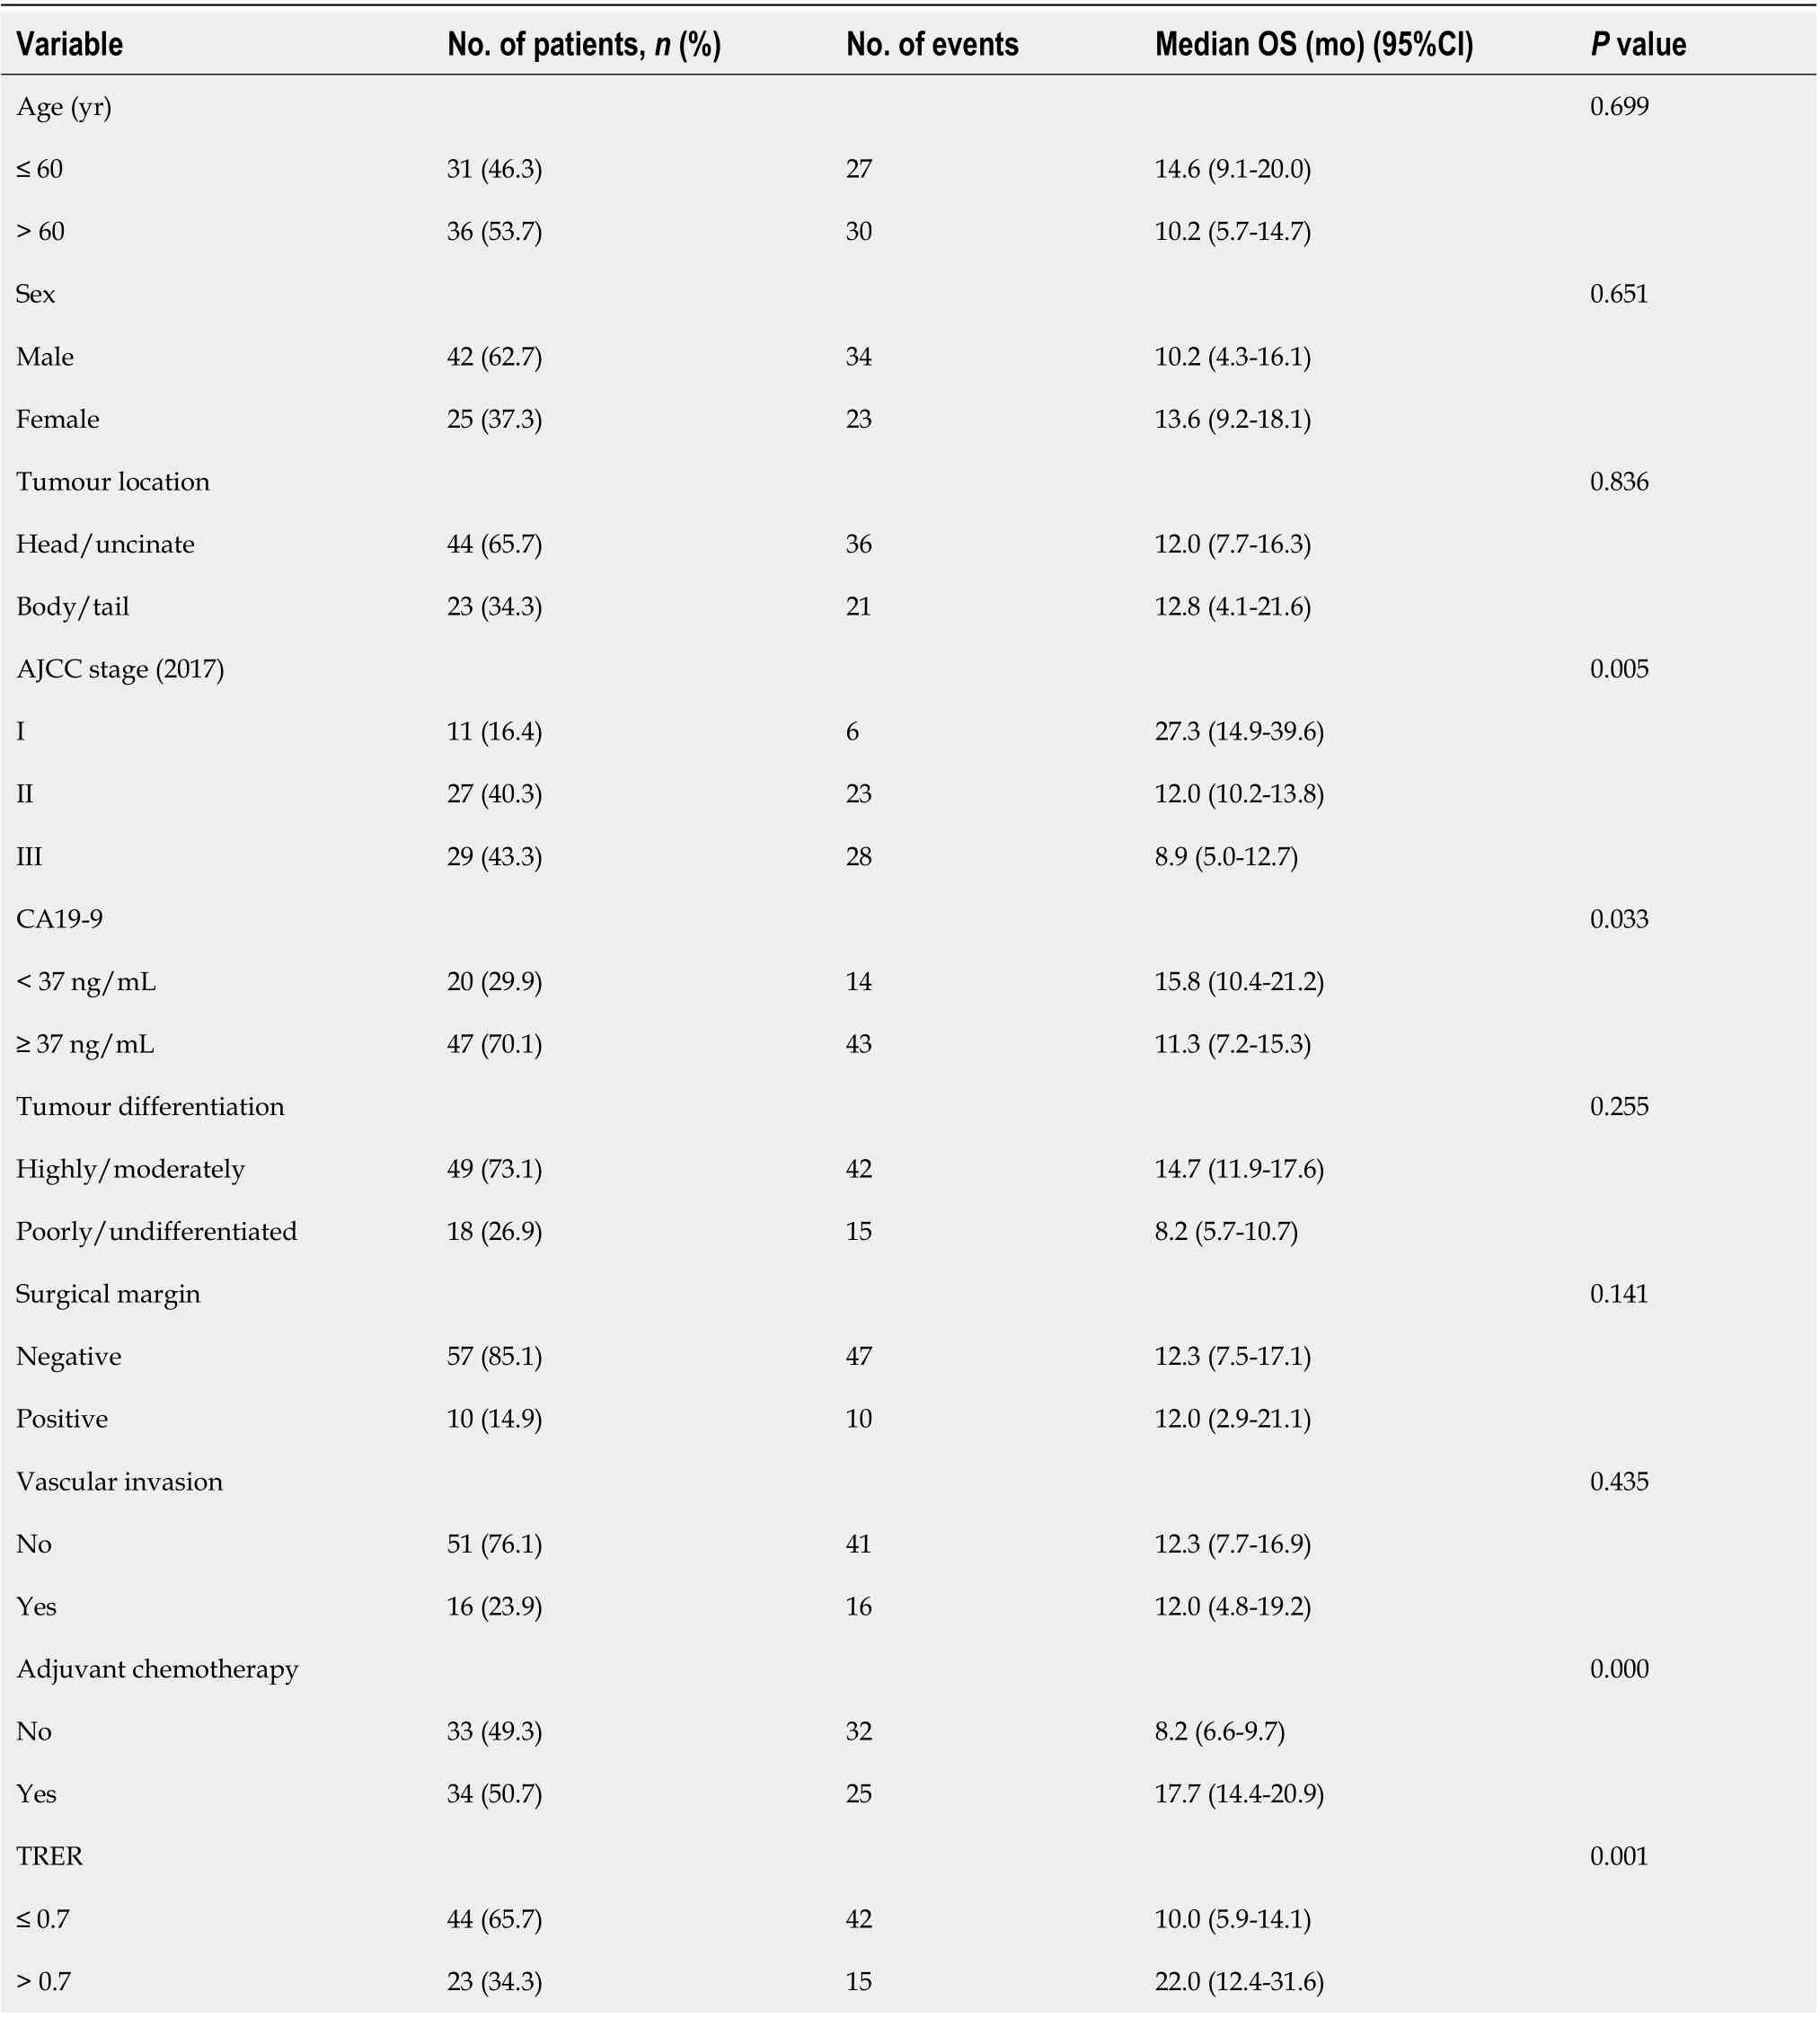
Table 5 Univariate analysis using Cox regression for postoperative overall survival in all patients
In our study, we did not find any relationship between TRER and pathological differentiation of pancreatic cancer. However, a previous study on DCE-CT showed that pancreatic tumour CT enhancement was negatively correlated with pathological grade and the degree of malignancy[21,22]. In pancreatic cancer, fibroblast hyperplasia and vascular reduction are caused by a high fibrinolysis response, which results in a low-enhancement CT pattern compared with PTOT[23]. Some studies have shown that there is no significant difference in the perfusion values of the pancreatic head, body and tailin normal pancreatic tissues, while the perfusion values and blood flow in the tumour centre of pancreatic cancer patients are lower than those of PTOT[24,25]. Some researchers have reported that necrosis within pancreatic adenocarcinoma influences tumour enhancement on CT[26,27]. Tumour necrosis is the final result of hypoxia, which can accelerate the progression of malignant tumours[28,29]. It is well known that larger tumours are more prone to necrosis. The indirect relationship between large tumours and weakened CT enhancement was confirmed in our research. The TRER also indirectly reflects the necrosis of the tumour. A previous study showed that patients with low CT values in pancreatic tumours at the parenchymal stage, portal venous stage, and delayed stage had shorter postoperative survival times in the univariate analysis, whereas the CT values at the pancreatic tumour parenchymal stage were positively correlated with prognosis in the multivariate analysis[30]. When Cassinotto et al[31] measured the average attenuation value of the overall tumour and the lowest attenuation value in the tumour centre at the PV phase, they found that lower attenuation values at the PV phase reflected higher degree of malignancy, more likely lymph node invasion, and shorter diseasefree survival. The lowest attenuation in the tumour centre also reflected the degree of necrosis within the tumour tissue. However, if only the changes in pancreatic tumours after CT enhancement were analysed, it would be easy to ignore the changes in PTOT. Due to the lack of control, the difference in enhancement amplitude between ROT and PTOT could not be analysed, which would lead to the inability to analyse whether the change was caused by the tumour itself or by the blood supply of the pancreatic organs as a whole. Visually isoattenuating pancreatic cancer is defined as when the attenuation of the tumour, compared with the pancreatic parenchyma, is not visually observed to increase or decrease at both arterial and portal venous phases. In this type of tumour, the number of cancer cells is lower, the degree of tumour necrosis is lower, the prognosis is better, and an increase in serum CA19-9 is rare[27]. In our study, although the scanning period selected was the nonenhancement and PV phases, which were different from the study of visually isoattenuating pancreatic cancer, they essentially reflected the increase in tumour CT value after enhanced CT examination, and the resultswere similar; that is, patients with lower tumour CT enhancement amplitude had shorter OS. At the same time, we found no correlation between TRER and the increase in CA19-9. In Zhu et al's study, the relative enhancement change (REC) was defined as the proportion of enhancement change between the tumour and pancreatic parenchyma during the PP and PV phases, showing that the postoperative OS of patients with REC < 0.9 was worse than those with REC ≥ 0.9[32]. Pancreatic cancer tissues are rich in fibrous tissue and show a pattern of delayed enhancement. However, our data showed that not all CT values of the PV phase were higher than those of the PP phase, regardless of ROT or PTOT. The CT value of the PV phase minus that of the PP phase may be negative. Therefore, when we designed the study, CT values of the PV and nonenhancement phases were selected for comparison. The final results showed that patients with a smaller TRER had worse a prognosis.

Table 6 Multivariate analysis using Cox regression for postoperative overall survival in all patients

Figure 3 A 61-year-old woman with a mass in the head of the pancreas. A-C: The nonenhancement phase (A), pancreatic parenchymal (PP) phase (B)and portal venous (PV) phase (C) of region of the overall tumour, respectively; D-F: The nonenhancement phase (D), PP phase (E) and PV phase (F) of pancreatic tissue outside the tumour, respectively. Tumour relative enhancement ratio ≤ 0.7, and the postoperative overall survival was 5.5 mo.

Table 7 Correlation between tumour relative enhancement ratio and clinicopathological characteristics
Although TRER is associated with AJCC stage, T stage, and N stage, it is not a substitute for lymph node status, tumour size, or stage. Pancreatic cancer is a kind of cold tumour with abundant stroma, and the stroma contributes to tumour growth and progression and plays an important role in the chemoresistance. This pathological feature of pancreatic cancer is similar to the pathological differentiation of tumours. It represents the characteristics of the pathology and growth of pancreatic cancer itself and will not disappear because the tumour is removed. The low-enhancement mode of CT in pancreatic cancer is partly due to the high stromal ratio of pancreatic cancer. Based on this, TRER is used as a quantitative reflection of the low-enhancement mode of CT in pancreatic cancer and the richness of pancreatic cancer stroma, which is used to predict postoperative OS. Moreover, because the postoperative prognosis of patients with low TRER is poor, such patients can consider whether to receive neoadjuvant chemotherapy.

Figure 4 A 54-year-old woman with a mass in the head of the pancreas. A-C: The nonenhancement phase (A), pancreatic parenchymal (PP) phase (B)and portal venous (PV) phase (C) of region of the overall tumour, respectively; D-F: The nonenhancement phase (D), PP phase (E) and PV phase (F) of pancreatic tissue outside the tumour, respectively. Tumour relative enhancement ratio > 0.7, and the postoperative overall survival was 27.3 mo.
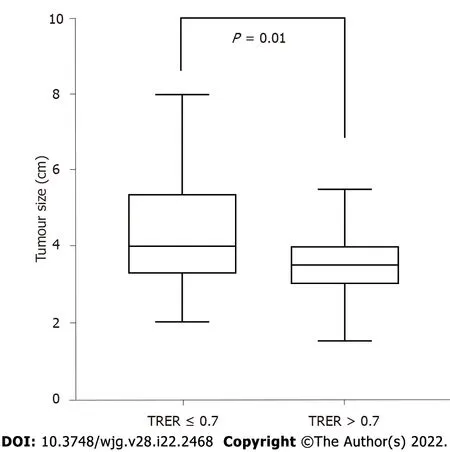
Figure 5 Correlation analysis between tumour size and tumour relative enhancement ratio. TRER: Tumour relative enhancement ratio.
Because tumour heterogeneity is affected by tumour blood supply, the ratio of tumour cells to stromal cells and tumour necrosis will lead to different CT values in different parts of the tumour.Although whole-volume quantitative analysis of tumour CTs is currently available, it has not been analysed in our study for the following reasons: (1) At the largest and most visible level of the tumour in CT images, the change of the tumour relative to surrounding tissue is relatively obvious, and it is easy to identify the boundary of the tumour. Moreover, it is simple to obtain the average CT value of ROT;and (2) compared with the largest level of the tumour, the CT value of the whole volume may be more easily affected by the obvious blood vessels and dilated pancreatic duct in the tumour.
There are several limitations in our study: (1) This was a retrospective study with a relatively small sample size at a single institution; (2) patients with metastasis were not studied; and (3) patients received a variety of postoperative treatments, making it difficult to further accurately classify and perform a survival analysis, which might lead to a degree of bias.
CONCLUSION
In conclusion, TRER is a quantitative index of CT enhancement. This study showed that when the TRER of pancreatic adenocarcinoma patients was not more than 0.7, the prognosis was significantly worse,demonstrating the prognostic value of preoperative enhanced CT as a quantitative imaging biomarker in patients with pancreatic cancer.
ARTICLE HIGHLIGHTS
Research background
Computed tomography (CT) is widely used in the diagnosis, staging and treatment of pancreatic tumours. Because being rich in stroma, pancreatic cancer generally shows a low enhancement pattern compared with normal pancreatic tissue.
Research motivation
We want to use preoperative enhanced CT as a quantitative imaging biomarker to accurately predict the prognosis of patients with pancreatic cancer.
Research objectives
To analyse prognostic value of preoperative enhanced CT in pancreatic cancer.
Research methods
Sixty-seven patients with pancreatic ductal adenocarcinoma undergoing pancreatic resection were enrolled retrospectively. All patients underwent preoperative unenhanced and enhanced CT examination, the CT values of which were measured. The ratio of the preoperative CT value increase from the nonenhancement phase to the portal venous phase between pancreatic tumour and normal pancreatic tissue was calculated. The cut-off value of ratios was obtained by the receiver operating characteristic curve of the tumour relative enhancement ratio (TRER), according to which patients were divided into low- and high-enhancement groups. Cox regression was performed for the univariate(enter model) and multivariate analyses (forward LR model). Finally, Spearman rank correlation or chisquare test was used to analyse the correlation between TRER and clinicopathological characteristics.
Research results
TRER is a quantitative index of enhancement CT. This study showed that the prognosis of patients with the TRER ≤ 0.7 was significantly worse. TRER is a simple and effective parameter. Our results demonstrated that patients in the low TRER group were more likely to have higher American Joint Committee on Cancer stage, tumour stage, lymph node stage, and TRER was significantly negatively correlated with tumour size.
Research conclusions
TRER is a quantitative indicator of enhanced CT and can be used to predict postoperative overall survival in pancreatic cancer.
Research perspectives
In the future, we will further study the value of preoperative enhanced CT in predicting the efficacy of chemotherapy.
FOOTNOTES
Author contributions:All authors contributed to this paper; Gao JF, Pan Y, Lin XC, Lu FC, Qiu DS, Liu JJ, and Huang HG substantially contributed to conception and design of the study, acquisition of data, or analysis and interpretation of data; Gao JF, Lu FC, and Huang HG contributed to drafting the article or making critical revisions related to important intellectual content of the manuscript; Gao JF, Pan Y, Lin XC, Lu FC, Qiu DS, Liu JJ, and Huang HG finally approved the version of the article to be published.
Supported bythe Medical Centre of Minimally Invasive Technology of Fujian Province, No. 2017[171], and No.2017[4]; Joint Funds for the Innovation of Science and Technology, Fujian Province, No. 2017Y9059; and the United Fujian Provincial Health and Education Project for Tackling the Key Research, No. 2019-WJ-07.
Institutional review board statement:The Ethics Committee of Fujian Medical University Union Hospital approved this retrospective study (No. 2020KY0141).
Informed consent statement:Because of the retrospective and anonymous character of this study, the institutional review committee waived the requirement for informed consent.
Conflict-of-interest statement:The authors declare no conflicts of interest.
Data sharing statement:No additional data are available.
Open-Access:This article is an open-access article that was selected by an in-house editor and fully peer-reviewed by external reviewers. It is distributed in accordance with the Creative Commons Attribution NonCommercial (CC BYNC 4.0) license, which permits others to distribute, remix, adapt, build upon this work non-commercially, and license their derivative works on different terms, provided the original work is properly cited and the use is noncommercial. See: http://creativecommons.org/Licenses/by-nc/4.0/
Country/Territory of origin:China
ORCID number:Jian-Feng Gao 0000-0002-2058-9348; Yu Pan 0000-0002-7417-4551; Xian-Chao Lin 0000-0003-4165-8792;Feng-Chun Lu 0000-0002-0783-0547; Ding-Shen Qiu 0000-0003-2874-5496; Jun-Jun Liu 0000-0001-9338-4063; He-Guang Huang 0000-0003-1459-5546.
S-Editor:Yan JP
L-Editor:A
P-Editor:Yan JP
 World Journal of Gastroenterology2022年22期
- World Journal of Gastroenterology的其它文章
- Future therapies for pancreatic carcinoma: Insights into cancer precision medicine
- Saccharomyces cerevisiae I-3856 in irritable bowel syndrome with predominant constipation
- Endoscopic classification and pathological features of primary intestinal lymphangiectasia
- Application of endoscopic ultrasonography for detecting esophageal lesions based on convolutional neural network
- Metabolic aspects of hepatitis C virus
- Hepatocellular carcinoma, hepatitis C virus infection and miRNA involvement: Perspectives for new therapeutic approaches
