
One hundred marathons in 100 days:Unique biomechanical signature and the evolution of force characteristics and bone density
2022-06-09 09:23PieterVandenBergheBastiaanBreineEllaHaeckDirkDeClercq
Pieter Van den Berghe*,Bastiaan Breine,Ella Haeck,Dirk De Clercq
Department of Movement and Sports Sciences,Ghent University,Ghent 9000,Belgium
Abstract Background: An extraordinary long-term running performance may benefit from low dynamic loads and a high load-bearing tolerance.An extraordinary runner(age=55 years,height=1.81 m,mass=92 kg)scheduled a marathon a day for 100 consecutive days.His running biomechanics and bone density were investigated to better understand successful long-term running in the master athlete. Methods:Overground running gait analysis and bone densitometry were conducted before the marathon-a-day challenge and near its completion.The case’s running biomechanics were compared pre-challenge to 31 runners who were matched by a similar foot strike pattern. Results:The case’s peak vertical loading rate(Δx̄=-61.9 body weight(BW)/s or-57%),peak vertical ground reaction force(Δx̄=-0.38 BW or-15%),and peak braking force(Δx̄=-0.118 BW or-31%)were remarkably lower(p <0.05)than the control group at ~3.3 m/s.The relatively low loading-related magnitudes were attributed to a remarkably high duty factor(0.41)at the evaluated speed.The foot strike angle of the marathoner (29.5°) was greater than that of the control group, affecting the peak vertical loading rate.Muscle powers in the lower extremity were also remarkably low in the case vs.controls: peak power of knee absorption (Δx̄=-9.16 watt/kg or -48%) and ankle generation(Δx̄=-3.17 watt/kg or -30%).The bone mineral density increased to 1.245 g/cm2 (+2.98%) near completion of the challenge, whereas the force characteristics showed no statistically significant change. Conclusion: The remarkable pattern of the high-mileage runner may be useful in developing or evaluating load-shifting strategies in distance running.
Keywords: Bone;Gait analysis;Ground reaction force;Load;Running
1.Introduction
Multi-stage running challenges can be completed by an individual who is incredibly gifted and motivated.1We had the opportunity to study a highly experienced and motivated long-distance runner who scheduled a marathon a day for 100 consecutive days.Such an endurance challenge can only be completed if the marathoner remains injury free.The incidence of running-related injuries associated with a single marathon is, unfortunately, already high.2,3Conceptually, the exceeding of the load tolerance of biological material due to an applied load results in injury.4Multiple loading-related variables have been prospectively associated with running injuries,5-8often depending on the investigated population and the follow-up methodology.Exemplar variables are the peak vertical loading rate of the ground reaction force,5the estimated peak vertical ground reaction force,6the peak braking force,8and the absolute knee stiffness.7So,running-related injuries have a diverse and multifactorial etiology at the whole-body level.9At the tissue level,overuse injury is a biomechanical event resulting from the mechanical fatigue of biological tissue,10with a high repetitive load magnitude resulting in a short fatigue life of biological tissue.The vertical ground reaction force is the primary external force acting on runners.High external force has resulted in high structure load in level running over a range of endurance running speeds.11Hence, long-distance running with relatively low running ground reaction forces may be advantageous for the completion of a multi-stage challenge on level terrain.
Mechanical fatigue tests do not support the general notion that greater loading rates are deleterious to the musculoskeletalsystem.10Nevertheless,assuming the previously observed positive relationship between peak vertical loading rate and injury is real, Edwards10has speculated that decreased peak vertical loading rate may be associated with lower-extremity mechanics that also decrease stress and strain magnitudes.Therefore, the comparison of the marathoner to controls comprised a range of variables including surrogate measures of tissue loading derived from external force and lower limb joint mechanics.Joint-level analysis has shown the knee primarily absorbs mechanical energy in the stance phase of running gait.12Armstrong13has argued that primarily eccentric contraction causes muscle damage during level animal running since the highest tensions in the leg extensor muscles are produced while these muscles are lengthening following touchdown,and while the center of mass is decelerating.It is thus unsurprising that the knee eccentric joint work has been included in running gait analyses when dealing with running form and associated injury risk.7,12,14
Gait mechanics and running ground reaction forces are linked,15-17meaning the external load can be influenced by running form.When steady-speed level running is assumed, the vertical ground reaction force waveform is the result of the vertical collision of the lower limb with the surface and the concurrent vertical accelerations of the rest of the body during ground contact.15The vertical ground reaction force curve has been modeled as the sum of the 2 individual force waveforms.15The first waveform depends on the vertical acceleration of the lower limb mass during the impact interval and largely affects the peak vertical loading rate.Hence, a relatively low vertical momentum of the stance foot and shank(i.e., the touchdown velocity of the foot and the axial peak tibial acceleration)is expected in a low-impact runner.The second waveform comprises the modeled peak vertical ground reaction force.The modeled peak value depends on the flight time and the contact time in simple modeling of the force-time curve.15,18Furthermore,Blum and colleagues17have predicted and validated a relationship between the peak vertical ground reaction force and duty factor in a running spring-mass model at dimensionless speed.Thus, the combination of a shortened flight time and a prolonged contact time (i.e., a greater duty factor)at alike step frequency should result in a relatively low peak vertical ground reaction force at a given running speed.If the extraordinary marathoner would experience relatively low running ground reaction forces, the case might also offer insights into attributable kinematics.For instance, touchdown kinematics affect the peak vertical loading rate of a rearfoot striker in a particular direction.19-21Reducing the vertical touchdown velocity of the foot, increasing the foot strike angle, or decreasing the posterior inclination of the shank at touchdown have separately lowered the peak vertical loading rate during a simulated impact in a rearfoot strike pattern.16
The ability to withstand load should be high enough to tolerate the repetitive loading evoked by long-distance runs.Experienced and highly trained long-distance runners thereby have an advantage when it comes to remaining injury-free,according to Knechtle and Nikolaidis.22These runners would greatly benefit from a high load-bearing tolerance to remain free of overuse injury despite high training volumes.Inversely, injury-free highmileage runners are very likely to have high load-bearing capacities.The extraordinary marathoner most likely benefits from the 900 marathons he has already completed in his sportive career.Still,bone stress injury is a concern among long-distance runners,and male athletes who experienced trabecular-rich bone stress injuries were more likely to have low bone mineral density.23Bone mineral density has been used as a surrogate of bone strength, and therefore loadability, and is helpful to benchmark the marathoner based on normative values.Still,damage-induced tissue adaptation is likely to play a key role in the mechanical fatigue process.10Bone can adapt over a relatively brief period of time(e.g.,a physically demanding program of 8 weeks24).Longdistance running is an outstanding model for the study of adaptive responses to extreme cyclic loading.1A marathon a day for 14 weeks can serve as an example of massive weight-bearing aerobic exercise.Assessing bio-positive or bio-negative changes in bone density may thereby reveal skeletal adaptations that occur in response to the extreme endurance challenge.
This study represents a unique attempt to examine the running biomechanics of an extraordinary marathoner and the adaptive response of the human body over time.We monitored the self-declared “marathon man” when he scheduled a marathon a day for 100 consecutive days.Ground reaction forces,touchdown kinematics, net joint moments, and muscle powers in the ankle and knee joints were compared between the marathoner(pre-challenge)and a group of uninjured distance runners matched by foot strike pattern.Ground reaction force characteristics and bone mineral density were determined before the marathon-a-day challenge and near its completion.For successful completion of the extreme endurance challenge we expected to see relatively low external loading and high load tolerance in the high-mileage runner.No major changes in force characteristics (peak vertical ground reaction force, peak instantaneous vertical loading rate, and peak braking force) were expected because of a motorically grinded running pattern.Remarkable scores for the marathoner’s loading-related variables were explained by the mentioned modeling studies15-17and by the re-evaluation of empirical data from our lab.
2.Methods
A case-controls design was complemented with a longitudinal case design (Fig.1).Loading-related variables were compared between an extraordinary marathoner and a normative sample of runners matched by a similar foot strike pattern.Ground reaction force characteristics and the bone mineral density of the marathoner were followed over time and respectively compared with controls.Correlation and regression analyses were executed post hoc in a heterogeneous sample of distance runners to help explain some of the case observations.
2.1.Participants
The marathoner (body height=1.81 m, mass=92 kg,age=55 years) initiated a marathon-a-day challenge for 100 consecutive days (12.11.2016-19.02.2017, Run2gether(e)-project) at a comfortable running speed,25with a secondary aim of completing a total of 1000 marathons in his sportivecareer.26He successfully ran the first marathon of his career in 1992,obtained his personal best(2 h 57 min 12 s)at the age of 44 in Rotterdam,has held the record for the most Ironman Triathlons in a year,and has completed a marathon a day for 365 consecutive days in 2010-2011.The normative group consisted of a sample of 31 uninjured runners (male: 21, female:10, height=1.74 ± 0.08 m, mass=68.2 ± 8.6 kg, age=29.9± 9.2 years, mean ± SD; self-reported running volume=30 km/week)with known peak vertical loading rates and sagittal plane kinematics.19,27This normative group was chosen because of the homogeneous foot strike pattern (i.e.,typical rearfoot)and ethnicity,and because their gait data was similarly collected.Written informed consent was obtained from all subjects.Ethical approval to analyze the running gait of the normative group and the marathoner was obtained from the Ethical Committee of the Ghent University Hospital.
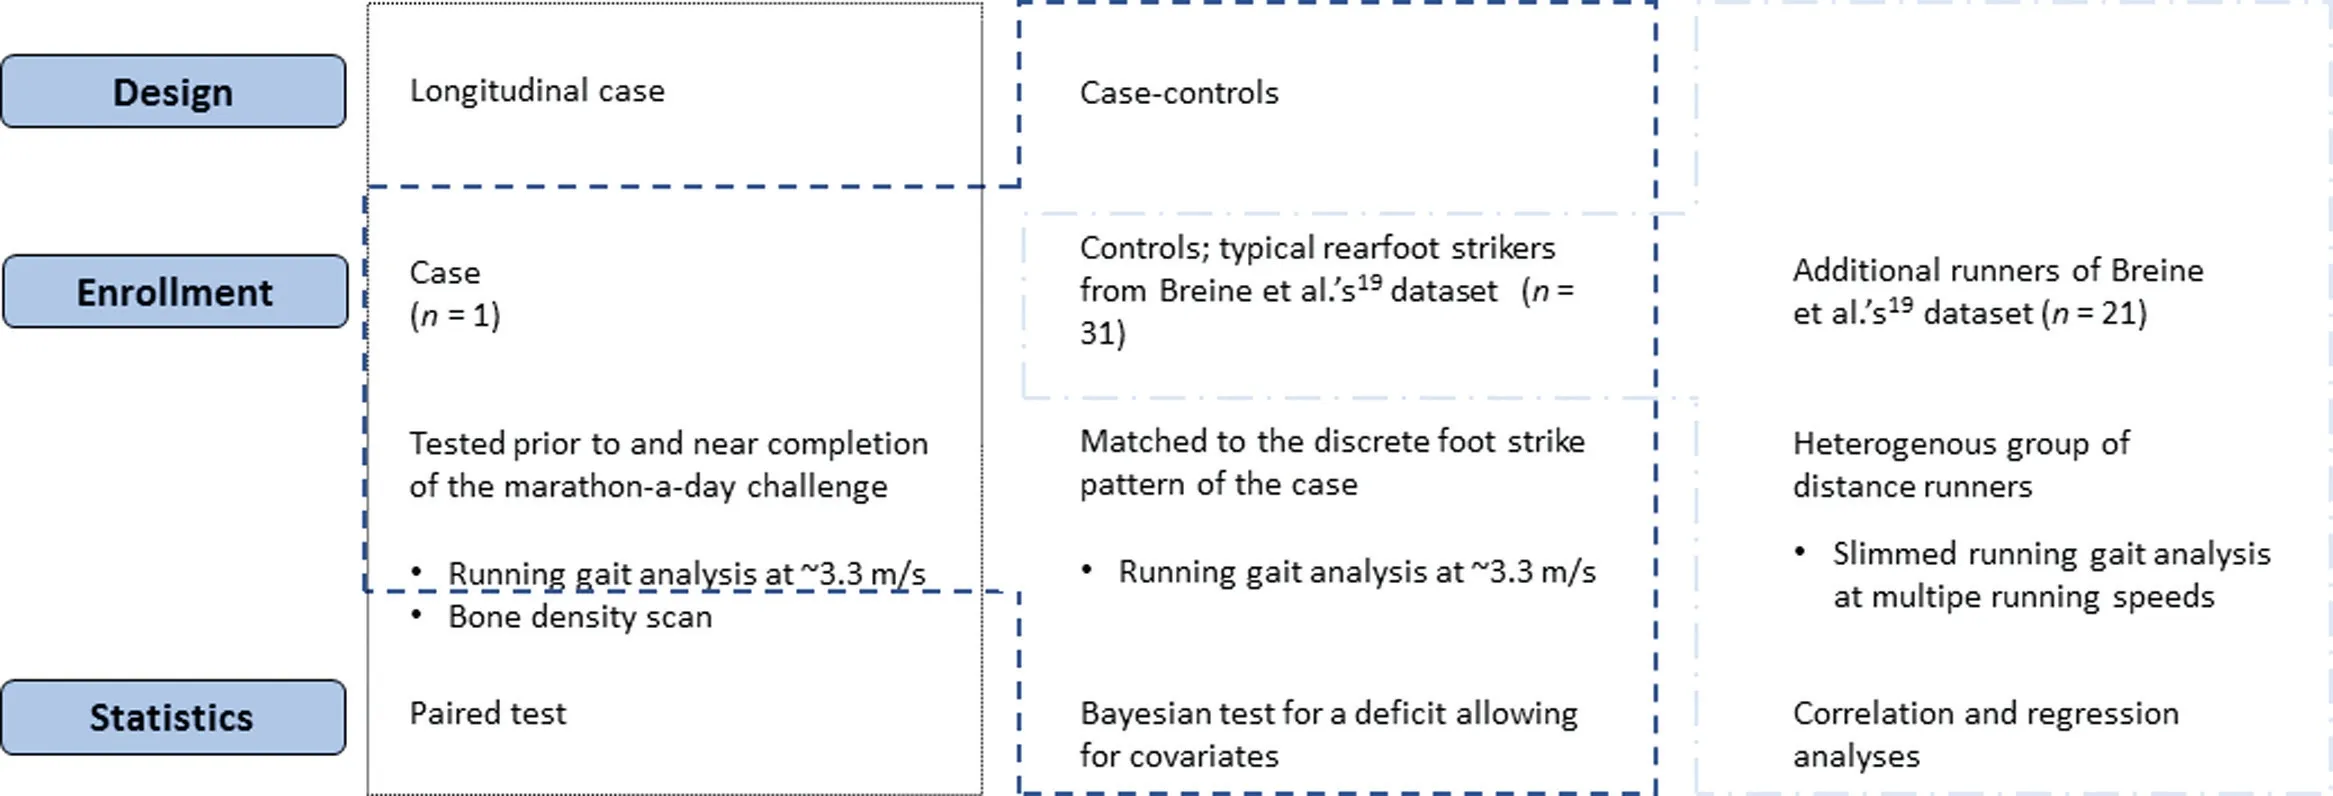
Fig.1.Diagram showing the flow of participants included for the comparative and regression analyses of distance runners.
2.2.Running course and support team
The marathons took place outdoors in a temperate, maritime climate.The temperature’s daily mean varied between approximately -5°C to 15°C between the start and finish dates.28The running route of “Watersportbaan” was followed daily (Supplementary Fig.1).The Watersportbaan is a man-made lake, with a loop around the water of approximately 5 km.The loop is one of the most popular spots for running in the region and has multiple roads to enter, leave or extend the loop.Hence, the marathon-a-day challenge attracted people who joined part of the runs,ranging from a handful of people to tens of recreational runners a day.The surface of the waterside path consisted of wooden chips,though the marathoner preferred the quasi-level concrete walkway next to the woodchip trail.The marathoner was guided by a multidisciplinary team that specialized in endurance sports.The marathoner wore a sports watch with GPS to track the distance of the daily marathon.Finish times were shown on a digital chronometer (Supplementary Fig.2).The marathoner planned to wear a new pair of cushioned athletic footwear(Asics)every 2 weeks,as he did for his previous marathon-a-day challenge.
2.3.Running gait analysis
We opted to study over-ground rather than treadmill running to exclude any potential artifacts.For instance,the foot strike angle is generally lower on a treadmill compared to an over-ground setting,29which could in turn affect the relationship between foot strike angle and the peak vertical loading rate.20The marathoner visited a sports laboratory before(pre:27.10.2016)and near the end(post:14.02.2017,day of the 95th marathon)of the challenge,which started on November 12, 2016 and finished on February 19, 2017.He repeatedly ran across a 32-m runway consisting of a 2-m embedded force platform(1000 Hz;AMTI Inc.,Watertown,MA, USA).Experiences and physical complaints were recorded by the lead investigator.A pressure plate(500 Hz;RsScan International NV,Paal,Belgium)was fixated on top of the force platform, permitting qualitative analysis of the foot strike pattern (Supplementary Fig.3, Movies 1 and 2).Three-dimensional gait data were simultaneously collected by 12 infrared cameras (Oqus 3+series, 250 Hz; Qualisys AB,G¨oteborg,Sweden).Reflective markers were applied to the lower extremity, pelvis, and trunk (Supplementary Fig.4).The force platform was positioned in the measurement volume using the CalTester (C-Motion Inc., Germantown, MD,USA).30A Noraxon DTS accelerometer(1000Hz;Norton Inc.,Scottsdale, AZ, USA) was attached to the distal anteromedial aspect of the right lower leg (Supplementary Fig.5A).Tibial acceleration was missing post-test due to a technical error.The marathoner wore his habitual neutral footwear (Asics).A picture of a worn pair of shoes (Gel Nimbus 19) taken post-test can be retrieved in the Supplementary Digital Content(Supplementary Fig.5B).A static trial of the participant’s anatomical posture was recorded before the self-selected warmup.The marathoner performed 4 dynamic running trials per session at 3.3 ± 0.2 m/s with ~90s standing rest between trials.This running speed approximated his preferred runningspeed for straight-line runs in the laboratory setting and has been a common choice in the running gait analysis of healthy runners.14,31
Ground reaction force, tibial acceleration, and labeled marker data were imported into Visual3D v6 (C-Motion Inc.,Germantown,MD,USA)(Supplementary Data 1).Qualitative assessment of the over/under filtering effect of different cutoff frequencies was performed to determine an appropriate cut-off frequency for the marathoner’s data.A zero-lag 4th order low-pass Butterworth filter was applied to the ground reaction force(60 Hz),tibial acceleration(60 Hz),and marker data(15 Hz).A matched cut-off frequency of 15 Hz was chosen to calculate joint kinetics for the pre-test.Initial contact and toe-off were determined at a threshold of 20 N to derive the spatio-temporal variables: contact time, flight time, step frequency, and duty factor.Duty factor was defined as a nondimensional variable (Duty factor=Axial peak tibial acceleration was equal to the maximum value of the corresponding acceleration signal during stance.32Three force-related variables were calculated for both the pre- and post-tests and were normalized to body weight(BW).5,6,8First,the peak vertical loading rate was calculated as the maximum value of the first derivative of the vertical ground reaction force (i.e., instantaneous vertical loading rate) in the first 0.050 s of stance (Fig.2).19Second, the peak vertical ground reaction force equaled the maximum value of the time series during stance.Third,the peak braking force was defined as the maximum posterior force observed from initial contact to 50%of stance.8These force characteristics of interest have been previously identified in longitudinal cohort studies as risk factors for severe injury in distance runners,6,8with higher values for the injured group of runners or for a medically diagnozed injured subgroup compared to long-term uninjured runners like the present case.
A 6-degrees-of-freedom model was created to calculate 3-dimensional segment poses for the lower extremities and pelvis(Supplementary Movie 3, C-Motion Output example).A 2-segment foot model was created.19Kinematics of the leg corresponding to the attached accelerometer were determined for the pretest.Segment angles were calculated relative to the global coordinate system.19Joint angles were calculated using an XYZ Cardan sequence(X:sagittal;Y:frontal;Z:transverse plane rotations)with the proximal segment as the reference segment.Lower extremity joint angles were spatially normalized to anatomical posture.19Supplementary Table 1 provides the neutral stance angles (e.g., knee valgus=9.5°) during upright standing.The rearfoot’s vertical touchdown velocity and the sagittal plane joint kinematics at initial contact were determined.19Inverse dynamic analytical methods have been employed to study the biomechanical function of lower limb muscle groups during locomotion.14,33In doing so, the ankle and knee extensor muscle effort can be evaluated during the stance phase of running gait.Net jointmoments and powers of these joints were calculated by inverse dynamics with Cardan sequence.Joint kinetics included the peak moment as well as positive and negative peak power.Eccentric knee joint work was calculated as the time integral of all negative data points of knee joint power during stance.14Knee joint stiffness was calculated as the ratio of the maximum change in the non-normalized internal knee extensor moment with the maximum change in knee flexion during the absorption phase(i.e.,the first half)of stance.32
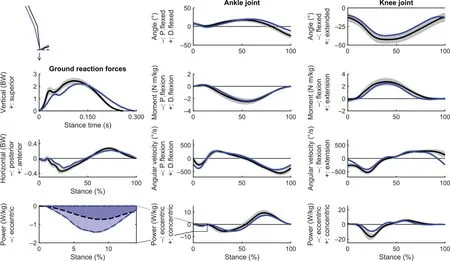
Fig.2.Stick figure of marathoner (blue) and control group of typical rearfoot strikers (black) at initial contact.Ensemble curves of the running ground reaction forces,and instantaneous joint angles,joint moments,and powers for the ankle and knee during stance.The grey area represents±1 SD bound around the mean of the control group.The vertical ground reaction force is scaled to the average foot-ground contact times to illustrate the difference in stance time between case and controls.The area under the curve in the left corner panel gives the eccentric work of muscles crossing the ankle joint during the initial plantarflexion movement.BW=body weight;D.=dorsi;P.=plantar;W=Watt.
We refer to our companion work19,27,34for the collection and processing of the normative group’s force and motion data.The dynamic trials were averaged per individual and per session.The running speed of the control group was 3.26 ±0.08 m/s.A critical checklist based on the recommendations of Derrick and colleagues35for the reporting of intersegmental moments was supplemented(Supplementary Table 2).
2.4.Bone densitometry
Dual-energy X-ray absorptiometry measurements (pre-test:24.10.2016;post-test:16.02.2017,day of the 97th marathon)were acquired per Hologic Discovery A using the standard whole-body protocol with consistent scan analysis at the local university hospital.A Discovery densitometer demonstrated satisfactory precision for body composition without statistically significant test-retest differences.36Following the International Society for Clinical Densitometry’s Position for males ≥50 years of age,37wholebody bone mineral density was interpreted by T-score.
2.5.Statistical analysis
Recommendations for the analysis and reporting of statistical results involving the comparison of a single case to a control group of modest sample size (n <50) were followed.38Normality of the data of the controls was checked since Crawford and colleagues39have stated that it is best to avoid markedly non-normal data if possible(Supplementary Table 3).Violin plots of the variables of interest were supplemented in order to better understand the data distribution(Supplementary Fig.6).The marathoner’s mean score of 4 right footfalls at baseline (pre-test) was compared against a normative sample of modest size (n=31) by the Bayesian Test for a Deficit allowing for Covariates method.39The method tests for a difference between the case and a population of controls, has been applied in other research domains,40,41and is preferred to the one-sample t test because the effect of using a one-sample t test is a high Type I error rate.42The method provides information on the abnormality of the case’s score for the ground reaction force, spatio-temporal, touchdown kinematic, joint kinetic, and joint stiffness variables.The running speed was set as a covariate because it can influence the loading-related variables of interest.1,15,43,44One-tailed tests were performed in case of a directional hypothesis because Crawford and colleagues42have recommended the use of a one-tailed test when testing in a particular direction(p).An abnormally low or high score was defined as remarkable if the point estimate of the abnormality of the case’s score was respectively less than 5%or more than 95% of the control population.Crawford and colleagues38have emphasized the importance of reporting point and interval for effect sizes in single-case studies.Point and interval estimates of effect size for the difference between a case’s score and controls were added accordingly.38,39The effect size was denoted as zCCCwherein the CCC subscript identifies that the effect size allows for a covariate and is for use in a case-controls design; the D subscript denotes that an index is concerned with a (standardized) difference between scores.39Two-tailed Wilcoxon signed-rank tests(exact significant two-tailed) were used to compare the force-related variables of 5 footfalls (4 right and 1 left) between the pre- and post-test (JASP 0.13.1; JASP Team, Amsterdam, the Netherlands).A correction factor was not applied to account for the number of statistical tests conducted.The significance level was set at the conventional 0.05 level.
Although not a primary goal of the present study,nonlinear and linear relationships were explored to help explain some of the results.First, we constructed a regression model expressing the peak vertical loading rate as a quadratic function of the foot angle at initial contact for each of the speed conditions available in a data set from our previous research.43This second-degree polynomial included the foot strike angle as a continuous, independent predictor of the peak vertical loading rate(JASP R-module;JASP Team).The choice of the curve fitting method was based on the work of Chambon and colleagues,20who have observed a nonlinear relationship between the foot strike angle and the peak vertical loading rate when manipulating footwear in over-ground running.This additional analysis was done for a heterogeneous group of 52 distance runners wearing cushioned neutral footwear.The group included the previously mentioned typical rearfoot strikers as well as additional runners who habitually performed other foot strike patterns in order to cover a wide range of foot strike angles(range at the speed of ~3.2 m/s:-1.1°to 29.8°).The Pearson correlation coefficient (r) was computed for the foot and shank angles at touchdown to obtain a measure of linear dependence between these variables in the control group of 31 typical rearfoot strikers at the lowest speed condition.Furthermore, correlation coefficients were computed between duty factor and peak vertical ground reaction force, peak vertical loading rate, peak braking force.The coefficients were interpreted according to the modified Hopkin’s scale with r ≥0.30 moderate,r ≥0.50 large,r ≥0.70 very large,r ≥0.90 nearly perfect,and=1 perfect.45
3.Results
3.1.Running gait mechanics at baseline
The case-controls performance is summarized in Table 1.The case had no statistically significant difference in step frequency compared to the control group.The marathoner had a statistically significantly lower peak vertical loading rate(Δx̄=-61.9 BW/s or -57%), peak vertical ground reaction force (Δx̄=-0.38 BW or -15%), peak braking force(Δx̄=-0.118 BW or-31%),and vertical touchdown velocity of the rearfoot (Δx̄=-0.35 m/s or -29%) than the controls.The contact time was longer (Δx̄=+0.044 s or +18%), the flight time was shorter (Δx̄=-0.047 s or -40%), and therefore the duty factor was greater (Δx̄=+0.07 or +21%) in themarathoner.Further, the rearfoot strike angle was more pronounced in the marathoner (Δx̄=+8.8° or +42%) than in the controls.The marathoner’s foot strike angle was situated at the positive end of the foot strike angle continuum(Fig.3).Axial peak tibial acceleration was 4.7 ± 0.6 g pre-challenge.Contrary to our directional expectations, the scores for shank angle at touchdown and absolute knee stiffness of the marathoner were estimated to occur in the highest 5% range of the control population.Fig.2 shows the running ground reaction forces, the instantaneous joint moments, velocities, and powers.The scores for the marathoner’s peak joint moments were estimated to occur in more than 5% of the typical rearfoot strikers(Table 1),implying the extensor muscle effort in mid-stance was not remarkably low in the case.The peak power values of the ankle were rather low (effect sizes >0.8) in the case vs.the controls,with the ankle generating remarkably less peak power in the push-off phase (Δx̄=-3.17 Watt (W)/kg or-30%).The joint power curves at the knee were negative during the first half of the stance phase and indicated the extensor moment worked eccentrically to reduce knee flexion velocity,especially in the controls(Fig.2).The marathoner had remarkably low values in peak power absorption(Δx̄=-9.16 W/kg or-48%)and eccentric work(Δx̄=-0.335 Joule(J)/kg or-46%)of the knee.
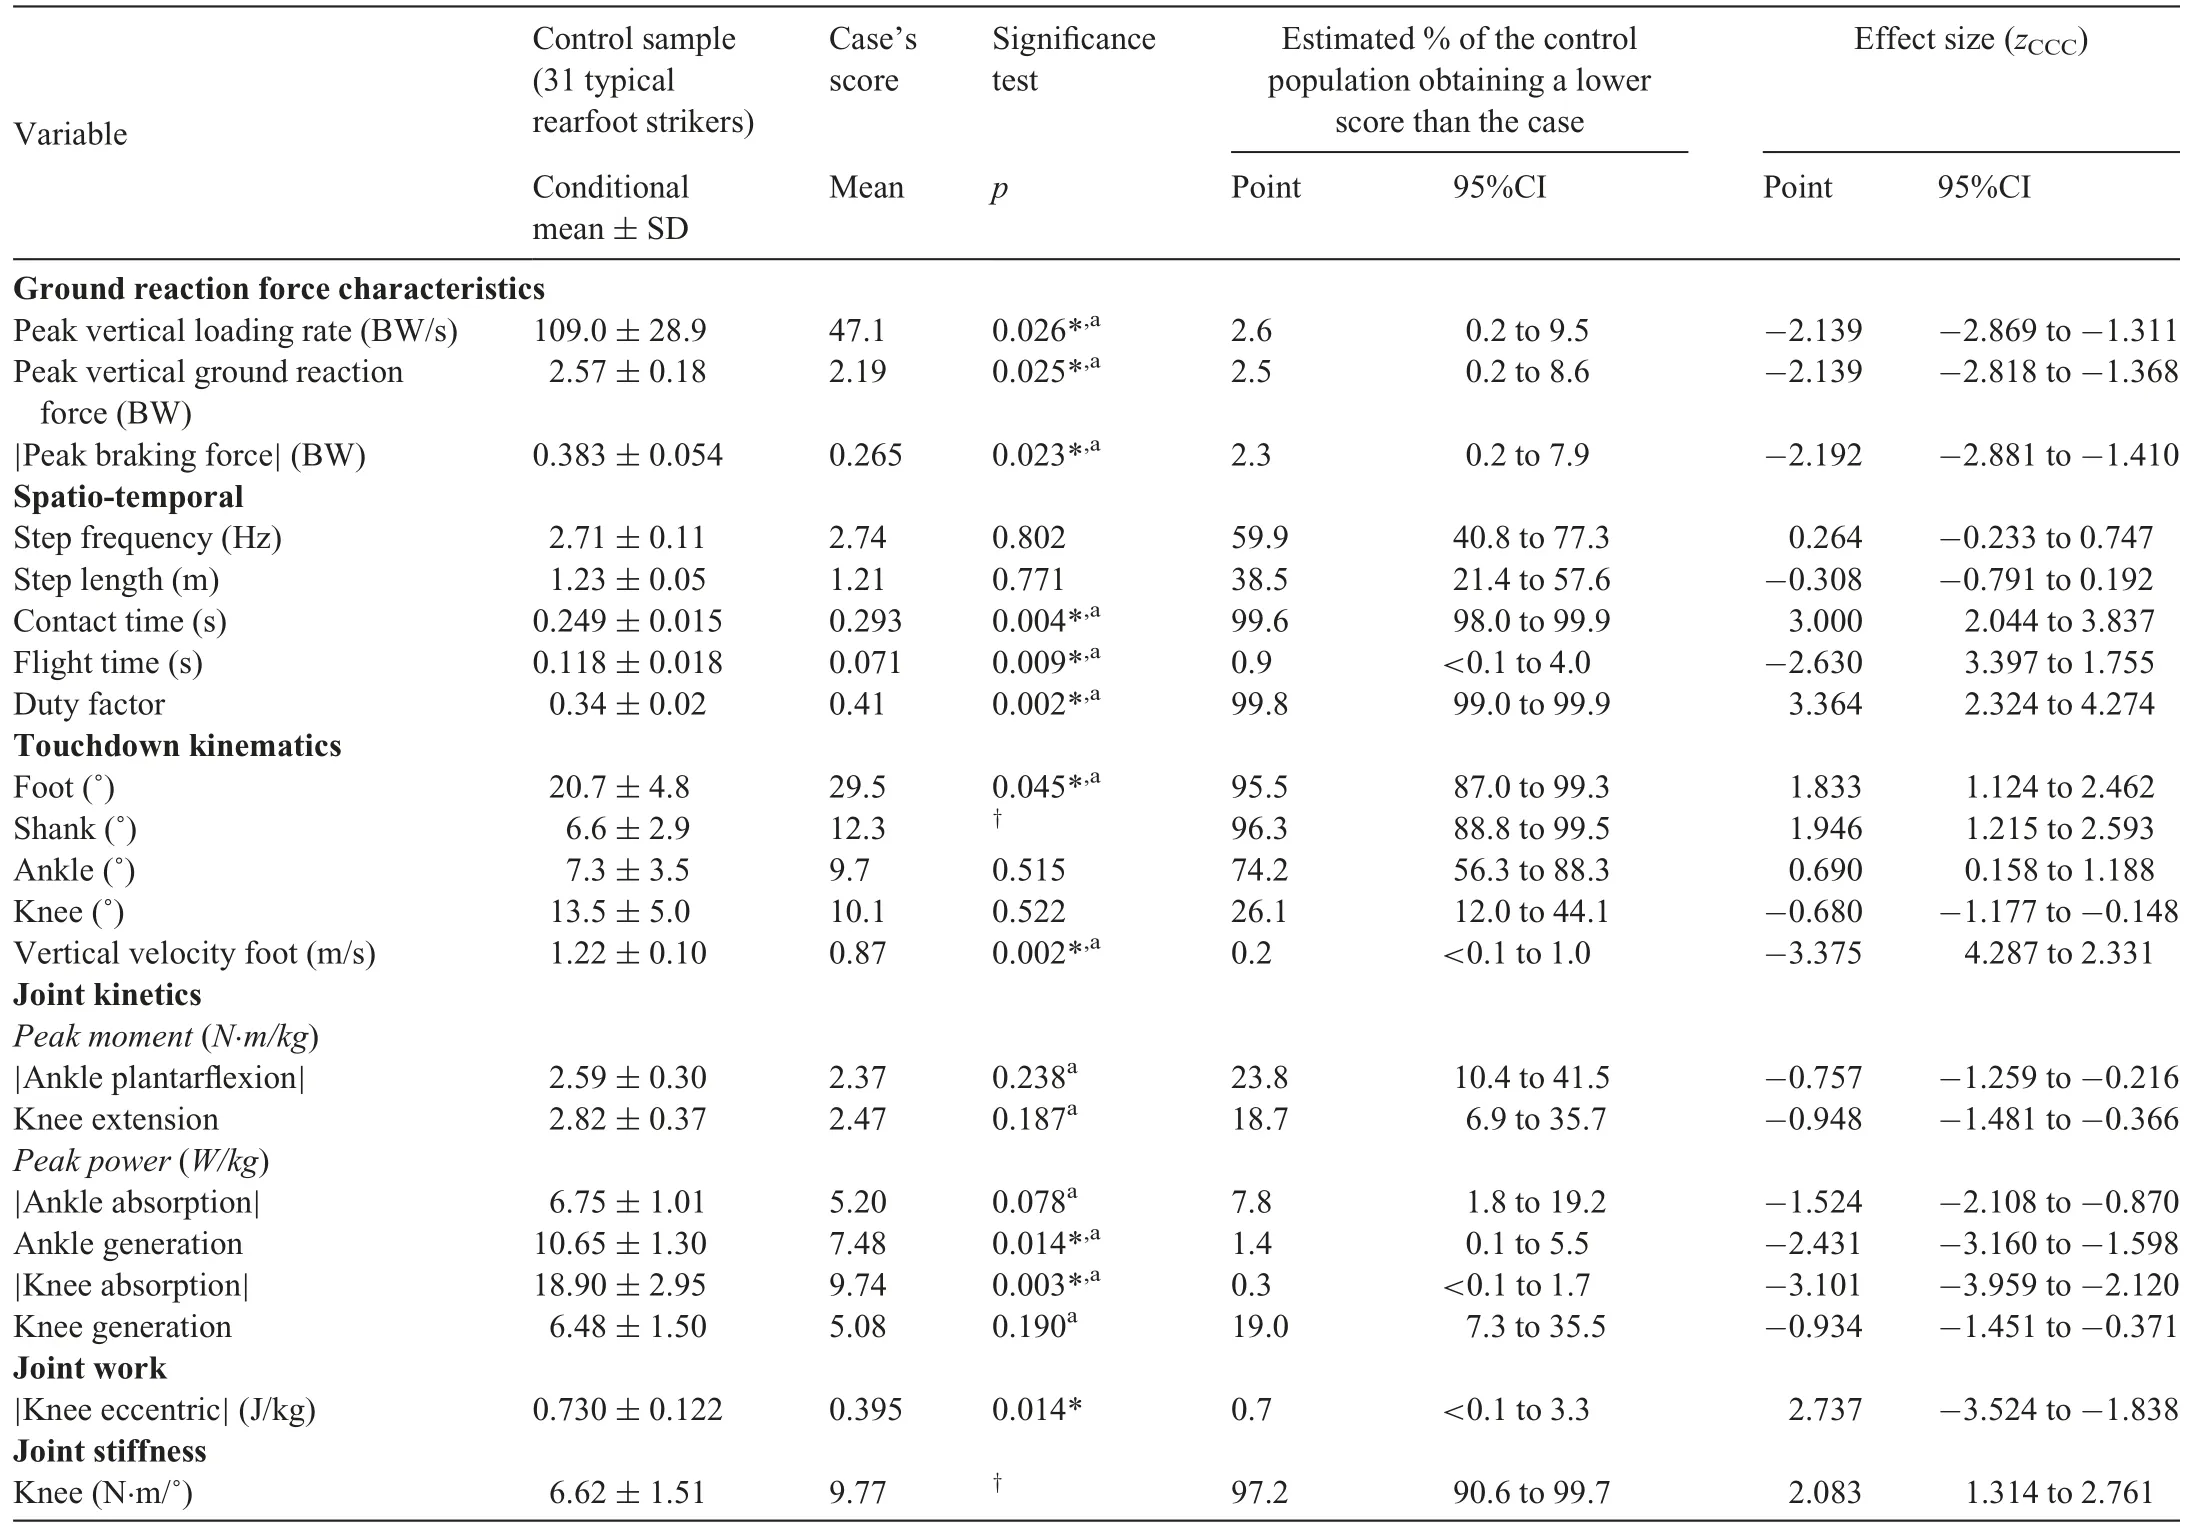
Table 1The case-controls comparison of running ground reaction forces,spatio-temporal variables,touchdown kinematics,and joint kinetics in stance.
3.2.The influence of the initial foot contact and duty factor
The quadratic polynomial model was able to explain peak vertical loading rate with an adjusted R2ranging between 0.207 and 0.431(p ≤0.001)over multiple running speeds tested in a population of distance runners.The model’s goodness of fit at each speed condition was supplemented(Supplementary Table 4).A more pronounced rearfoot strike and a more pronounced forefoot strike were related to lower peak vertical loading rate (Fig.3).In the control group at the speed of 3.2±0.2 m/s,the sagittal-plane foot angle at touchdown demonstrated a very large positive correlation(r=0.794,p <0.001)with the shank angle at touchdown.Duty factor was negatively correlated with the force-related variables(Fig.4).The values of the marathoner were added to Figs.3 and 4 to illustrate that his values coincide with relatively low dynamic loading.
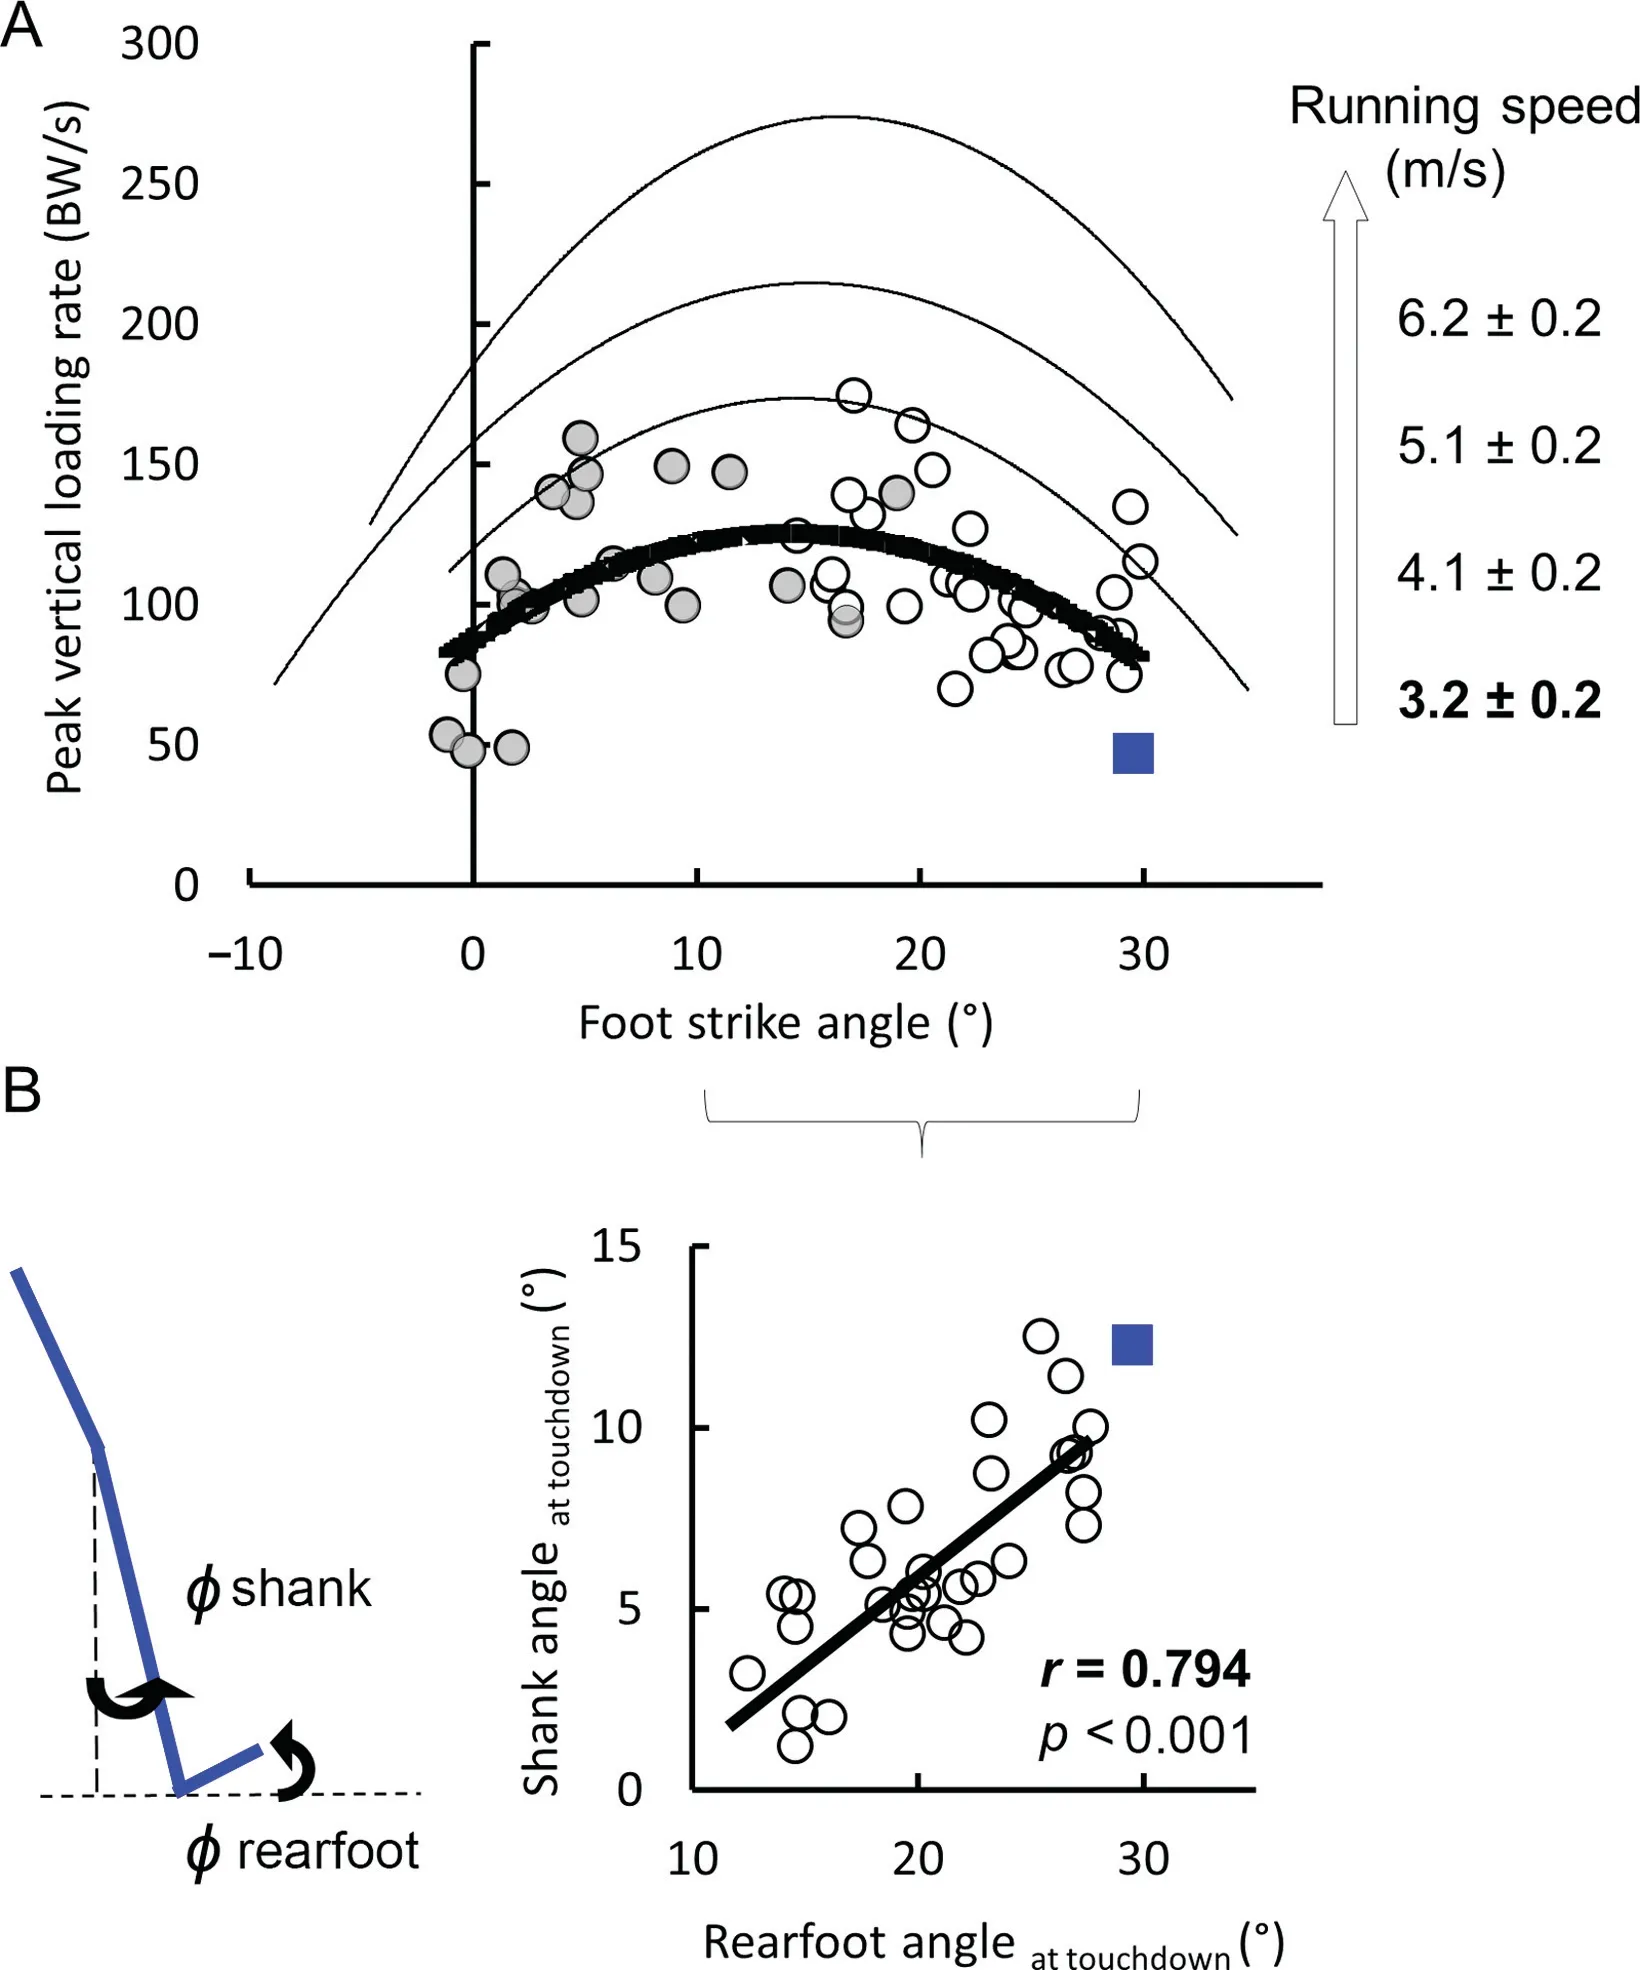
Fig.3.(A)The non-linear relationship between foot strike angle and peak vertical loading rate during over-ground and level running at multiple running speeds.The dots represent the 52 runners previously included in the study by Breine and colleagues,19 with the open dots showing the typical rearfoot strikers.(B)The relationship between the rearfoot and shank angles at touchdown for the controls at ~3.3 m/s.The marathoner’s data point(square)was added in blue for illustrative purposes.BW=body weight.
3.3.The marathon-a-day challenge
The marathoner ran 1 marathon a day for 100 consecutive days.The daily laps were completed at an average speed of about 2.64 m/s46and the self-reported average finish time was 4 h 30 min (Supplementary Fig.2).The running speed of the post-test was 3.35±0.12 m/s,and the force characteristics of the marathoner did not change significantly over time(Table 2).Bone mineral density increased from 1.209 g/cm2to 1.245 g/cm2(+2.98%) and the T-score increased from 0.3 to 0.7 (p <0.05).Supplementary Table 5 provides areal bone mineral content, body fat, lean mass, and total mass.The marathoner’s proportion of body fat to body mass was 20.8%before the multi-marathon challenge and 13.6% near its completion.His body mass and fat mass were respectively 92.0 kg and 19.1 kg before the challenge.His body mass and fat mass near completion of the challenge were 85.1 kg (Δx̄=-6.9 kg or -7.5%) and 11.6 kg (Δx̄=-7.5 kg or -39.3%), respectively.Lean mass and the bone mineral content were 69.8 kg(Δx̄=+0.6 kg or +0.8%) and 3.07 kg (Δx̄=+0.02 kg or+0.55%),respectively, in the second measurement.The marathoner stated that he had occasionally performed intervals to prevent boredom and that he often listened to music during the runs.He declared a good health status in the final week of the challenge but noted a bilateral soreness in the Achilles tendon as well as some starting stiffness in his lower extremity joints lasting less than 30 min.Seven pairs of athletic shoes were worn sequentially from start to completion of the multi-marathon challenge.

Table 2The within-subject comparison of force characteristics over time.
4.Discussion
4.1.Ground reaction forces and lower limb joint mechanics
The extraordinary marathoner had lower running ground reaction forces(BW)when compared with a group of distance runners matched by similar foot strike pattern during level,over-ground running.The case had a remarkably high duty factor at ~3.3 m/s because without a significant difference in step frequency,he had a shorter flight time and longer contact time than the controls.These spatio-temporal characteristics affect the peak vertical ground reaction force because gait mechanics and running ground reaction forces are linked.15,18The greater duty factor was a major discriminating characteristic of the“marathon man”-signature as it helped to explain,in part,the dynamic-loading related variables in over-ground running with a typical rearfoot strike pattern.Our lab data indicated a very large positive correlation between the peak vertical ground reaction force and duty factor in the control group (Fig.4), thus supporting the force-duty factor relation modeled by Blum and colleagues17at a dimensionless speed.Further, the duty factor correlated moderately-to-largely with peak braking force and peak vertical loading rate, indicating that a greater duty factor in rearfoot strikers was related to a lower magnitude in these force-related variables.Given that both axial peak tibial acceleration and peak vertical loading rate have been used to explain(R2:0.88-0.99)the peak braking force during over-ground running,47the remarkably low peak braking force in the marathoner is a logical result.Namely, on the one hand, the marathoner’s axial peak tibialacceleration was situated in the lowest quartile of a group of rearfoot strikers running at an alike speed and in the same measurement environment as in the present study.44On the other hand, the marathoner’s peak vertical loading rate fell outside the observed range of values in the control group and was below a given threshold for high-impact running(loading rate ≥85 BW/s) when evaluated on a treadmill at the same running speed as the present study.14The modeling study of Gerritsen and colleagues16showed an isolated reduction in peak vertical loading rate when lowering the vertical touchdown velocity of the heel,increasing the foot strike angle,or decreasing the posterior inclination of the shank at touchdown.The vertical touchdown velocity of the rearfoot was statistically significantly lower in the case vs.the controls (Δx̄=-0.35 m/s), supporting the findings of Gerritsen and colleagues.16The marathoner’s foot strike angle of 29.5°was remarkably high, even exceeding the range in foot strike angles(7.6°to 12.1°)modeled by Gerritsen and colleagues.16The marathoner’s foot strike angle was situated at the upper positive end of our observations at the tested speed,thereby supporting the existence of a non-linear relationship between foot strike angle and peak vertical loading rate in level over-ground running.The very positive rearfoot strike angle also permits a full unroll of the foot-shoe system on the contact surface(Supplementary Movie 1).The remarkably oblique shank angle at touchdown in the marathoner (12.3°) may, at first sight, seem unexpected for a lowimpact rearfoot striker.Gerritsen and colleagues16found marginal increases in the peak vertical loading rate when changing the shank angle at touchdown from 4.6° to 1.7° in a simulation wherein each parameter was changed in isolation.However, our observational lab data of rearfoot strikers showed the foot angle is coupled with the shank angle at touchdown in vivo(Fig.3).Given that peak vertical loading rate was more strongly influenced by an isolated change in foot angle than shank angle at touchdown,16we would be more likely to find a very pronounced foot strike angle in a low-impact rearfoot striker.The rapid lengthening of the ankle dorsiflexor muscles during the initial plantarflexion movement could be greater in this body configuration,making more energy absorption possible,causing the impact force to be lower.16
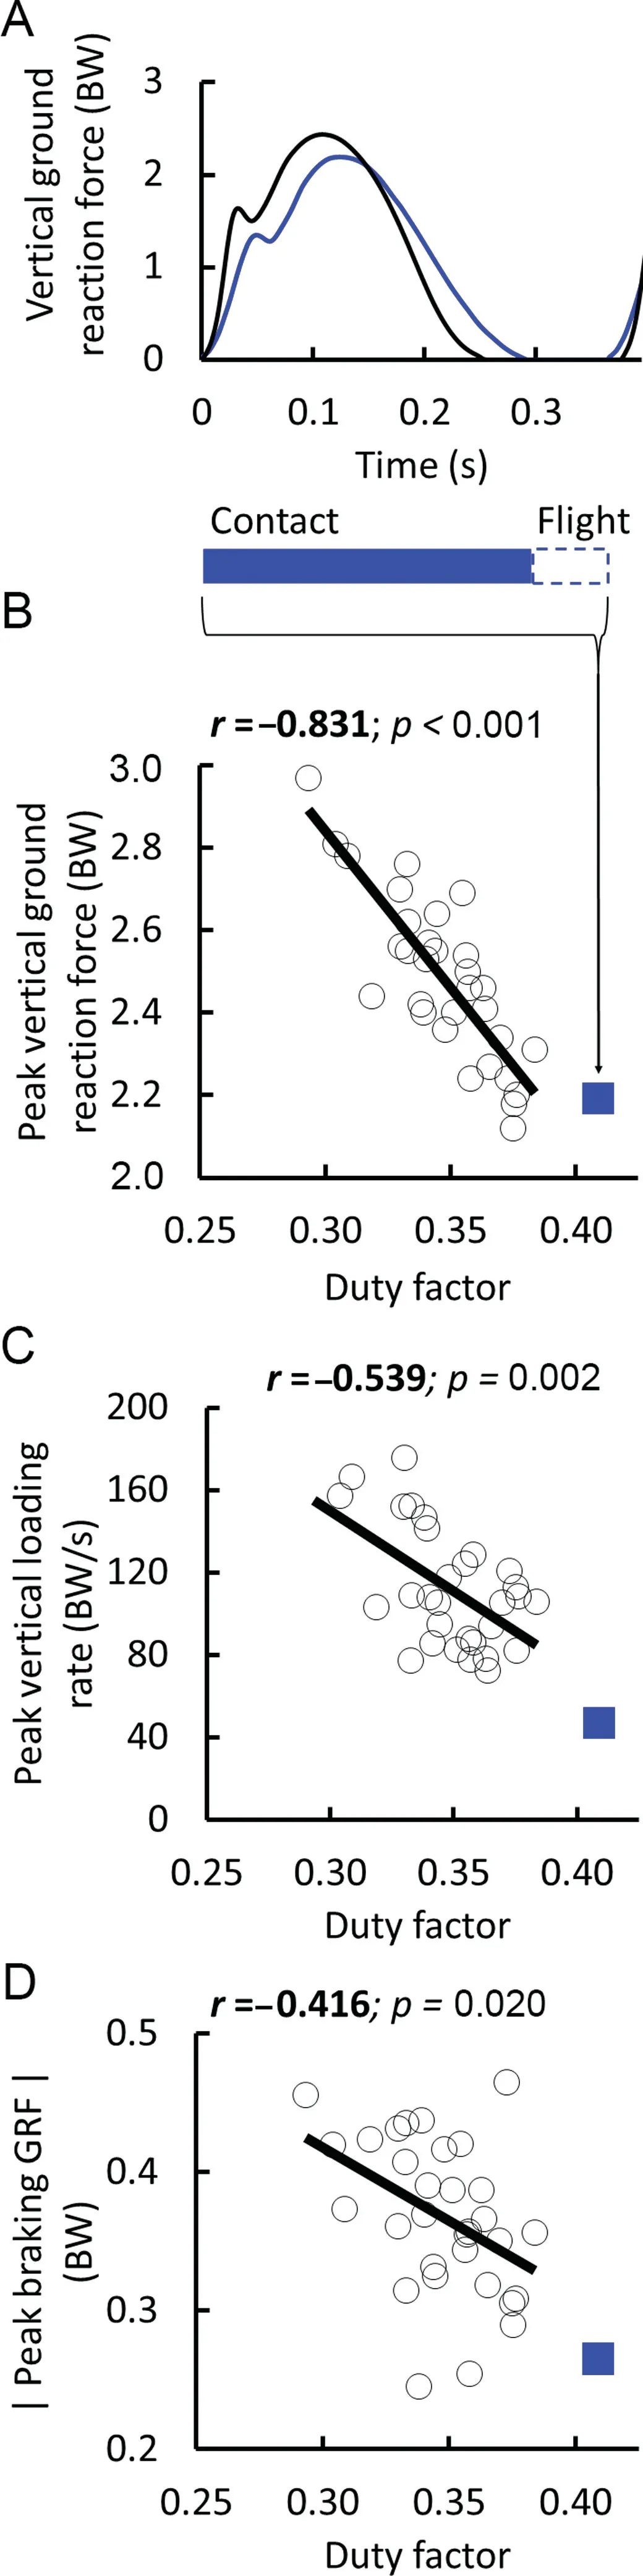
Fig.4.Relationship between duty factor and force-related characteristics(B),(C),(D)in the control group.The marathoner’s data point(square)was added in blue for illustrative purposes.Duty factor=contact time/(2(contact time+flight time));r=Pearson correlation coefficient.BW=body weight;GRF=ground reaction force.‖denotes absolute values of negative numbers.
The applied load is transferred to the tissue locally through forces and moments.10The marathoner’s remarkably low vertical ground reaction force did not result in remarkably low peak moments in the ankle and knee joints.Though not statistically significant,the peak joint moments of the case were estimated to be situated in the lowest quartile of the control population and may be clinically relevant.The remarkably low power absorption in the knee is due to the interplay between the net knee extension moment and the joint angular velocity (Fig.2).The percentage difference in peak eccentric power absorption of the knee between the marathoner and the controls resembled that found by Stearne and colleagues12between habitual rearfoot strikes and imposed forefoot strikes.Interestingly, the muscles crossing the knee joint were absorbing remarkably less mechanical energy in the successful high-mileage runner during stance.Willy and colleagues14have postulated that less eccentric joint work at the knee may be beneficial in runners who are recovering from injuries to the quadriceps mechanism and in runners with patellofemoral and tibiofemoral joint osteoarthritis.
Several measures of peak load per stride were lower in the case compared with the controls.These results, therefore, are in agreement with the mechanobiological viewpoint of Edwards,10who concluded that a 10%reduction in stress is associated with a corresponding 100% increase, or more, in the number of cycles to failure of biological tissues.Consequently,the remarkably low loading magnitudes observed are considered beneficial for the successful completion of long-distance runs in a quasi-level running environment.The running cadence did not differ significantly between the case and controls at the controlled speed.Hence,the peak values per step indirectly reflect those per unit of distance(e.g.,per km),and the weighted cumulative loads depend on the magnitude of the loading-related variable of interest.6,10
4.2.Effects of the extreme endurance challenge
The master athlete successfully completed 42.195 km a day for 100 consecutive days.The absence of a noteworthy injury indicates an attainable balance between mechanical loading,the ability to tolerate repetitive loading, and periods of rest.The marathoner must have had less total damage in tissue than some critical damage.10Usually, 1 running-related injury develops per 1000 km of running,48implying that the marathoner should have developed a multitude of running injuries during his challenge.However, the marathoner’s record of achievements with respect to long-distance running points to a very high load-bearing tolerance.The force variables did not change significantly, indicating a loading pattern that has become motorically grinded after years of high-volume training.We also speculate that the knee stiffness of the marathoner decreased during the challenge because of the weight loss resulting from the multi-marathon challenge.The marathoner expected to see an overall energy deficit during the challenge and deliberately began the challenge at a body mass similar to that at the start of his previous marathon-a-day challenge.
The whole-body bone mineral density of the 55-year-old marathoner resembled that of the average 30-year-old white male.Strikingly,the bone mineral density was shown to have increased slightly by the post-test.Although the bone mineral density could be running-volume dependent in senior male runners,49these results suggest that high-mileage running at a predominantly aerobic intensity may ameliorate the loss of bone density associated with aging.This adaptive response may be a natural defense mechanism to improve fatigue resistance at the stress level associated with periodic running activity.50
4.3.Why the marathoner’s running speed might have been beneficial for the high-mileage challenge
The marathoner performed the intermittent running bouts at~3.3 m/s indoors and adjusted his running pace to complete the daily marathons at ~2.6 m/s outdoors.A reduction in the speed of running requires more steps to finish,but a lower running pace restricts the mechanical load per step and does not increase the cumulative damage10—at least in the Achilles tendon and in bone.51,52Besides,a reduction in running speed does not change the cost of transport but does permit runners to cover ground at a lower percentage of their maximal energetic capacity.The selfreported average finish time is situated in the middle of the modal finishing times in large marathons open to all runners53and is close to the average finish time extracted from 8 years of racerunning data from male Runkeeper-users around the world.54A comfortable pace relying on the aerobic energy transfer system in combination with fueling strategies during the challenge aided the marathoner in enduring the daily distance.The relative usage of metabolic substrate fat or carbohydrates depends on the relative exercise intensity.Fat would be used more as fuel substrate to avoid a phenomenon known as “hitting the wall”,53a claim that is supported by the marathoner’s substantial decrease in fat mass(-39%)during the marathon-a-day challenge.
4.4.Limitations
The unique case was compared to a geographically similar group of runners matched by foot strike pattern.The mixed-gender reference group was generally younger, with age and gender potentially confounding joint kinetics during locomotion.33,55,56Slightly different data handling techniques and running speeds between the case and the matched controls may have masked subtle differences in numerical results but are unlikely to change the qualitative conclusions of this study.The distinguishable movement characteristics were determined at a single speed, but the non-linear relationship between foot strike angle and peak vertical loading rate was present over a wide range of speeds (Fig.3).Consequently,we expect the mechanism for relatively low-impact loading to hold at submaximal running speeds.We reported only in the sagittal plane because differences in running mileage might influence the coordination of lower extremity segment kinematics in the other planes.57A more complete analysis would consider the hip and the upper body as well.Similar to another case wherein a long-distance runner has scheduled a strenuous multi-day running challenge,1the gait data were not recorded exactly pre-and post-challenge due to practical considerations.
4.5.Future research
If a low peak vertical loading rate is targeted in a level overground running environment,our data suggests a pronounced and softly landed rearfoot strike could be a potential motor strategy for running with relatively low vertical impact severity.So, next to a clear forefoot strike,pronounced rearfoot striking also permits a relatively low peak vertical loading rate,19-21,58even at multiple running speeds.Future research may explore the positive upper end of the continuum of the foot strike angle in a within-subject design,i.e.,as a target for gait retraining,to study its relation with impact characteristics.Studies that target impact reduction during over-ground running at a comfortable speed,perhaps using feedback pertaining to peak vertical loading rate or a correlated measure,59,60should assess whether runners apply a distal strategy(i.e.,pronounced rearfoot striking),and whether or not it is combined with a global strategy such as an increased duty factor.
5.Conclusion
We presented a distinct biomechanical signature of an extraordinary high-mileage runner, who successfully ran 100marathons in equal days while bearing relatively low running ground reaction forces.Although the relationship between external force and overuse injuries is inconclusive,5-7,32we argued that the marathoner’s extraordinary long-term running performance has benefited from his current running style with relatively low loading and a high load-bearing tolerance.The information related to the running pattern of this successful high-mileage case may be important in developing motor strategies for shifting or reducing structure-specific loads in distance running and in improving our understanding of long-term,uninjured,master runners.
Data accessibility
The supplementary movies,datasets supporting the conclusions of this article, and statistical output are available in an Open Science Framework repository,https://osf.io/r9xfq/.
Acknowledgments
This study was funded by the Research Foundation-Flanders(FWO.3F0.2015.0048.01) and the International Society of Biomechanics’ student grant program (Matching Dissertation Grant 2019).This study would not have been possible without the marathon man’s spontaneous collaboration.The marathoner cooperated to organize the research and provided us with additional documentation.The authors gratefully acknowledge Joeri Gerlo and Rud Derie for their assistance in data collection.The first author is grateful to Allison Gruber of Indiana University Bloomington for helpful discussion and bringing references(6,7,and 34) to the attention of the author.This research has benefitted from a statistical consult with the Fostering Innovative Research based on Evidence(FIRE)unit of Ghent University.
Authors’contributions
PVdB,EH,and BB collected the data;EH and BB performed the data-analysis;PVdB performed the statistical analysis,designed the figures, created the public repository, and drafted the manuscript;DDC interpreted the findings and supervised all aspects of the study.All authors aided in the revision of the manuscript.All authors have read and approved the final version of the manuscript,and agree with the order of presentation of the authors.
Competing interests
The authors declare that they have no competing interests.
Supplementary materials
Supplementary materials associated with this article can be found in the online version at doi:10.1016/j.jshs.2021.03.009.
 Journal of Sport and Health Science2022年3期
- Journal of Sport and Health Science的其它文章
- The secrets to running economy
- Metabolic and performance responses of male runners wearing 3 types of footwear:Nike Vaporfly 4%,Saucony Endorphin racing flats,and their own shoes
- Longitudinal bending stiffness does not affect running economy in Nike Vaporfly Shoes
- Can changes in midsole bending stiffness of shoes affect the onset of joint work redistribution during a prolonged run?
- Metabolic cost of level,uphill,and downhill running in highly cushioned shoes with carbon-fiber plates
- Systematic reduction of leg muscle activity throughout a standard assessment of running footwear