
Metabolic and performance responses of male runners wearing 3 types of footwear:Nike Vaporfly 4%,Saucony Endorphin racing flats,and their own shoes
2022-06-09 09:23KimebertLosierStevenFinlysonMtthewDrillerbBliseDuboisJenFrnoisEsulierChristopherMrtynBeven
Kim H´ebert-Losier*,Steven J.FinlysonMtthew W.Drillerb,Blise Dubois,Jen-Frn¸ois Esulier,Christopher Mrtyn Beven
a Division of Health,Engineering,Computing and Science,Te Huataki Waiora School of Health,University of Waikato,Mount Maunganui,Tauranga 3116,New Zealand
b Sport and Exercise Science,School of Allied Health,Human Services and Sport,La Trobe University,Melbourne,VIC 3086,Australia
c Research&Development,the Running Clinic,Lac-Beauport,QC G3B 2J8,Canada
Abstract Purpose:We compared running economy(RE)and 3-km time-trial(TT)variables of runners wearing Nike Vaporfly 4%(VP4),Saucony Endorphin lightweight racing flats(FLAT),and their habitual running(OWN)footwear. Methods: Eighteen male recreational runners (age = 33.5 ± 11.9 year (mean ± SD), peak oxygen uptake (VO2peak) = 55.8 ± 4.4 mL/kg·min)attended 4 sessions approximately 7 days apart.The first session consisted of a VO2peak test to inform subsequent RE speeds set at 60%, 70%,and 80%of the speed eliciting VO2peak.In subsequent sessions,treadmill RE and 3-km TTs were assessed in the 3 footwear conditions in a randomized,counterbalanced crossover design. Results:Oxygen consumption(mL/kg·min)was less in VP4(from 4.3%to 4.4%,p ≤0.002)and FLAT(from 2.7%to 3.4%,p ≤0.092)vs.OWN across intensities, with a non-significant difference between VP4 and FLAT (1.0%-1.7%, p ≥0.292).Findings related to energy cost (W/kg)and energetics cost of transport (J/kg·m) were comparable.VP4 3-km TT performance (11:07.6 ± 0:56.6 mm:ss) was enhanced vs.OWN by 16.6 s (2.4%, p=0.005) and vs.FLAT by 13.0 s (1.8%, p=0.032).The 3-km times between OWN and FLAT (0.5%, p=0.747) were similar.Most runners(n=11,61%)ran their fastest TT in VP4. Conclusion:Overall,VP4 improved laboratory-based RE measures in male recreational runners at relative speeds compared to OWN,but the RE improvements in VP4 were not significant vs.FLAT.More runners exhibited better treadmill TT performances in VP4(61%)vs.FLAT(22%)and OWN(17%).The variability in RE(-10.3%to 13.3%)and TT(-4.7%to 9.3%)improvements suggests that responses to different types of shoes are individualized and warrant further investigation.
Keywords: Footwear;Individual responses;Minimalist;Physiology;Running
1.Introduction
Running economy (RE) is defined as the rate of oxygen consumption at a given submaximal running speed and is a key measure linked with distance-running performance.1Although peak oxygen uptake (VO2peak) and VO2peakfractional utilization are also key factors in distance-running performance,2runners with a similar VO2peakand lactate threshold, but superior RE, generally outperform their peers.2Given the direct link between RE and performance,3,4acute change in RE via footwear interventions has become an active area of research.5-7
Until recently, shoe mass was one of few footwear characteristics consistently linked with improvements in RE and performance.3,8,9The energetic cost of running has been shown to increase from approximately 0.7%-1.1% for each 100 g of added mass per shoe,3,8which explains why most elite runners race in lightweight racing flats.However, the 2017 Breaking2 event introduced Nike Vaporfly Elite shoes,which were lighter than comparable marathon racing shoes;had a thick foam midsole constructed from Pebax (Nike ZoomX, Nike Inc., Beaverton, OR, USA), with considerable energy return characteristics, and had an embedded carbon fiber plate that increased longitudinal bending stiffness.5-7Eliud Kipchoge subsequently ran a 2:01:39 world record in the 2018 Berlin Marathon wearing Nike Vaporfly Next%and was successful in running the marathon distance in under 2 h during the INEOS 1:59 Challenge in 2019, when he wore unreleased Nike Alphafly prototype shoes.Although there are several factors involved in racing performance to consider,these achievements sparked debate in the running community regarding whether the use of novel technologically advanced running shoes constitutes“technology doping”.10
Research papers have reported RE improvements under laboratory conditions in high-caliber runners (sub-32:00 men and 35:30 women for 10 km) wearing Nike Vaporfly 4% (VP4)shoes,5-7which are mechanistically driven by the elastic properties and energy return from midsole compression.11Mobile application (Strava) data released by The New York Times corroborate laboratory work,indicating that runners wearing VP4 or Next% shoes run 4%-5% faster in marathons and half-marathons and have a 73%-75% chance of setting a personal best compared to wearing their habitual running footwear.12While it is debatable whether such a comparison is fair given that most recreational runners wear heavier shoes, the analysis feeds into the fairness debate of the Vaporfly10effects at both the elite and recreational level.In addition, Hunter et al.5noted that “a placebo effect cannot be ruled out”.Since previous studies on the VP4 did not attempt to blind participants to footwear,it is unsure whether any placebo effect contributed to the reported VP4 benefits.3,5,12
It has also been suggested that recreational runners wearing VP4 shoes might reap greater percentage benefits than elite runners wearing these shoes, since modelling predicts greater percentage improvements at running velocities slower than approximately 3 m/s,4although laboratory-based data from recreational runners are not available.Previous research has also demonstrated that changes in laboratory-based RE variables translate to similar changes in distance-running performances as assessed using a 3-km time trial.3
Our aims were to compare RE variables at speeds relative to VO2peakand 3-km time-trial(TT)performances of male recreational runners wearing commercially available VP4,Saucony Endorphin Racer 2 lightweight racing flats (FLAT), and their own habitual running shoes (OWN).We hypothesized that wearing VP4 would result in improved RE and performance variables overall.
2.Materials and methods
2.1.Participants
Sample size calculations based on RE7and TT13data indicated that 18 runners were required to detect a moderate effect size between conditions, with β=0.20 and α=0.05.Accordingly, 18 male recreational runners (mean ± standard deviation (SD), age=33.5 ± 11.9 years, height=1.79 ± 5.4 m,mass=76.5 ± 8.4 kg, body mass index=23.4 ± 2.4 kg/m2,VO2peak= 55.8 ± 4.4 mL/kg·min, and recent 5-km time=21:18.61±1:58.22 mm:ss)completed the experimental protocol.Participants typically ran 3 times a week and 24 km per week (interquartile range: 2-4 times and 14.5-40 km,respectively) and had been running for at least 2 years (interquartile range: 5-28 years).Two researchers characterized participants’ foot strike patterns14as rearfoot (n=14) or nonrearfoot(mid/forefoot,n=4)from video recordings(50 Hz)at 70%of the speed found to elicit VO2peak(υVO2peak).Runners were recruited through personal contacts,running clubs,social media,and word of mouth.Inclusion criteria were male runners with a 5-km run time of approximately 20-25 min within the past 3 months.Runners with current or recent(<3 months)injuries were excluded.All participants provided written informed consent and were informed of the potential injury risks (e.g.,musculoskeletal injuries linked with running in novel footwear15and delayed onset muscle soreness).The experiment was approved by the Human Research Ethics Committee of the University of Waikato (HREC(Health)2018#81) and abided by the ethical standards of the Declaration of Helsinki.
2.2.Design and methodology
The effect of footwear on RE and TT treadmill performance was assessed using a randomized crossover study that required participants to attend 4 laboratory sessions (Fig.1).The first session collected baseline measures, established VO2peak,ensured proper shoe fit,and familiarized runners with the VP4 and FLAT footwear.These 2 experimental footwear conditions were selected because both were available for consumer purchase at the time of the study (i.e., not prototypes) and were considered high-end racing shoes.An additional key consideration for the FLAT condition was low footwear mass.The Saucony Endorphin Racer 2(approximately 150 g)fitted these criteria.Given that knowledge of shoe brand can affect perceived shoe comfort16and can potentially affect performance measures,3,5we spray-painted the VP4 and FLAT shoes black to blind the participants to the brand and model details (Supplementary Fig.1).In the second, third, and fourth sessions,RE at 60%, 70%, and 80% of υVO2peakand 3-km TT performance were assessed in each footwear condition in a randomized counterbalanced manner.Four to 7 days(6.6±0.9 days)separated each session,with a maximum of 14 days separating the first from last RE trials and 3-km TT.Reliability of measures for RE17and TT13treadmill-based tests completed 1 week apart has been shown to be good elsewhere for welltrained and elite male runners.Participants were tested at the same time of day and were asked to replicate their nutrition,sleep,and training patterns prior to each session,which was confirmed using a self-reported log.All tests were performed in a temperature-controlled laboratory (temperature: 18°C-20°C,humidity:55%-60%).
The surface stiffness of the motorized treadmill (Steelflex PT10 Fitness; Steelflex Fitness, Taipei, Taiwan, China) used for data collection was quantified using methods similar to those described elsewhere,18,19given that treadmillcompliance levels can affect metabolic20and biomechanical responses.21Weights (approximately 25 kg each, up to 300 kg,measured using a force plate)were sequentially positioned over the center of the treadmill running area.The displacement of the treadmill surface was tracked for each 25-kg increment twice using a 3-dimension motion capture system and 6 retro-reflective markers positioned on the treadmill bed.The average readings generated from 75-225 kg(up to 3×body mass of participants)was 365 kN/m.This stiffness value is similar to stiffness readings of 303 kN/m from an HP Cosmo treadmill (C, Quasar LE 500 CE; HP Cosmos Sports & Medical GMBH, Nussdorf-Traunstein, Germany)18and reflective of the hard treadmill surface condition(350 kN/m)examined by Hardin et al.19
2.2.1.Visit 1
Baseline information, anthropometric characteristics, and the mass, make, and model of participants’ OWN shoes were recorded in Visit 1.OWN shoes were self-selected by each participant in the knowledge that they were being asked to perform a VO2peak,RE,and 3-km TT on a treadmill.Participants then jogged around the laboratory in the 2 experimental footwear conditions to ensure proper fit.Immediate shoe comfort and prior experience in VP4,FLAT,and OWN were recorded using a visual analogue scale(VAS)based on work by Lindorfer et al.22The corresponding anchor points for these scales were 0=“Not comfortable at all” to 10=“Maximal comfort”and 0=“No experience at all (beginner)” to 10=“Extensive experience (expert)”.The minimalist index is a valid and reliable tool used to determine the level of minimalism of shoes and assesses several footwear characteristics without the need for specialized equipment.23Briefly,the minimalist index considers 5 key characteristics to establish the degree of minimalism of shoes, where 100% represents the highest level of minimalism and 0%the lowest.The 5 characteristics are shoe mass, longitudinal and torsional flexibility, heel height, heelto-toe drop, and the presence/absence of technologies.Together with the conventionally reported characteristics of footwear mass, heel height, and heel-to-toe drop, the minimal index permitted a better characterization of participants’OWN shoes.Shoe-related characteristics are presented in Table 1.
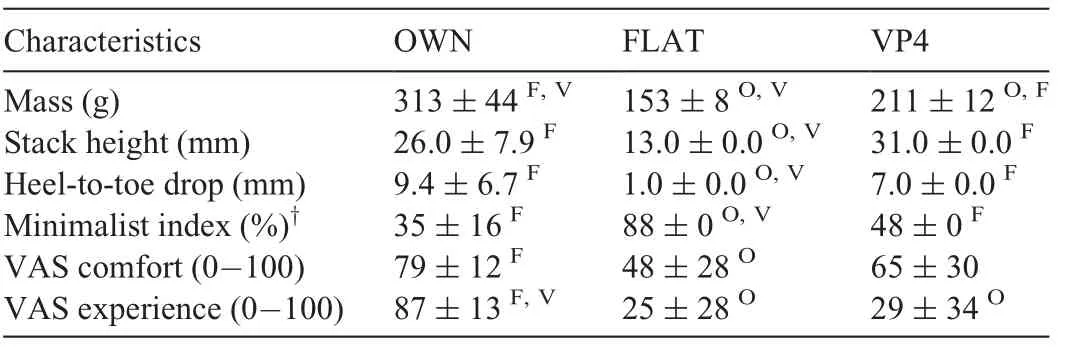
Table 1Shoe characteristics,comfort,and experience.
Participants subsequently completed a 4-min warm-up at 10 km/h running with their OWN shoes on a motorized treadmill(Steelflex PT10 Fitness; Steelflex Fitness) prior to completing a VO2peakramp test using an incremental speed protocol and 1%incline to assess maximal aerobic power.The test started at 10 km/h and increased 1 km/h per minute until volitional exhaustion.The mean υVO2peakwas 18.4 ± 1.0 km/h.After a 10-min rest,participants ran 6 min at a self-selected speed on the treadmill,3 min in VP4 and 3 min in FLAT for shoe familiarization in a random order,with a 1-min rest between footwear conditions.
2.2.2.Visits 2,3,and 4
RE and 3-km TT performance in VP4,FLAT,and OWN were assessed in Visits 2, 3, and 4 using a 1% incline to more accurately reflect the energetic cost of outdoor running.24Participants ran for 2 min at a self-selected speed as a warm-up in their allocated shoe condition and completed 3×3-min bouts at 60% (11.0 ± 0.6 km/h), 70% (12.9 ± 0.7 km/h), and 80%(14.7 ± 0.8 km/h) of υVO2peak.Running durations between 3 min and 15 min are typically used in RE tests,1with 3-min bouts shown to provide valid RE measures.25After each 3-min bout,participants rested 1 min during which time ratings of perceived exertion(RPE)using a 6-to 20-point Borg scale and blood lactate concentration levels from capillary fingertip samples using a Lactate-Pro 2 analyzer (Arkray Inc., Kyoto, Japan) were collected.Throughout the 3-min constant-speed bouts set at 60%,70%, and 80% of υVO2peak, heart rate (HR, Polar RS800CX;Polar, Kempele, Finland) was recorded at 15-s intervals and expired gases were continuously measured using a calibrated metabolic cart (True One 2400; Parvo Medics, Salt Lake City, UT,USA) to determine VO2and respiratory exchange ratio.Attainment of a steady state for each participant was monitored visually during testing and subsequently confirmed through manual and graphical inspection of reaching a plateau in the VO2time-curve output(ΔVO2≤1%VO2peakbetween 2 consecutive 15-s interval increments in the final minute, Supplementary Fig.2).21The highest 30-s mean ˙VO2registered in the last minute of each bout was used to determine oxygen consumption(mL/kg·min),energy cost (W/kg) using the P´eronnet and Massicotte26equation, and energetics cost of transport (J/kg·m) based on the running speed of each individual.RE data at a given intensity were removed from subsequent analyses when respiratory exchange ratio values exceeded 1.0, which would indicate running above anaerobic threshold, with a proportion of energy provided via anaerobic pathways.Following the last bout, participants rated their perceived shoe comfort on the comfort VAS and rested 5 min.
The starting speed for the blinded 3-km TT was set at 90%of υVO2peak(16.4±0.9 km/h).Participants were reminded to run the 3-km TT as fast as they could and provide a maximal effort.Given that the reproducibility of this test can be enhanced by familiarization,13participants were familiarized with the starting speed, speed increases, and speed decreases used during the TT(±0.5 km/h)for 1 min before the TT.Participants rested 1 min following familiarization and then started the TT.
During the TT, runners were blinded to their elapsed time and speed.13Participants verbally communicated “up” or“down” when they wanted 0.5 km/h changes in speed.The researcher verbally communicated the covered distance to participants in 400 m increments up to 2400 m, and in 100 m increments during the last 400 m.The researcher provided no other verbal encouragement.Anecdotally, no systematic TT pacing strategies were observed.Typically, runners requested to increase or decrease their speed from 5 to 6 times throughout the TT, although some runners chose to maintain their starting speed for the duration of the TT and others demonstrated greater speed fluctuations.At TT completion,RPE was collected and a perceived shoe performance VAS was obtained to examine whether participants perceived that the shoes had aided their performance.The corresponding anchor points were 0=“No help in performance” to 10=“Maximal help in performance”.At the end of all experimental sessions,participants were asked whether they knew what shoes they had been tested in.Only 1 runner correctly identified the VP4, with no runner identifying the make or model of the FLAT.
2.3.Statistical analysis
Descriptive statistics of the experimental measures are reported as mean ± SD.Data were analyzed using repeated measures analyses of variance and covariance.Identity was the between-subject error term, and footwear (VP4, FLAT,and OWN) was the repeated-measure term in all analyses.Shoe mass and Visit (2, 3, and 4) were added in the analyses of the main RE (oxygen consumption, energy cost, and energetics cost of transport) and TT (time) variables as covariates to evaluate any potential effect of shoe mass or test order on outcomes.When not significant, covariates were removed.Tukey’s honest significant difference was used in post hoc pairwise comparisons to determine which shoe-by-shoe comparisons significantly differed.Statistical significance was set at p ≤0.05 in all analyses.
To interpret practical meaningfulness, standardized effects were calculated using Cohen’s d and the pooled between-subject SDs from the 3 footwear conditions.Cohen’s d magnitudes were interpreted using thresholds of 0.2, 0.5, and 0.8 for small,moderate, and large, respectively.27The smallest worthwhile changes were set at 0.2 times the pooled between-subject SD for each metric to provide an indirect estimation of the smallest worthwhile change in our particular cohort,17with smaller effects considered trivial.The calculated smallest worthwhile change at 60%,70%,and 80%of υVO2peakwas 2.0%,1.6%,and 1.7%for oxygen consumption, respectively; 2.0%, 1.7%, and 1.7% for energy cost,respectively;and 1.9%,1.4%,and 1.4%for energetics cost of transport,respectively.This estimate was 1.7%for the 3-km TT.The effect was deemed unclear if Cohen’s d 95%confidence interval(95%CI)overlapped the thresholds for small positive and negative effects(i.e.,d±0.2).
3.Results
3.1.Running economy
The data from 1 RE trial in VP4 failed to save; and respiratory exchange ratio values exceeded 1.0 for 1 runner at 70% of υVO2peakand for 4 runners at 80% of υVO2peak.Hence, the complete RE dataset across footwear conditions was available from 17,16,and 13 runners at 60%,70%,and 80%of υVO2peak,respectively.Shoe mass (p ≥0.365) and Visit (p ≥0.321) had no significant effect on the main RE variables and were removedas covariates.Footwear significantly affected the 3 key RE variables across intensities(p <0.004,Table 2 and Fig.1).
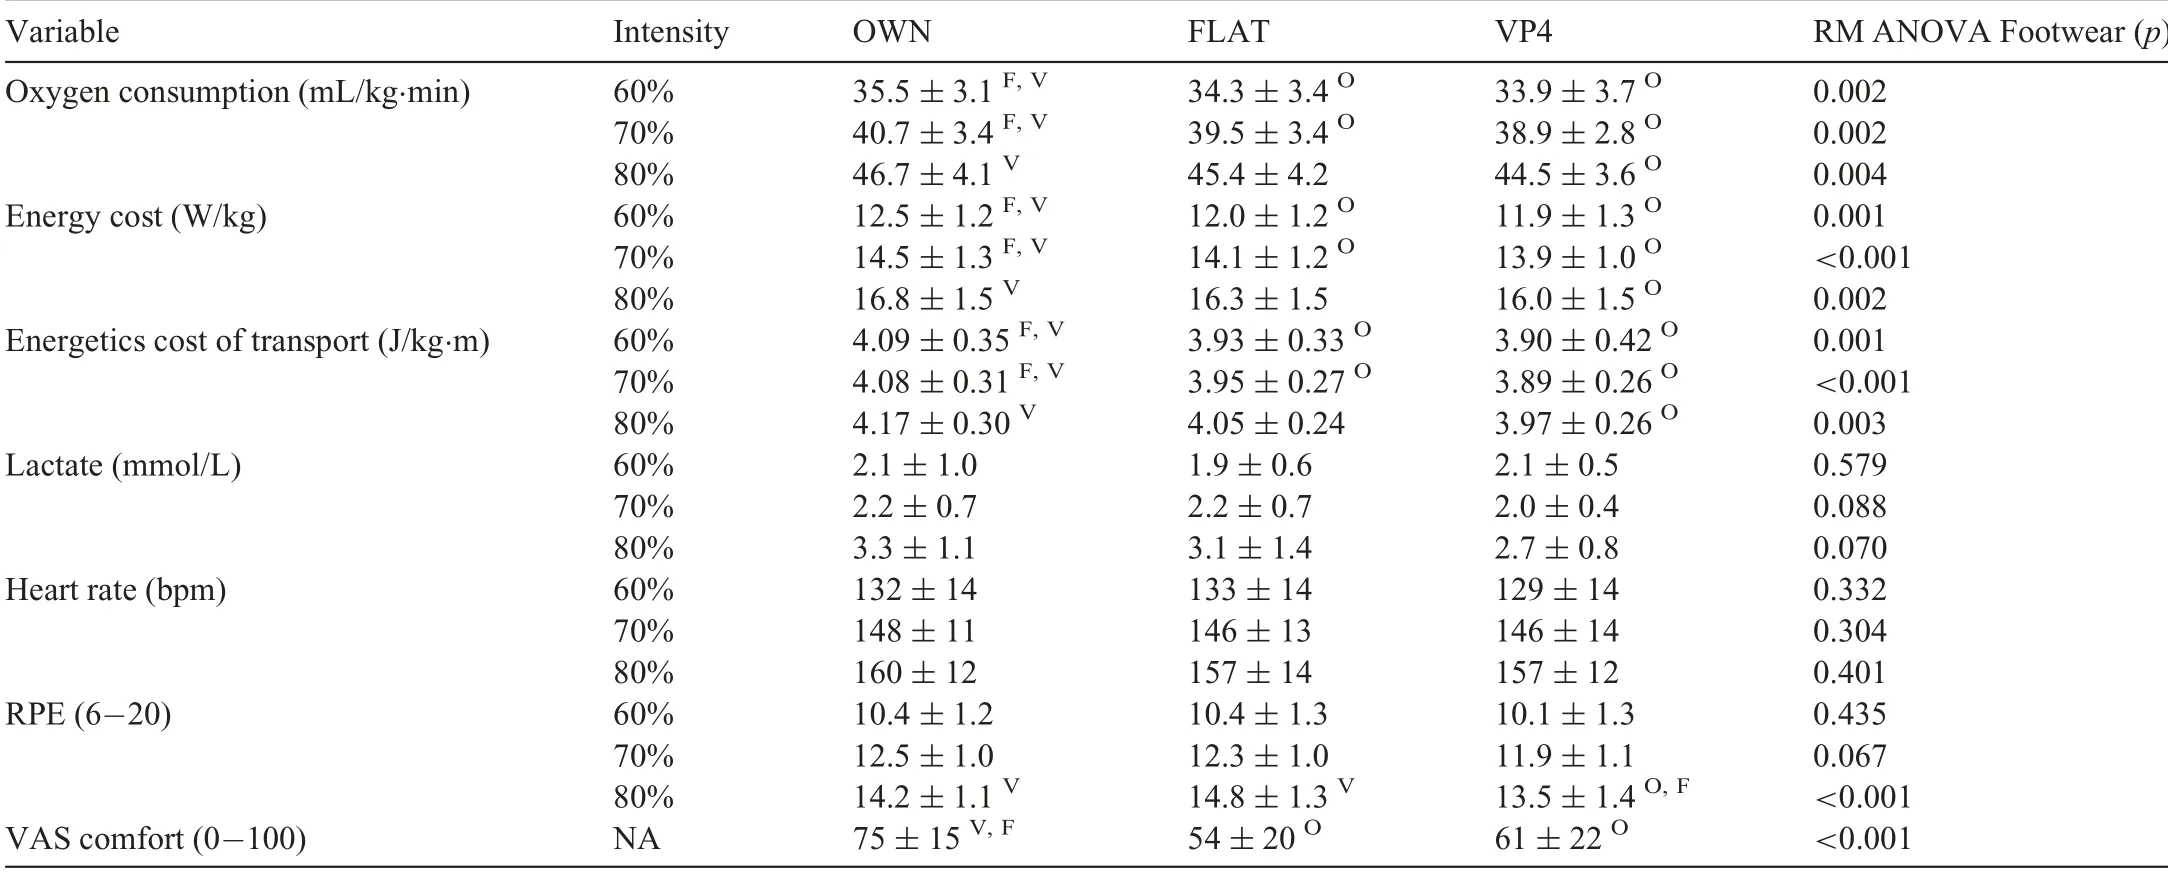
Table 2Variables (mean ± SD) collected from the running economy test from male runners at 60% (n=17), 70% (n=16), and 80% (n=13) of the speed that elicited VO2peak.
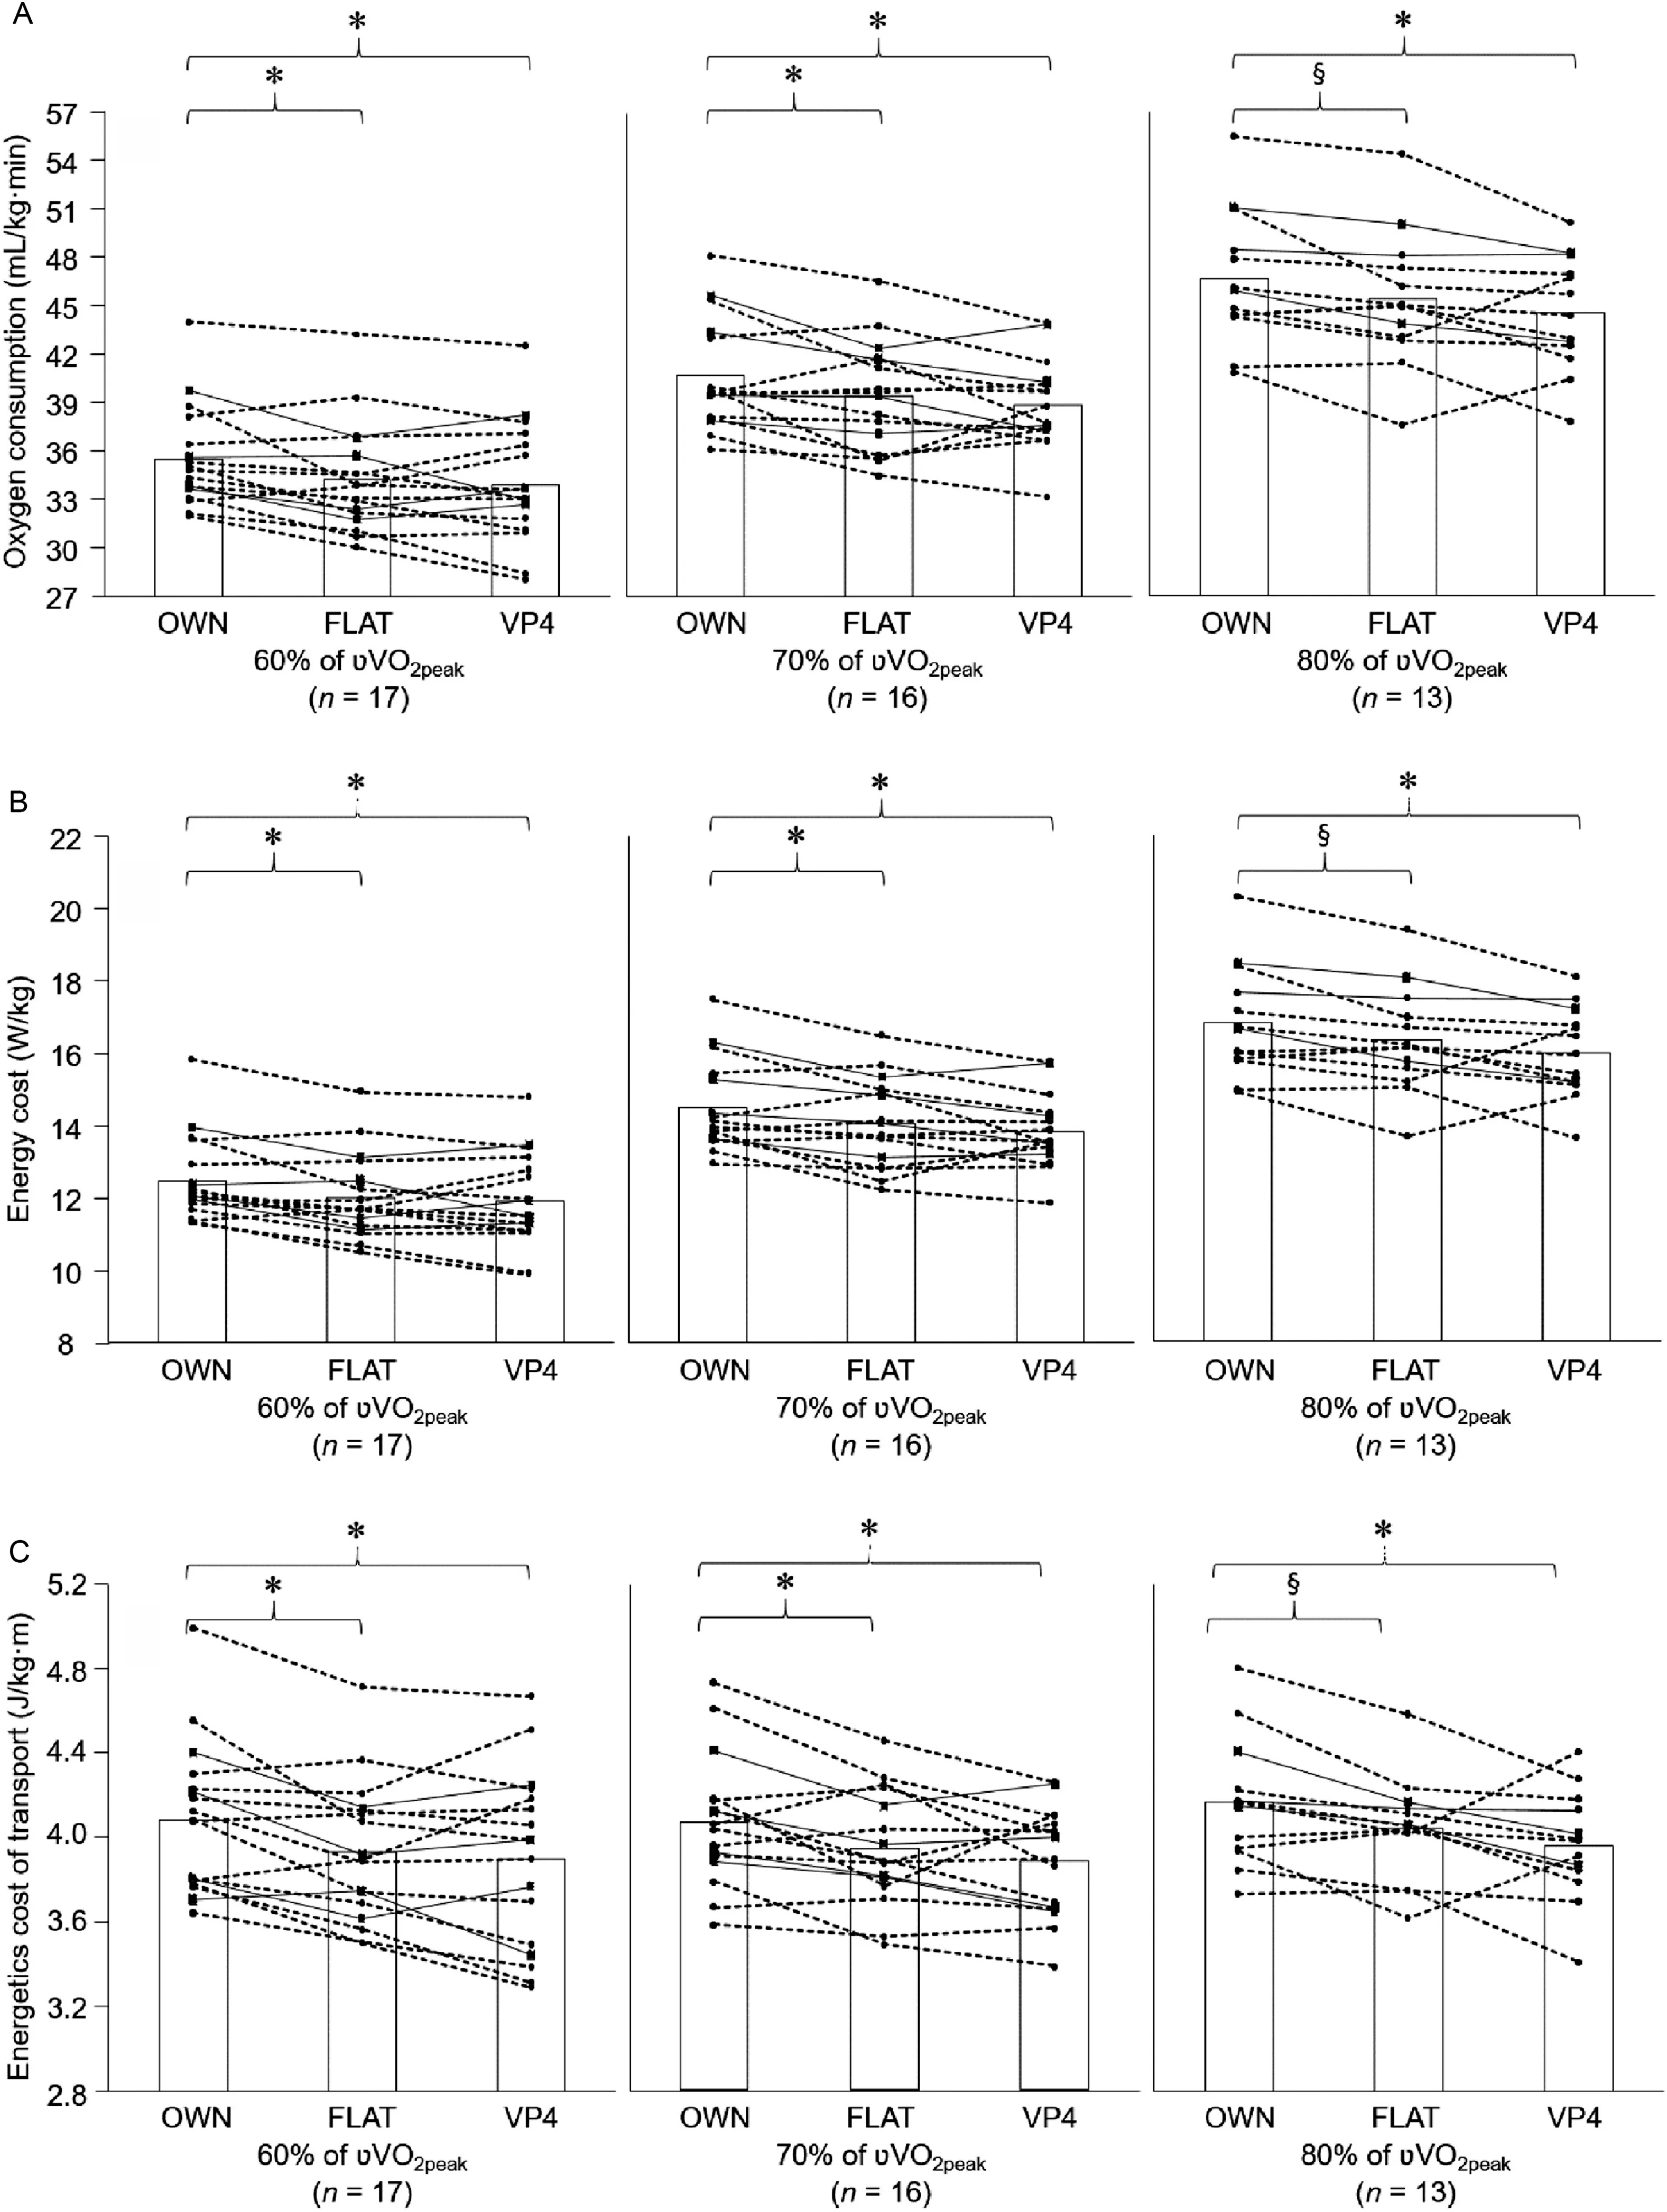
Fig.1.(A)Oxygen consumption(mL/kg·min);(B)energy cost(W/kg);and(C)energetics cost of transport(J/kg·m)at 60%,70%,and 80%of the speed that elicited VO2peak(υVO2peak).Bar graphs represent mean values,circles joined by dashed lines represent rearfoot runners,and squares joined by black lines represent non-rearfoot runners.*Significant difference(p ≤0.05)during post hoc comparisons when main effect of footwear was significant.§Non-significant difference at p <0.10.FLAT=Saucony Endorphin Racer 2 road racing flat;OWN=own habitual running shoes;VO2peak=peak oxygen uptake;VP4=Nike Vaporfly 4%.
3.1.1.Oxygen consumption
The mean (95%CI) reduction in oxygen consumption of 4.4% (1.3%-7.5%), 4.3% (1.9%-6.6%), and 4.4%(1.7%-7.1%) in VP4 vs.OWN were significant (p ≤0.003)and small to moderate in magnitude(Table 3)at the intensities of 60%, 70%, and 80% of υVO2peak, respectively.The small reductions in oxygen consumption of 3.4% (1.2%-5.5%),3.0% (0.7%-5.3%), and 2.7% (0.7%-4.6%) in FLAT were significant at 60%and 70%of υVO2peak(p ≤0.030),but not at 80%(p=0.092).The 1.0%(-1.3%to 3.4%),1.2%(-1.4%to 3.8%), and 1.7% (-1.5% to 4.9%) oxygen consumption differences between VP4 and FLAT(p ≥0.292)at these intensities were not significant.For individual runners, the change in oxygen consumption across all intensities ranged from-8.6%to 13.3%in VP4 vs.OWN,-9.6%to 9.7%in VP4 vs.FLA, and -5.5% to 12.6% in FLAT vs.OWN, where a positive percent change indicates improved RE and lower oxygen consumption.
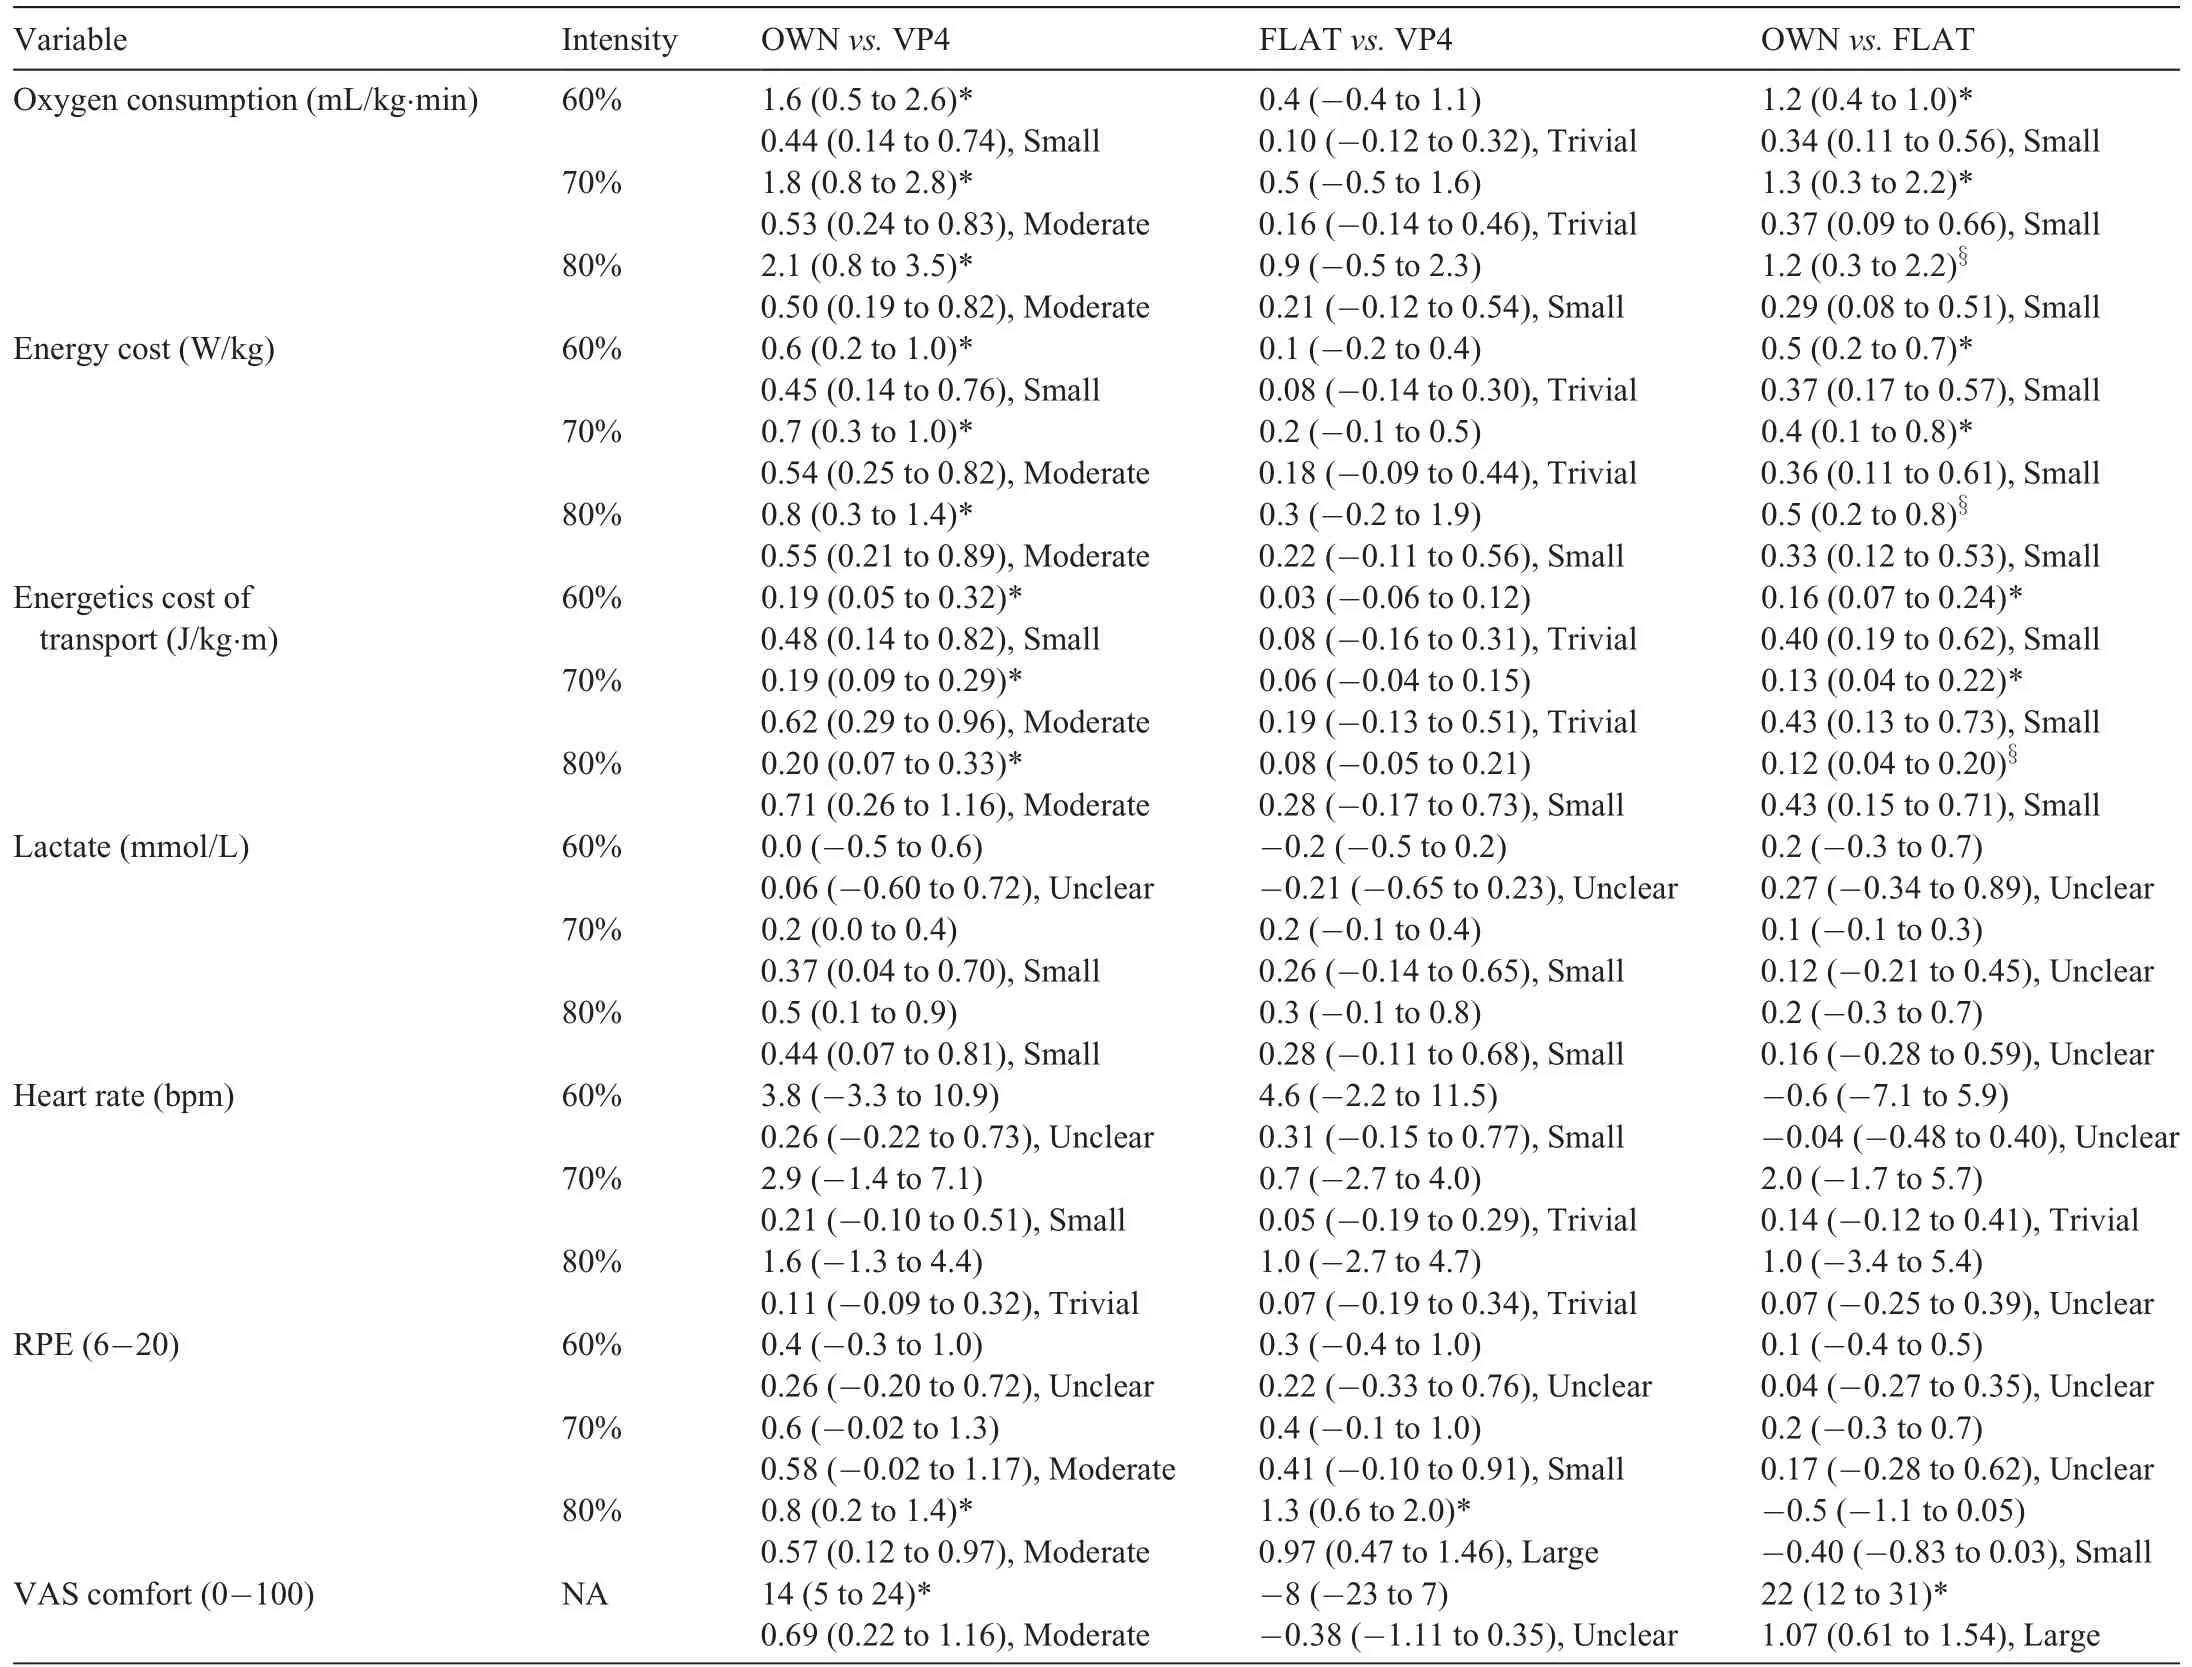
Table 3Differences between footwear conditions in the variables collected from the running economy test(mean(95%CI)and Cohen’s d effect size(95%CI)from male runners at 60%(n=17),70%(n=16),and 80%(n=13)of the speed that elicited VO2peak.
3.1.2.Energy cost
Energy cost was 4.5% (1.3%-7.8%), 4.4% (2.0%-6.7%),and 4.8%(1.8%-7.7%)lower in VP4 vs.OWN(p ≤0.002)at intensities of 60%, 70%, and 80%, respectively, of υVO2peak.The 3.7% (1.8%-5.7%), 3.0% (0.9%-5.2%), and 2.9%(1.0%-4.7%) lower energy cost in FLAT vs.OWN wassignificant at 60% and 70% (p ≤0.021), but not at 80%(p=0.068).The 0.9% (-1.5% to 3.2%) to 1.4% (-1.0% to 3.7%), and 1.9% (-1.4% to 5.2%) difference between VP4 and FLAT(p ≥0.259)were not significant at their corresponding 60%, 70%, and 80% intensities, although they exceeded the smallest worthwhile change at the greatest intensity.For individual runners,the change in energy cost across all intensities ranged from-10.3%to 13.1%in VP4 vs.OWN,-9.7%to 9.2% in VP4 vs.FLAT, and -4.6% to 10.5% in FLAT vs.OWN,where a positive percent change indicates improved RE and lower energy cost.
3.1.3.Energetics cost of transport
Energetics cost of transport was 4.5% (1.3%-7.8%), 4.4%(2.0%-6.7%), and 4.8% (1.8%-7.7%) lower in VP4 vs.OWN (p ≤0.002) at intensities of 60%, 70%, and 80% of υVO2peak, respectively.The 3.7% (1.8%-5.7%), 3.0%(0.9%-5.2%),and 2.9%(1.0%-4.7%)lower cost in FLAT vs.OWN was significant at 60% and 70% of υVO2peak(p ≤0.021), but not at 80% (p=0.069).The 0.9% (-1.5% to 3.2%),1.4%(-1.0%to 3.7%),and 1.9%(-1.4%to 5.2%)difference between VP4 and FLAT (p ≥0.305)were not significant, although they exceeded the smallest worthwhile change at the greatest intensity.For individual runners, the change in energy cost across all intensities ranged from -10.3% to 13.1% in VP4 vs.OWN, -9.7% to 9.2% in VP4 vs.FLAT,and-4.6%to 10.5%in FLAT vs.OWN,where a positive percent change indicates improved RE and lower energy cost.
3.1.4.Other variables
The only other statistically significant findings from the RE tests (Tables 2 and 3) were lower RPE in VP4 vs.OWN and FLAT at 80% υVO2peakof moderate and large magnitudes.Runners perceived their OWN footwear as more comfortable than VP4 and FLAT during the RE test.
3.2.Time-trials
Shoe mass (p=0.338) and Visit (p=0.261) had no significant effect on TT performance and were removed as covariates.Footwear significantly affected TT performance(p=0.005,Fig.2).Runners ran their 3-km TT with an average speed of 16.3±1.3 km/h wearing VP4,16.0±1.3 km/h wearing FLAT,and 15.9±1.3 km/h wearing OWN.
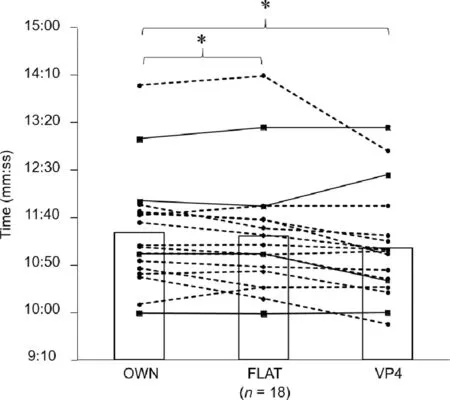
Fig.2.The 3-km time-trial times(mm:ss).Bar graphs represent mean values,circles joined by dashed lines represent rearfoot runners, and squares joined by black lines represent non-rearfoot runners.*Significant difference (p ≤0.05) during post hoc comparisons when main effect of footwear was significant.FLAT=Saucony Endorphin Racer 2 road racing flat; OWN=runners own habitual running shoes;VP4=Nike Vaporfly 4%.
TT performance enhancements in VP4 of 2.4%(0.6%-4.1%)vs.OWN(p=0.005)and of 1.8%(0.3%-3.4%)vs.FLAT(p=0.032)were significant and of small magnitudes(Table 4).Performances were similar between OWN and FLAT(0.5%(-0.3 to 1.4),p=0.747).
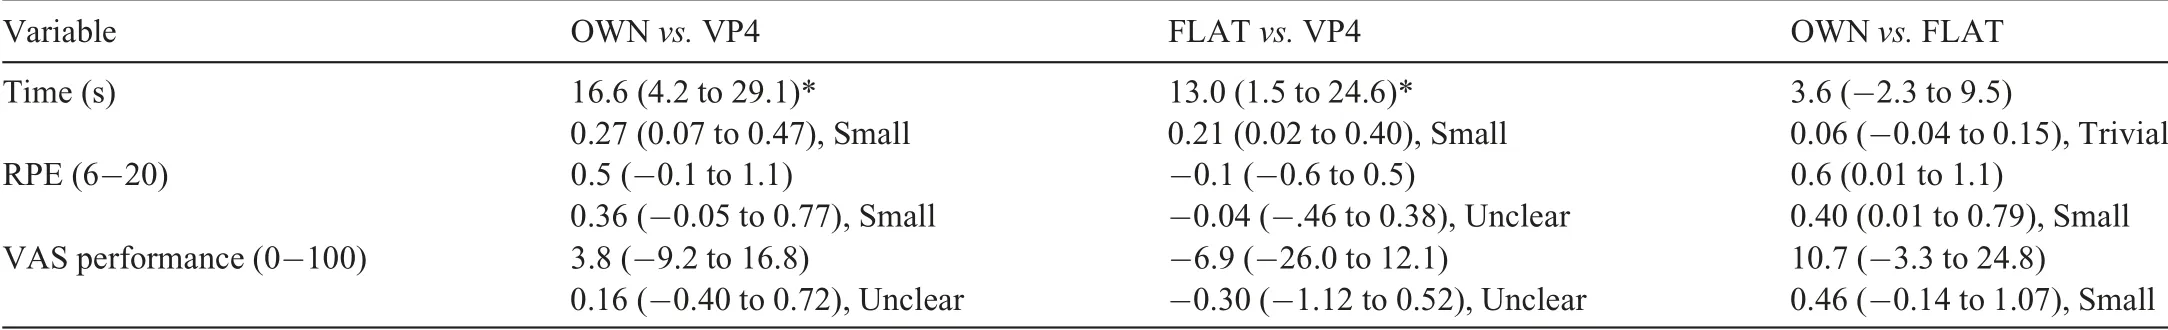
Table 4Differences between footwear conditions in all variables collected from the 3-km time trial (mean (95%CI) and Cohen’s d effect size (95%CI)) from 18 male runners.
For individual runners, changes in TT performance in VP4 ranged from -3.8% to 8.2% vs.OWN and from -4.7% to 9.3% vs.FLAT.Of the 18 runners, 11 produced their fastest performance in VP4(61%),4 in FLAT(22%),and 3 in OWN(17%).Two of the 4 non-rearfoot strikers (50%) performed their best TT in FLAT, with 1 in VP4 (25%) and 1 in OWN(25%).There was no significant difference in RPE measures(p=0.088) between OWN (18.8 ± 0.9), FLAT (18.3 ± 1.5),and VP4 (18.3 ± 1.5) footwear, and no perceived differenceregarding the effect of shoe on performance on the VAS(OWN:62±18,FLAT:51±22,VP4:58±26,p=0.345).
4.Discussion
Our study adds to the body of knowledge on the Nike Vaporfly, as reported from an independent laboratory, and is the first to observe that the VP4 can benefit laboratory-based RE measures in recreational runners compared to their habitual footwear,at relative rather than absolute speeds.Despite individual variability, VP4 reduced oxygen consumption, energy cost,and energetics cost of transport in male recreational runners compared to OWN on average by 4.3%-4.8% across intensities examined, which was clearly superior to the established smallest worthwhile changes of 1.4%-2.0%.The average 0.9%-1.9% difference in the key RE variables between VP4 and FLAT was not significant,but exceeded the worthwhile change threshold at 80% υVO2peakin terms of energy cost and energetics cost of transport.VP4 enhanced 3-km TT performance compared to the other 2 footwear.The 2.4% and 1.8% TT improvements in VP4 vs.OWN and FLAT, respectively, were also greater than the established 1.7% worthwhile change.Eleven of the runners ran their fastest TT in VP4(61%).Responses to footwear did not seem driven by the runners’perceptions based on VAS ratings.
Our RE findings align with findings in previous laboratorybased studies conducted with high-caliber runners,5-7insofar as RE variables were significantly improved in VP4 at the group level when compared to OWN, and elicited a worthwhile change compared to FLAT at the greatest intensity.Hunter et al.5reported 2.8% oxygen consumption improvements in high-caliber runners wearing VP4(184 g)at 16 km/h compared to those wearing Adidas Adios Boost (230 g),whereas both Hoogkamer et al.6and Barnes and Kilding7reported approximately 3.0%-4.2% improvements in oxygen consumption and energy costs in VP4 at absolute speeds ranging from 14 km/h to 18 km/h after equalizing shoe mass(236-250 g).When considering lightweight shoes, our average 1.0%-1.7% reduction in oxygen consumption in VP4 vs.FLAT was not significant,which contrasts with the significant 2.6% reduction seen in VP4 vs.Nike Zoom track spikes(118 g)7and Nike Zoom streak (192 g)5in high-caliber runners.The variation in RE gains from VP4 between studies likely relates to running speed differences,4type of runners and footwear examined,12variations in treadmill properties,19,28individual responses to footwear and cushioning,19the decision to equalise6,7or not equalise shoe mass, and the potential for the placebo effect.3,5The placebo effect has also been cited as a potential reason for changes in performance with footwear.3,5At the completion of our experimental trials,only 1 runner correctly identified the VP4, confirming that the potential for placebo or expectation was minimized.Our perceptual analyses relating to shoe experience, shoe comfort,and TT performance enhancement suggest no clear relationship between physiological or actual performance, with participants being most comfortable wearing their own running shoes.
For every 100 g of added shoe mass,the energy cost of running increases by approximately 0.7%-1.1%.3,8In our study,the mean mass of VP4 was 209 g,FLAT was 156 g,and OWN was 313 g.Considering these shoe-mass values,energy cost of running should have increased by approximately 1.6% from FLAT to OWN and approximately 1.0% from VP4 to OWN.Thus,the mass-energy relationship does not fully explain the overall RE advantages observed in our study, and notably highlights the positive effects of the VP4 construction on the metabolic cost of running, which is further evidenced by the observation of a non-significant effect of shoe mass in our analyses.VP4 has been shown to return 87%of the mechanical energy stored (7.46 J energy return per step)6when tested under conditions similar to running at 18 km/h.Although the amount of mechanical energy returned from the VP4 is relatively small compared to the amount of energy that can be returned by musculoskeletal structures,29,30it is sufficient to decrease the energetic cost of running and physiological requirements.
Frederick et al.31were among the first researchers to address the “cost of cushioning” after noting no difference in RE measures between barefoot running and running while wearing well-cushioned shoes.Subsequent research confirmed that 10 mm of cushioning reduces metabolic cost,but that the detrimental effects of shoe mass on energy expenditure counteract any benefits of cushioning when comparing barefoot running to shod treadmill running.20When matched for mass and controlling for other footwear features,shoes with a more compliant(i.e.,more cushioned)and resilient(i.e.,less energy loss) midsole can reduce oxygen cost by approximately 1%.32Similarly, inserting carbon fiber plates into midsoles to increase the longitudinal bending stiffness of footwear has also been shown to improve RE by approximately 1%,33although the location of the plate,34running speed,35and induced changes in running biomechanics34,36can influence this relationship.The“cost of cushioning”concept and energy return from the VP4 midsole—alongside the lighter shoe mass and stiffer midsole—likely underpin the 4.3%-4.8% reductions in oxygen consumption,energy cost,and energetics cost of transport compared to OWN across running intensities.
Runners in our study also performed better during the 3-km TT in VP4 by 16.6 s and 13.0 s compared to OWN and FLAT,respectively.These laboratory-based observations support the New York Times report of improvements in times for marathon and half-marathon races from Strava mobile application data.12Hoogkamer et al.3found that 3-km TT performance was degraded in a predictable fashion based on shoe mass, in that adding 100 g per shoe negatively affected performance by 0.78%.Accordingly, based on shoe mass alone, TT performance should have been 1.2%and 0.8%better in our study in FLAT and VP4 compared to OWN, rather than the 0.5% and 2.4%differences we observed.The lack of agreement between studies may reflect the different caliber of runners.The runners in the Hoogkamer et al.3study had a 3-km time of 10:26.1 ±0:55.6 mm:ss in control footwear, whereas our runners had a time of 11:24.3 ± 0:58.4 mm:ss in OWN footwear.Othercauses may have been technological benefits of VP4,6differences in foot strike patterns of cohorts,and more substantial difference between our runners’ OWN and FLAT footwear compared to VP4 (Table 1).To maintain the ecological validity of findings and reflect how runners would wear running shoes in real life,our study, by design, did not seek to equalize shoe mass by adding lead pellets to footwear.6,7
In our study, VP4 significantly improved 3-km TT performance compared to FLAT,whereas RE measures were similar when these footwear were compared, especially at the lowest intensities examined.Typically, improvements in RE lead to improved TT performances in a predictable manner.3It is possible that the greater difference in shoe characteristics(Table 1)between FLAT and OWN compared to VP4 and OWN was more challenging for runners to adapt to at a sustained maximal effort.It is possible that 3-km TT performance would have improved in FLAT vs.OWN had a period of habituation or training in FLAT been provided; however, a similar beneficial effect of habituation to the VP4 shoes could also be speculated.
Although our findings overall indicate that VP4 can benefit RE and long-distance racing performance in male recreational runners, the non-rearfoot strikers in our study appeared to respond less favorably to VP4, as also observed Hoogkamer et al.11Based on our 3-km TT results, 21 runners per group would be needed to detect a significant difference,with 80% power, in response to footwear between non-rearfoot and rearfoot strikers.The potential for greater benefits of VP4 in rearfoot strikers might be due to the greater compression of the midsole at the heel region.37Research specifically examining responses to VP4 footwear based on foot strike pattern is warranted to elucidate the interaction between foot strike characteristics and performance-enhancing effects of footwear.
Although reliable13(with a typical error of measurement of 1.0% following familiarization), conducting a treadmill TT has limitations.The TT difference in our study between VP4 and OWN equates to approximately 1 speed increment difference for the duration of the trial, with non-treadmill TT performances potentially more ecologically valid.Despite our data indicating no systematic change in performance between the 3 testing occasions (i.e., no significant influence of Visit),the fact that we did not provide our runners with the opportunity to complete an entire treadmill TT familiarization session prior to the experimental ones may have increased variability.A few runners exhibited better economy in VP4, but slower TT, which might be linked with the TT shortcomings, limited VP4 familiarization, and lack of prior racing or training in VP4.Another limitation is that a number of our recreational runners were above their anaerobic threshold at 80% of υ ˙VO2peak, reducing our statistical power.We only recruited male runners because of shoe cost considerations; however,we speculate that recreational female runners would respond similarly given the findings of similar VP4 responses from elite7and Strava12cohorts.Even though the spray painting of the shoes minimized the potential for a placebo effect, this method could not completely blind runners to the footwear worn.Furthermore, running in VP4 compared to other footwear has been shown to influence biomechanics,5,7,11with typical findings of increased stride length,longer flight times,and decreased peak plantar-flexion velocities in VP4.Despite being at a high relative intensity, the RE speeds in our study were slower than those examined previously and in different footwear;hence,investigating the biomechanical adaptation to VP4 could shed light on mechanisms that contribute to improved performance in recreational runners.However, one must consider the risks associated with changing biomechanical patterns in uninjured runners38and transitioning to novel footwear too quickly.15Finally, individuals vary in their responses to surface cushioning.19Treadmill construction and compliance levels can affect metabolic and biomechanical responses,21and not reflect outdoor running on surfaces that are less compliant.It may be that the combined VP4 shoe cushioning and treadmill damping effect resulted in less favorable responses to VP4.
5.Conclusion
Our study provides evidence that VP4 can benefit RE and 3-km TT performance and could potentially represent a viable ergogenic aid in recreational runners; however, there were considerable individual responses.Lightweight racing flats were also effective in improving RE vs.OWN shoes but were not superior to VP4.The generalization of our results from a hard treadmill surface to outdoor environments requires further investigation.Overall, using laboratory-based data, we provide evidence that VP4 can meaningfully improve RE and enhance distance-racing performance in male recreational runners,particularly when compared to runners’habitual running shoes.Individual responses to footwear were apparent in our cohort of recreational runners.
Acknowledgments
This study was undertaken at the University of Waikato Adams Centre for High Performance, New Zealand.The authors would like to acknowledge the runners for their voluntary participation in this study and Dr.Josie Athens for statistical support.This work was internally funded by Te Huataki Waiora School of Health, University of Waikato, New Zealand; and the Running Clinic, Canada, and not endorsed by any footwear company.
Authors’contributions
KHL contributed to the pilot testing,data extraction,statistical analysis,and the first draft of the manuscript;SJF contributed to the pilot testing, data extraction, and first draft of the manuscript; CMB contributed to the pilot testing and data extraction.All authors were involved in the study design and ethical approval process and contributed to data interpretation and the final draft of the manuscript.All authors have read and approved the final version of the manuscript, and agree with the order of presentation of the authors.
Competing interests
BD and JFE are employed by the Running Clinic, a continuing education organization that translates scientific evidence to healthcare professionals and the general public.KHL is a speaker for the Running Clinic.This role had no involvement in the study design and writing of the manuscript or the decision to submit it for publication.
Supplementary materials
Supplementary materials associated with this article can be found in the online version at doi:10.1016/j.jshs.2020.11.012.
 Journal of Sport and Health Science2022年3期
- Journal of Sport and Health Science的其它文章
- The secrets to running economy
- Longitudinal bending stiffness does not affect running economy in Nike Vaporfly Shoes
- Can changes in midsole bending stiffness of shoes affect the onset of joint work redistribution during a prolonged run?
- Metabolic cost of level,uphill,and downhill running in highly cushioned shoes with carbon-fiber plates
- Systematic reduction of leg muscle activity throughout a standard assessment of running footwear
- Neuromuscular,biomechanical,and energetic adjustments following repeated bouts of downhill running