
Neuromuscular,biomechanical,and energetic adjustments following repeated bouts of downhill running
2022-06-09 09:23ArshKhssetrshGinlucVernilloRentKrugerBrentEdwrdsGuillumeMillet
Arsh Khssetrsh,Ginluc Vernillo,b,Rent L.Kr¨uger,W.Brent Edwrds,Guillume Y.Millet,c,d,*
a Human Performance Laboratory,Faculty of Kinesiology,University of Calgary,Calgary T2N 1N4,Canada
b Department of Biomedical Sciences for Health,University of Milan,Milan 20133,Italy
c Inter-university Laboratory of Human Movement Biology,UJM-Saint-Etienne,Universit´e de Lyon,Saint-Etienne 42023,France
d Institut Universitaire de France(IUF),Paris 75231,France
Abstract Purpose:This study used downhill running as a model to investigate the repeated bout effect(RBE)on neuromuscular performance,running biomechanics,and metabolic cost of running. Methods:Ten healthy recreational male runners performed two 30-min bouts of downhill running(DR1 and DR2)at a-20%slope and 2.8 m/s 3 weeks apart.Neuromuscular fatigue,level running biomechanics during slow and fast running,and running economy parameters were recorded immediately before and after the downhill bouts,and at 24 h,48 h,72 h,96 h,and 168 h thereafter(i.e.,follow-up days). Results: An RBE was confirmed by attenuated muscle soreness and serum creatine kinase rise after DR2 compared to DR1.An RBE was also observed in maximum voluntary contraction(MVC)force loss and voluntary activation where DR2 resulted in attenuated MVC force loss and voluntary activation immediately after the run and during follow-up days.The downhill running protocol significantly influenced level running biomechanics;an RBE was observed in which center of mass excursion and,therefore,lower-extremity compliance were greater during followup days after DR1 compared to DR2.The observed changes in level running biomechanics did not influence the energy cost of running. Conclusion:This study demonstrated evidence of adaptation in neural drive as well as biomechanical changes with the RBE after DR.The higher neural drive resulted in attenuated MVC force loss after the second bout.It can be concluded that the RBE after downhill running manifests as changes to global and central fatigue parameters and running biomechanics without substantially altering the energy cost of running.
Keywords: Cost of running;Eccentric exercise;Fatigue;Muscle damage
1.Introduction
The repeated bout effect (RBE) during unaccustomed eccentric-biased exercises has been well documented.1The RBE refers to an orchestration of neural adaptations,2alterations to muscle mechanical properties,3structural remodeling of the extracellular matrix,4and biochemical signaling5that attenuates the extent of strength loss and delayed-onset muscle soreness for a given exercise during subsequent bouts(reviewed in Hyldahl et al.1).A majority of the literature thus far has analyzed the RBE during single-joint tasks.1This is a caveat because the neuromuscular system may distribute the workload demands of a multijoint task differently over time.6Consequently,RBE observations during single-joint tasks may not necessarily be directly translatable to dynamic multijoint tasks such as downhill running(DR),which has become more prevalent due to the increased interest in trail and mountain running events.7
DR is characterized by high levels of eccentric muscle contractions in lower-limb extensor muscles, the extent of which is dependent on the slope,duration,and speed of running.8-11Byrnes et al.12showed that a single bout of 30-min DR increased serum creatine kinase (CK) and muscle soreness,which peaked at 6 h and 42 h postexercise,respectively.Repetition of the same DR protocol performed up to 6 weeks after the initial bout substantially attenuated these measures,12confirming that DR can be used as a model of exercise-induced muscle damage to investigate RBE.
An immediate and a long-lasting reduction in maximum voluntary contraction (MVC) force after a bout of damageinducing DR has been well documented.13-18MVC force loss is the global index of neuromuscular fatigue, the extent of which is dictated by central or peripheral factors or by a combination of the two.19Several studies have investigated MVC force loss after DR using electrical nerve stimulations.17,20,21These studies suggested that central fatigue(originating at spinal and/or supraspinal levels19)plays a role in MVC force loss after DR, but persistent MVC force loss afterwards was due predominantly to peripheral fatigue (occurring at the skeletal muscle level22).An RBE in MVC force loss after prolonged DR has been reported,23but the extent to which RBE may influence the components of neuromuscular fatigue after DR has not yet been studied.Although much of the MVC force loss may be attributed to peripheral fatigue (i.e., disruption in excitation-contraction mechanisms24),some research also suggests a neural contribution to RBE.2,25Information about the origin of neuromuscular fatigue may lead to a better understanding of the mechanisms behind the RBE1,2in DR.
Eccentric-biased exercise is known to increase oxygen uptake (˙VO2) during level running (LR) performed on subsequent days.14,26The cause(s)of elevated ˙VO2after a damageinducing exercise are multifactorial and may be related to factors such as increased ventilation due to muscle soreness,26elevated resting metabolic rate,27or changes in running biomechanics.15If these factors were mitigated by the RBE,an attenuated drift in both ˙VO2and energy cost of running (Cr)28during LR would be expected.An attenuated ˙VO2drift due to the RBE after the second DR bout has been shown.13Attenuated ventilation due to attenuated soreness29after the second bout as well as attenuated changes in running biomechanics13were reported as potential causes.
The Cr is closely tied to running biomechanics.30LR biomechanics changes 24 h to 72 h after a damage-inducing bout of DR, shifting toward an increased stride frequency and a reduced lower-extremity range of motion.13-16Muscle soreness was introduced as a potential reason for the aforementioned changes.13The RBE on LR biomechanics after DR has been investigated only in a single study,13which reported that the RBE attenuated ankle and knee range-of-motion reductions during LR when performed up to 48 h after the DR bout.13However,the relationship between running biomechanical variables and ˙VO2/Cr is more complicated; it also depends on spatiotemporal factors, such as contact time, center of mass excursion, and/or leg stiffness.31Given that these variables have not been investigated previously, a more comprehensive analysis of running biomechanics is needed to elucidate the RBE on LR biomechanics after repeated DR bouts.
To summarize, the impacts of the RBE after DR on the causes of neuromuscular fatigue (central vs.peripheral), running economy,as well as running biomechanics remain largely unknown.Thus,this study aimed to investigate the effects of a repeated bout of DR on acute and delayed changes in neuromuscular function, Cr, spatiotemporal parameters, and external-force measurements during LR.We hypothesized that the RBE would attenuate global, peripheral, and central indices of neuromuscular fatigue, as well as soreness in knee extensor muscles, resulting in attenuated changes in biomechanics and Cr during LR.
2.Methods
2.1.Participants
Ten young healthy males(age=25.7±2.8 years,height=1.76±0.07 m,body mass=75.6±10.8 kg;mean±SD)participated in this study.The participants were recruited either through fliers around university campus or posts on social media.The participants were recreational runners who were already familiar with treadmill running.During the 6 months prior to data collection,the participants had not performed prolonged downhill running or sustained any running-related injuries.The study procedure complied with the Declaration of Helsinki and was approved by the University of Calgary Ethics Board(ethics number:REB 18-3093).All participants signed a written informed-consent form.The participants were asked to refrain from performing any strenuous exercise for 72 h before the beginning of the protocol and during the subsequent 4 weeks of data collection.
2.2.Protocol
A schematic representation of the protocol is shown in Fig.1.The study was composed of 2 DR sessions separated by 3 weeks (Fig.1A).The participants visited the laboratory on 13 different occasions.The 1st session(Fig.1B)was dedicated to familiarizing the participants with the experiment’s protocol, which included neuromuscular fatigue evaluation(NMFE) on an isometric chair (Fig.1C), DR on an instrumented treadmill,and the visual perceived soreness scale.The 2nd and the 8th sessions (Fig.1B) were dedicated to DR bouts, hereafter called DR1 and DR2, respectively.These DR bouts were always performed on a Monday and were exactly 3 weeks apart.Sessions 3-7 and 9-13 were performed 24 h,48 h, 72 h, 96 h, and 168 h (POST24 to POST168) after DR1 and DR2, respectively.These sessions will hereafter be referred to as follow-up sessions.Immediately before (PRE)and after (POST) downhill run, follow-up sessions were dedicated to blood sampling and assessing neuromuscular function,running biomechanics, and Cr.The participant’s body mass was measured during each visit and was used to calculate biomechanical and Cr parameters.
2.3.Downhill running
Each participant performed all tests at the same time of day(morning, afternoon, or evening ± 1 h) to control for withinparticipant diurnal variation.DR bouts consisted of running on an instrumented treadmill Version 2.0 (Bertec, Columbus,OH,USA)at a-20%slope and at a constant speed of 2.8 m/s(i.e., 10 km/h).The speed (2.8 m/s), slope (-20%), and duration of DR (30 min) were chosen based on the study done by Martin et al.32
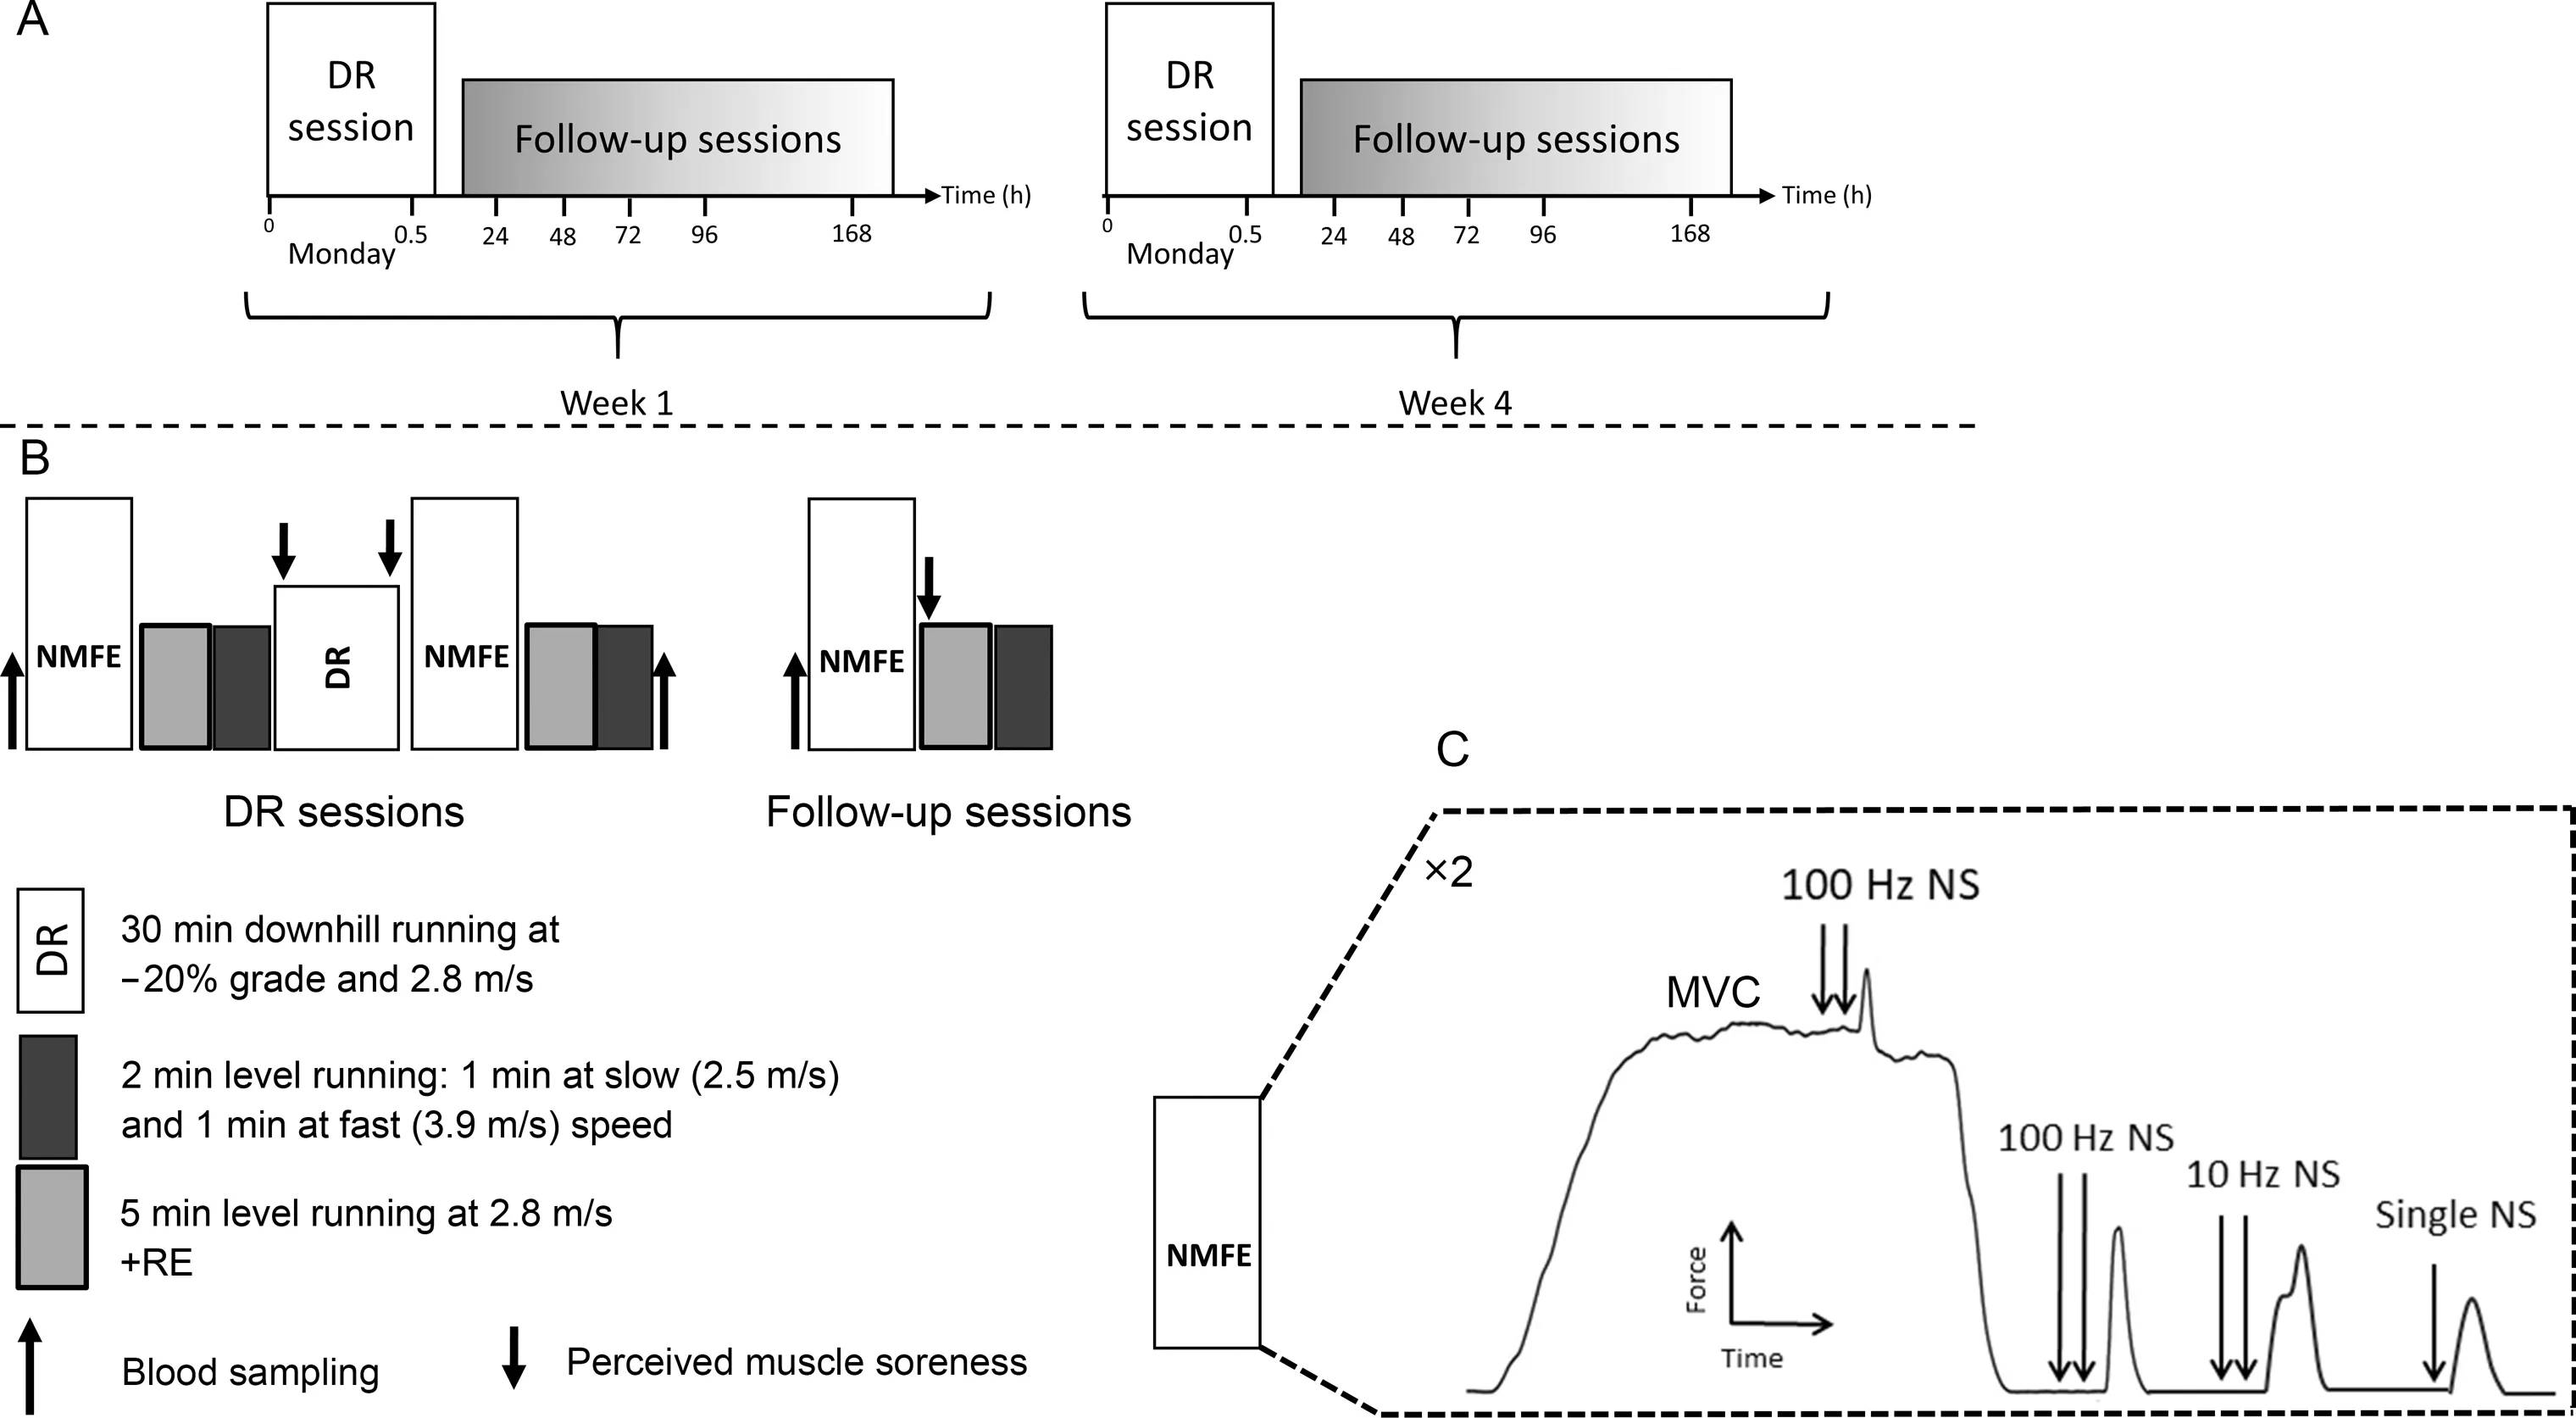
Fig.1.Schematic overview of the protocol(not scaled in time).(A)The 2 DR sessions were separated by 3 weeks.(B and C)The detailed description of the sessions and the detailed neuromuscular function evaluations.DR=downhill running;MVC=maximal voluntary contraction;NMFE=neuromuscular function evaluation;NS=femoral nerve stimulation;RE=running economy.
2.4.Neuromuscular function evaluation
The NMFE was performed on the knee extensors of the right leg using peripheral nerve stimulations delivered to the femoral nerve trunk.The participant sat on an isometric chair with 80°hip flexion and 90° knee flexion.The ankle was fixed to the chair just slightly above the malleolus using a noncompliant strap attached to a calibrated force transducer.Two NMFE trials were performed immediately before (PRE) and 3 min after(POST) DR1 and DR2 and at POST24 to POST168.During each NMFE,the participant performed 3 sets of 5-s MVCs with 1-min rest in between.The 1st MVC was performed without femoral nerve stimulation.The 2nd and 3rd MVCs were performed with femoral nerve stimulation using the adapted interpolated twitch technique.33The NMFE procedure is shown in Fig.1C.Once a plateau was identified in the force response,1 superimposed high-frequency doublet(Db100sup)was delivered to the femoral nerve.Between 2 s and 3 s after MVC, the following stimulations were evoked on the relaxed muscle: highfrequency doublet(Db100),low-frequency doublet(Db10),and single twitch (Pt) with a 5-s interval between each.Global fatigue was assessed by MVC loss.Db100, Db10, Pt, and the ratio between the Db10 to Db100(Db10:Db100,as the index of low-frequency fatigue)were averaged between the 2 NMFE trials and were used as indices of peripheral fatigue.Central fatigue was assessed by voluntary activation(VA)level,which was calculated using the following equation:34
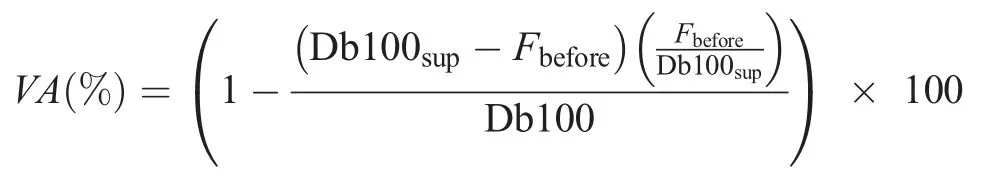
where Fbeforeterm is the force response just before the superimposed doublet was delivered.
2.5.Running biomechanics
Spatiotemporal parameters and external forces were assessed during running at 2 different speeds (2.5 m/s (i.e.,9 km/h-slow speed) and 3.9 m/s (i.e., 14 km/h-fast speed))on the same instrumented treadmill used for DR sessions for 1 min each.Ground reaction forces were recorded at 2000 Hz within the middle 20 s of each running bout to ensure steady-state running.These bouts were performed before(PRE)and within 10 min after(POST)DR1 and DR2 and at POST24 to POST168.A vertical ground reaction force threshold of 20 N was used to identify foot strike and toeoff.Contact time,flight time,and step frequency were subsequently quantified from these events.The vertical impulse was calculated from the time integral of the vertical ground reaction force.Center of mass excursion and touchdown velocity were calculated as follows:
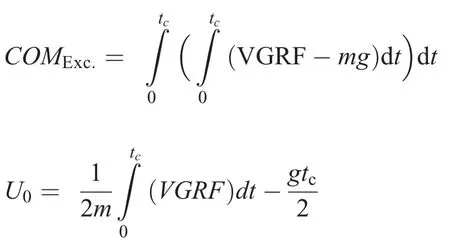
where dt is the time increment,COMExc.is the center of mass excursion,VGRF is the vertical component of ground reaction force,and U0is the touchdown velocity.The parameters m,g,and tcrepresent total body mass, gravitational acceleration,and contact time,respectively.
2.6.Running economy
Breath-by-breath respiratory responses were measured using an automatic metabolic cart (Quark CPET; Cosmed,Rome, Italy).During each visit, the resting gas exchange was measured in a sitting position for 4 min.Participants then performed bouts of 5-min LR at 2.8 m/s(i.e.,10 km/h)while the gas exchange was measured in order to analyze running economy.These bouts were performed before (PRE) and within 15 min after (POST) DR1 and DR2, as well as at POST24 to POST168.The last 1 min of each 5-min measurement was used for analysis to achieve a flat, steady-state ˙VO2plateau.The following variables were considered for statistical analysis: ˙VO2, pulmonary ventilation (˙VE), respiratory exchange ratio (RER), and Cr, defined by the energy required to run 1 meter normalized to kg of body mass with a unit of J/m/kg:
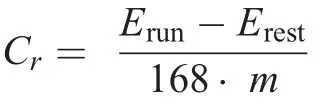
where Erunis the energy equivalent in kJ/min of ˙VO2during running, Erestis the energy equivalent of ˙VO2at rest, m is the body mass in kg,and 168 is the distance in meters run in 1 min at 2.8 m/s(i.e.,10 km/h).
2.7.Perceived muscle soreness
Borg’s category ratio 10 (CR10) pain scale35was used to assess perceived muscle soreness(SOR).Participants reported their perceived SOR in the quadriceps muscle group at the static squatting position.Participants were instructed always to start by looking at the verbal expressions on the CR10 scale and then choose a number between 0 (nothing at all) and 10(extremely strong)or higher than 10(absolute maximum).
2.8.Blood sampling
Blood sampling was performed before (PRE) and within half an hour after(POST)DR1 and DR2 as well as at POST48 and POST72.Approximately 4 mL of blood were drawn from the antecubital vein into serum vacutainers (red stoppers).After sitting for at least 30 min at room temperature for clot formation, the blood samples were centrifuged for 15 min at 3000×g at 4°C to obtain blood serum, which was stored for 2-4 weeks at -20°C.Blood serum samples were then analyzed (Cobas 8000, Roche Diagnostics, Basel, Switzerland)for CK concentration.
2.9.Statistical analysis
All variables were checked for normality and the results were reported as mean±SD.Neuromuscular fatigue parameters, running economy parameters, running biomechanics parameters,and muscle soreness were considered as dependent variables.All dependent variables were normalized to baseline(baseline was the magnitude of the dependent parameter of interest at PRE) except SOR, CK, VA, and Db10:Db100.To assess the differences between PRE and POST DR (fatigue effect) as well as muscle damage (PRE, POST24 to POST168), a longitudinal analysis (bout×time) was performed using generalized estimating equations(GEE;Generalized Linear Model Procedure).If significant main effects or interactions were observed, pairwise comparisons were adjusted for multiple comparisons using the Bonferroni correction.All statistical analyses were performed using IBM SPSS Statistics (Version 26.0.0; IBM Corp., Armonk, NY, USA)with the criterion α-level set to 0.05.
3.Results
Numerical values for all the variables investigated at all time points, along with their corresponding statistics, are presented in Supplementary Table 1.
3.1.Blood CK and SOR
Blood samples were taken from a subset of participants(n=6).A significant time×bout interaction (χ2(3)=15.1,p=0.002) was observed for CK (Fig.2A).After DR1, the blood CK increased from 232 U/L at PRE to 368 U/L,522 U/L,and 438 U/L (all p <0.011) at POST, POST48, and POST96,respectively.After DR2, CK did not significantly increase (all p >0.078).
A significant bout×time interaction (χ2(6)=126.1, p <0.001) was observed for SOR (Fig.2B).After DR1, SOR increased by 2.73 units (p <0.001) and remained elevateduntil POST96 (all p <0.05) and returned to the baseline at POST168.After DR2, SOR increased by 0.72 units (p <0.001), remained elevated at POST24 (p < 0.011), and returned to baseline at POST48.Furthermore,SOR was higher after DR1 at POST, POST24, POST48, and POST72 as compared to DR2(all p <0.027).
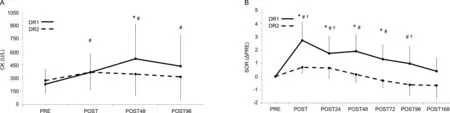
Fig.2.(A) Serum CK and (B) perceived muscle soreness at different measurement points.Values are means ± SD.* p <0.05, significent difference between bouts; #p <0.05,significent difference from PRE in DR1; †p <0.05,significent difference from PRE in DR2.CK=creatine kinase;DR1=downhill running 1;DR2=downhill running 2;PRE=before downhill run;SOR=perceived muscle soreness.
3.2.Neuromuscular function
A significant bout×time interaction (χ2(6)=54.1, p <0.001) was observed for MVC (Fig.3A) (Table 1).After DR1, MVC dropped by 16.5% (p <0.001) at POST and remained lower than baseline until POST48 (all p <0.004).After DR2,MVC dropped by 8.4%(p <0.001)and recovered by POST24(p=0.083).Reductions in MVC during follow-up days of DR1 at POST, POST48, and POST96 were significantly greater than those of DR2(all p <0.032).
The results for the peripheral fatigue variables(Fig.3B-D)(Table 1) were similar to each other, i.e., a significant time effect,but no significant bout×time interaction was observed.On average, Db100, Db10:Db100, and Pt dropped by 14.9%,26%, and 24% (all p <0.001) at POST and returned to baseline by POST48.
A significant bout×time interaction (χ2(6)=285.2, p <0.001)was observed for VA(Fig.3E)(Table 1).After DR1,VA dropped by 8.6% (p <0.001) at POST and returned to baseline at POST24 (p=0.366).After DR2, VA did not change either at POST or during recovery days(all p >0.242).VA at POST DR1 was 5.8% (p <0.001) lower than that at POST DR2.Furthermore, VA after DR1 was lower than after DR2 from POST24 to POST72 (all p <0.015) and at POST 168(p=0.025).
3.3.Running biomechanics
A significant bout×time interaction (χ2(6)=86.0, p <0.001) was observed for contact time at fast speed (Fig.4A)(Table 1).After DR1, this variable increased by 2.5% (p <0.001) at POST and then reduced by 3.1% (p <0.001) at POST24 and remained lower than baseline (all p <0.018)until POST168(p=0.112).After DR2,contact time decreased by 2.7% at POST (p <0.001) and returned to baseline at POST24 (p=0.317).Furthermore, changes in contact time at fast speeds were larger during DR1 than DR2 at POST24 and POST72(all p <0.02).
A significant bout×time interaction (χ2(6)=22.9,p=0.001) was observed for flight time at slow speed (Fig.4B)(Table 1).Only after DR1 at POST24 was the flight time smaller than PRE(p=0.029).Furthermore,the change in flight time was smaller for DR1 than DR2 at POST24(p=0.019).
A significant bout×time interaction was not observed for step frequency at slow or fast speeds (Table 1).A significant time effect was observed for step frequency at both slow and fast speeds (Fig.4C) (Table 1).Step frequency at POST increased by 2.1% and 1.6% (all p <0.009) for slow and fast speeds,respectively,and returned to baseline at POST72.
A significant bout×time interaction (χ2(6)=33.3, p <0.001)was observed for vertical impulse at slow speed(Fig.4D)(Table 1).On average, vertical impulse after DR1 was reduced by 2.4%at POST(p <0.001)and remained lower than baseline until POST48 (all p < 0.003) and returned to baseline at POST72.Vertical impulse after DR2 was reduced by 2.8%(p <0.001)and returned to baseline at POST48.
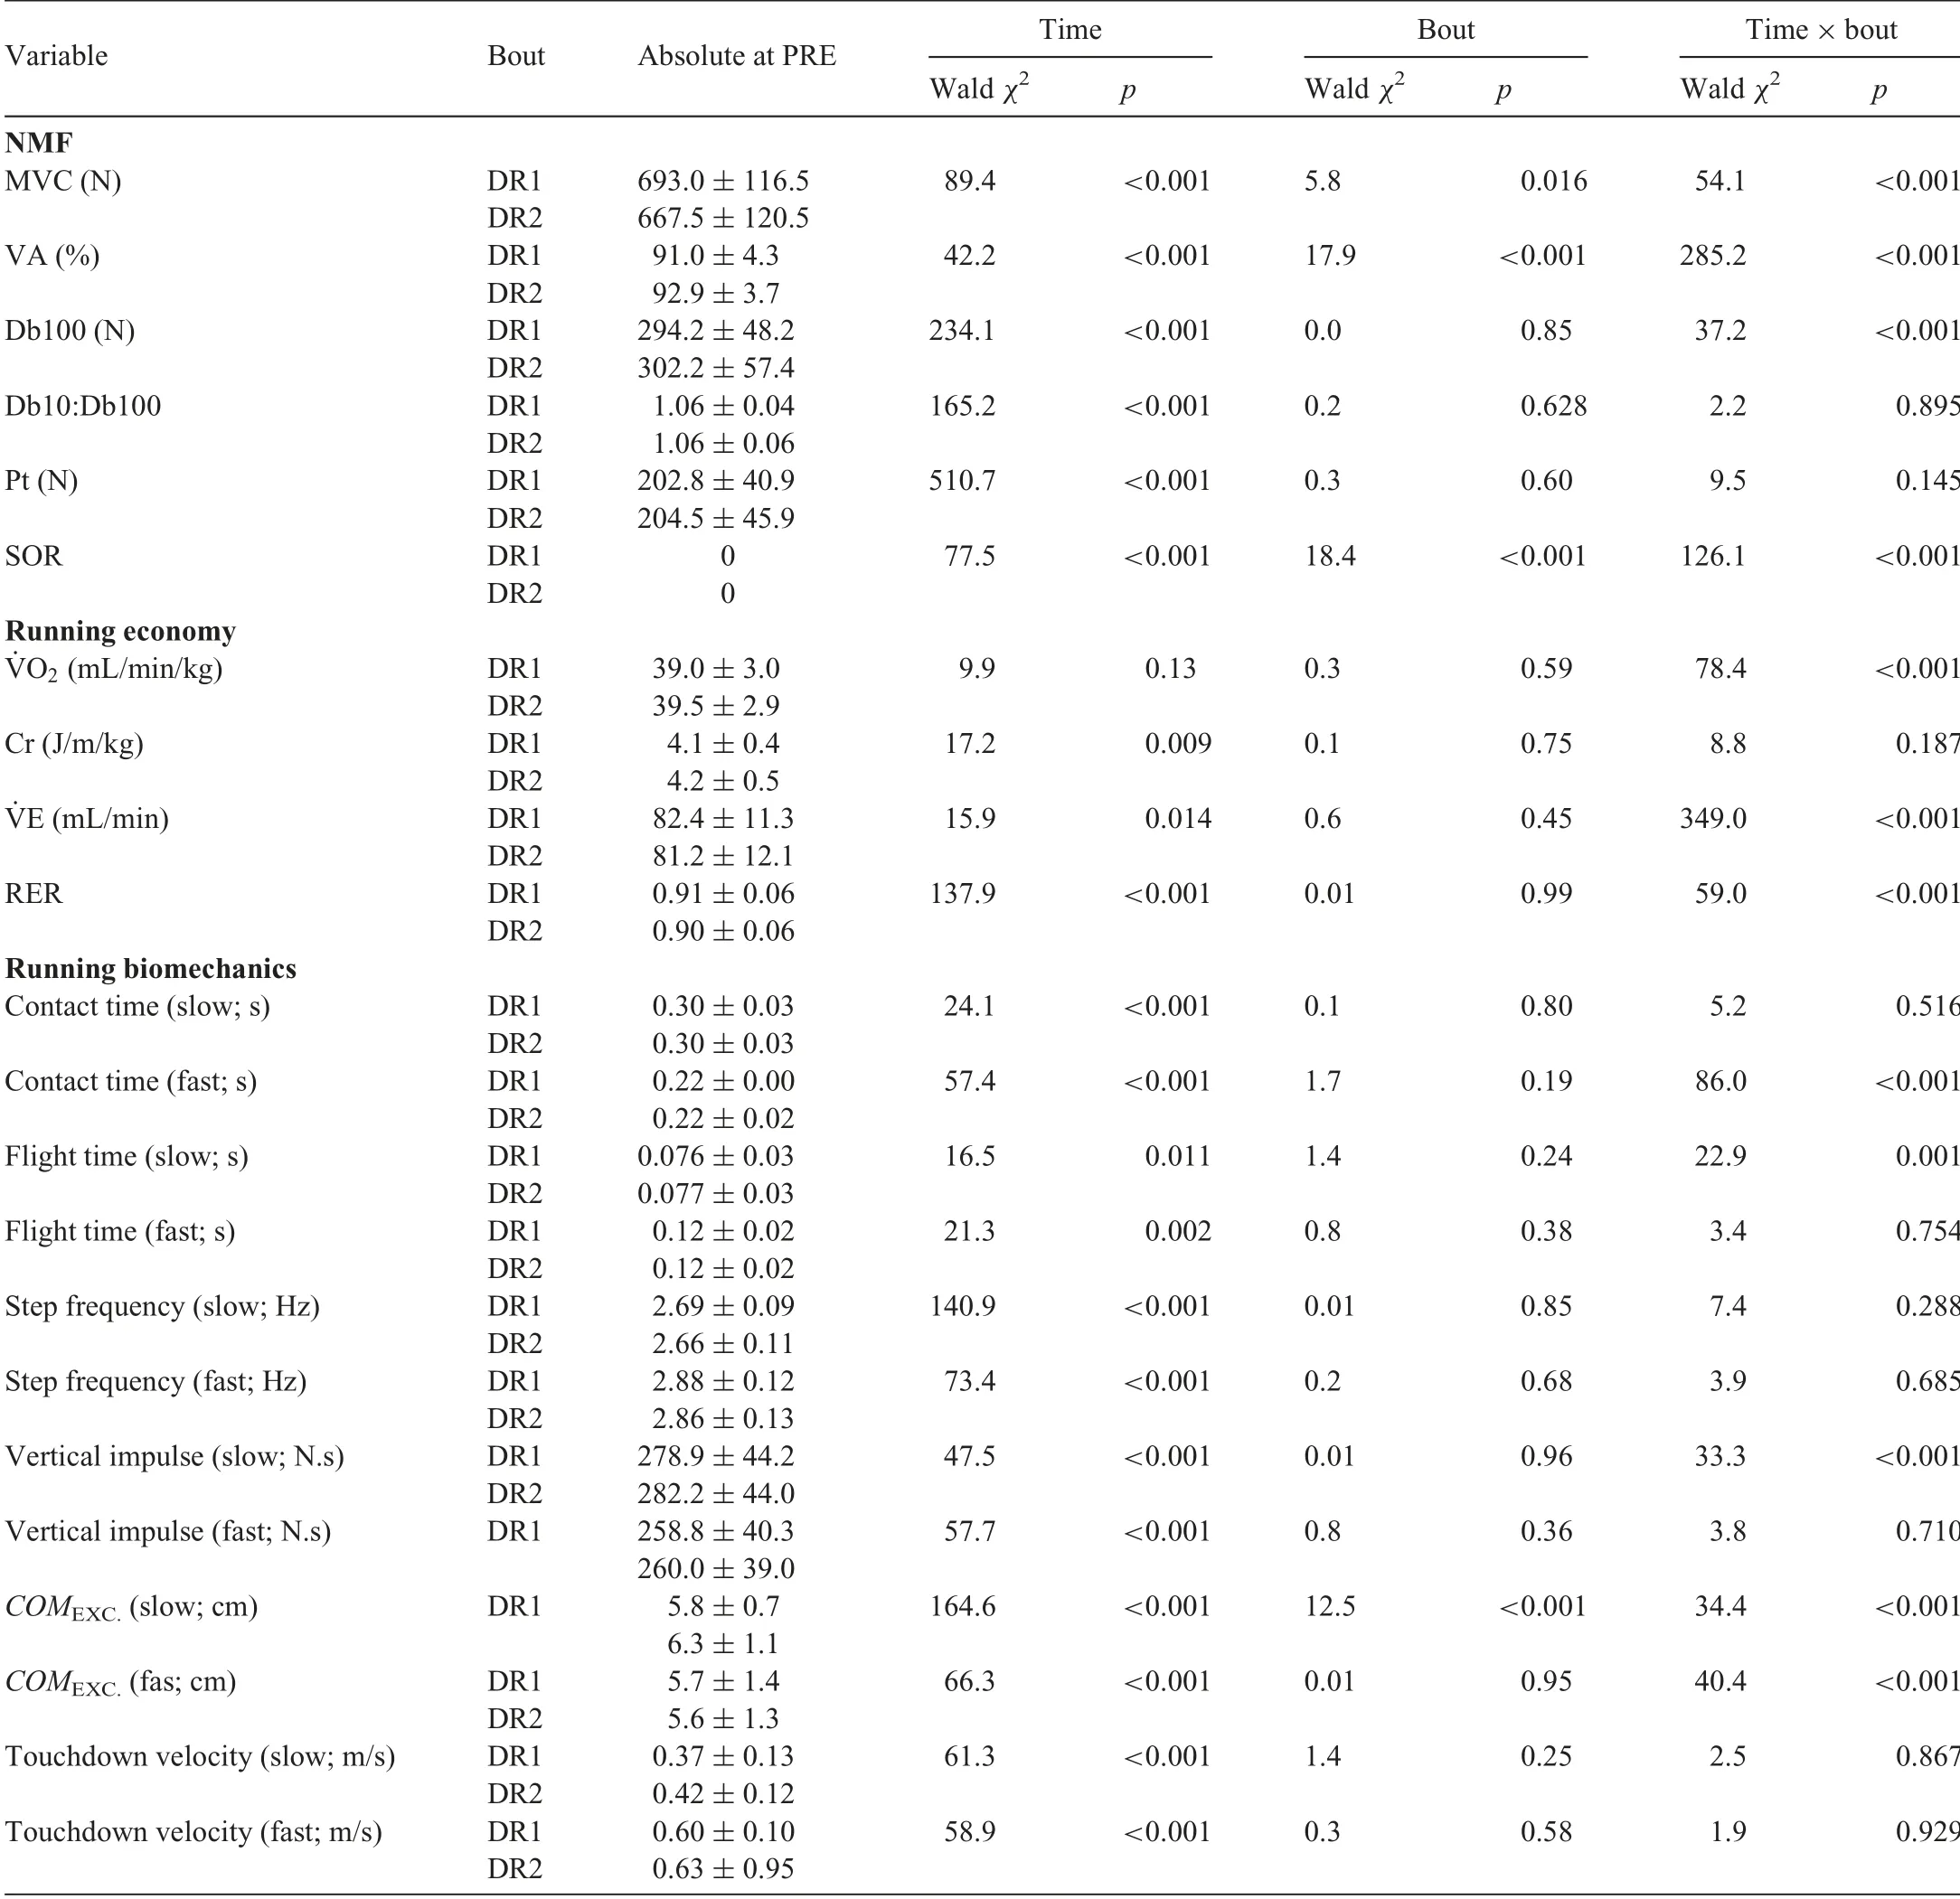
Table 1
Baseline values(PRE downhill run),Wald χ2,and p value for the NMF,running economy,and running biomechanics variables.
A significant bout×time interaction (χ2(6)=34.4, p <0.001) was observed for center of mass excursion at slow speed (Fig.4E) (Table 1).On average, this variable did not change after DR1 (all p >0.055), whereas it was reduced by 10.4% (p=0.001) after DR2 at POST24.The change in this variable, when compared to PRE, was larger for DR2 than DR1 at all measurement points(all p <0.046)with the exception of POST72(p=0.099).A significant bout×time interaction(χ2(6)=40.4,p <0.001)was observed for center of massexcursion at fast speed (Fig.4E) (Table 1).After DR1, this variable reduced by 9.2%(p <0.001)at POST24 and returned to baseline at POST96.After DR2, this variable reduced by 6.9% (p=0.007) at POST24 and returned to baseline at POST72.Furthermore,only at POST24 was the change in center of mass excursion higher for DR1 than DR2(p=0.039).
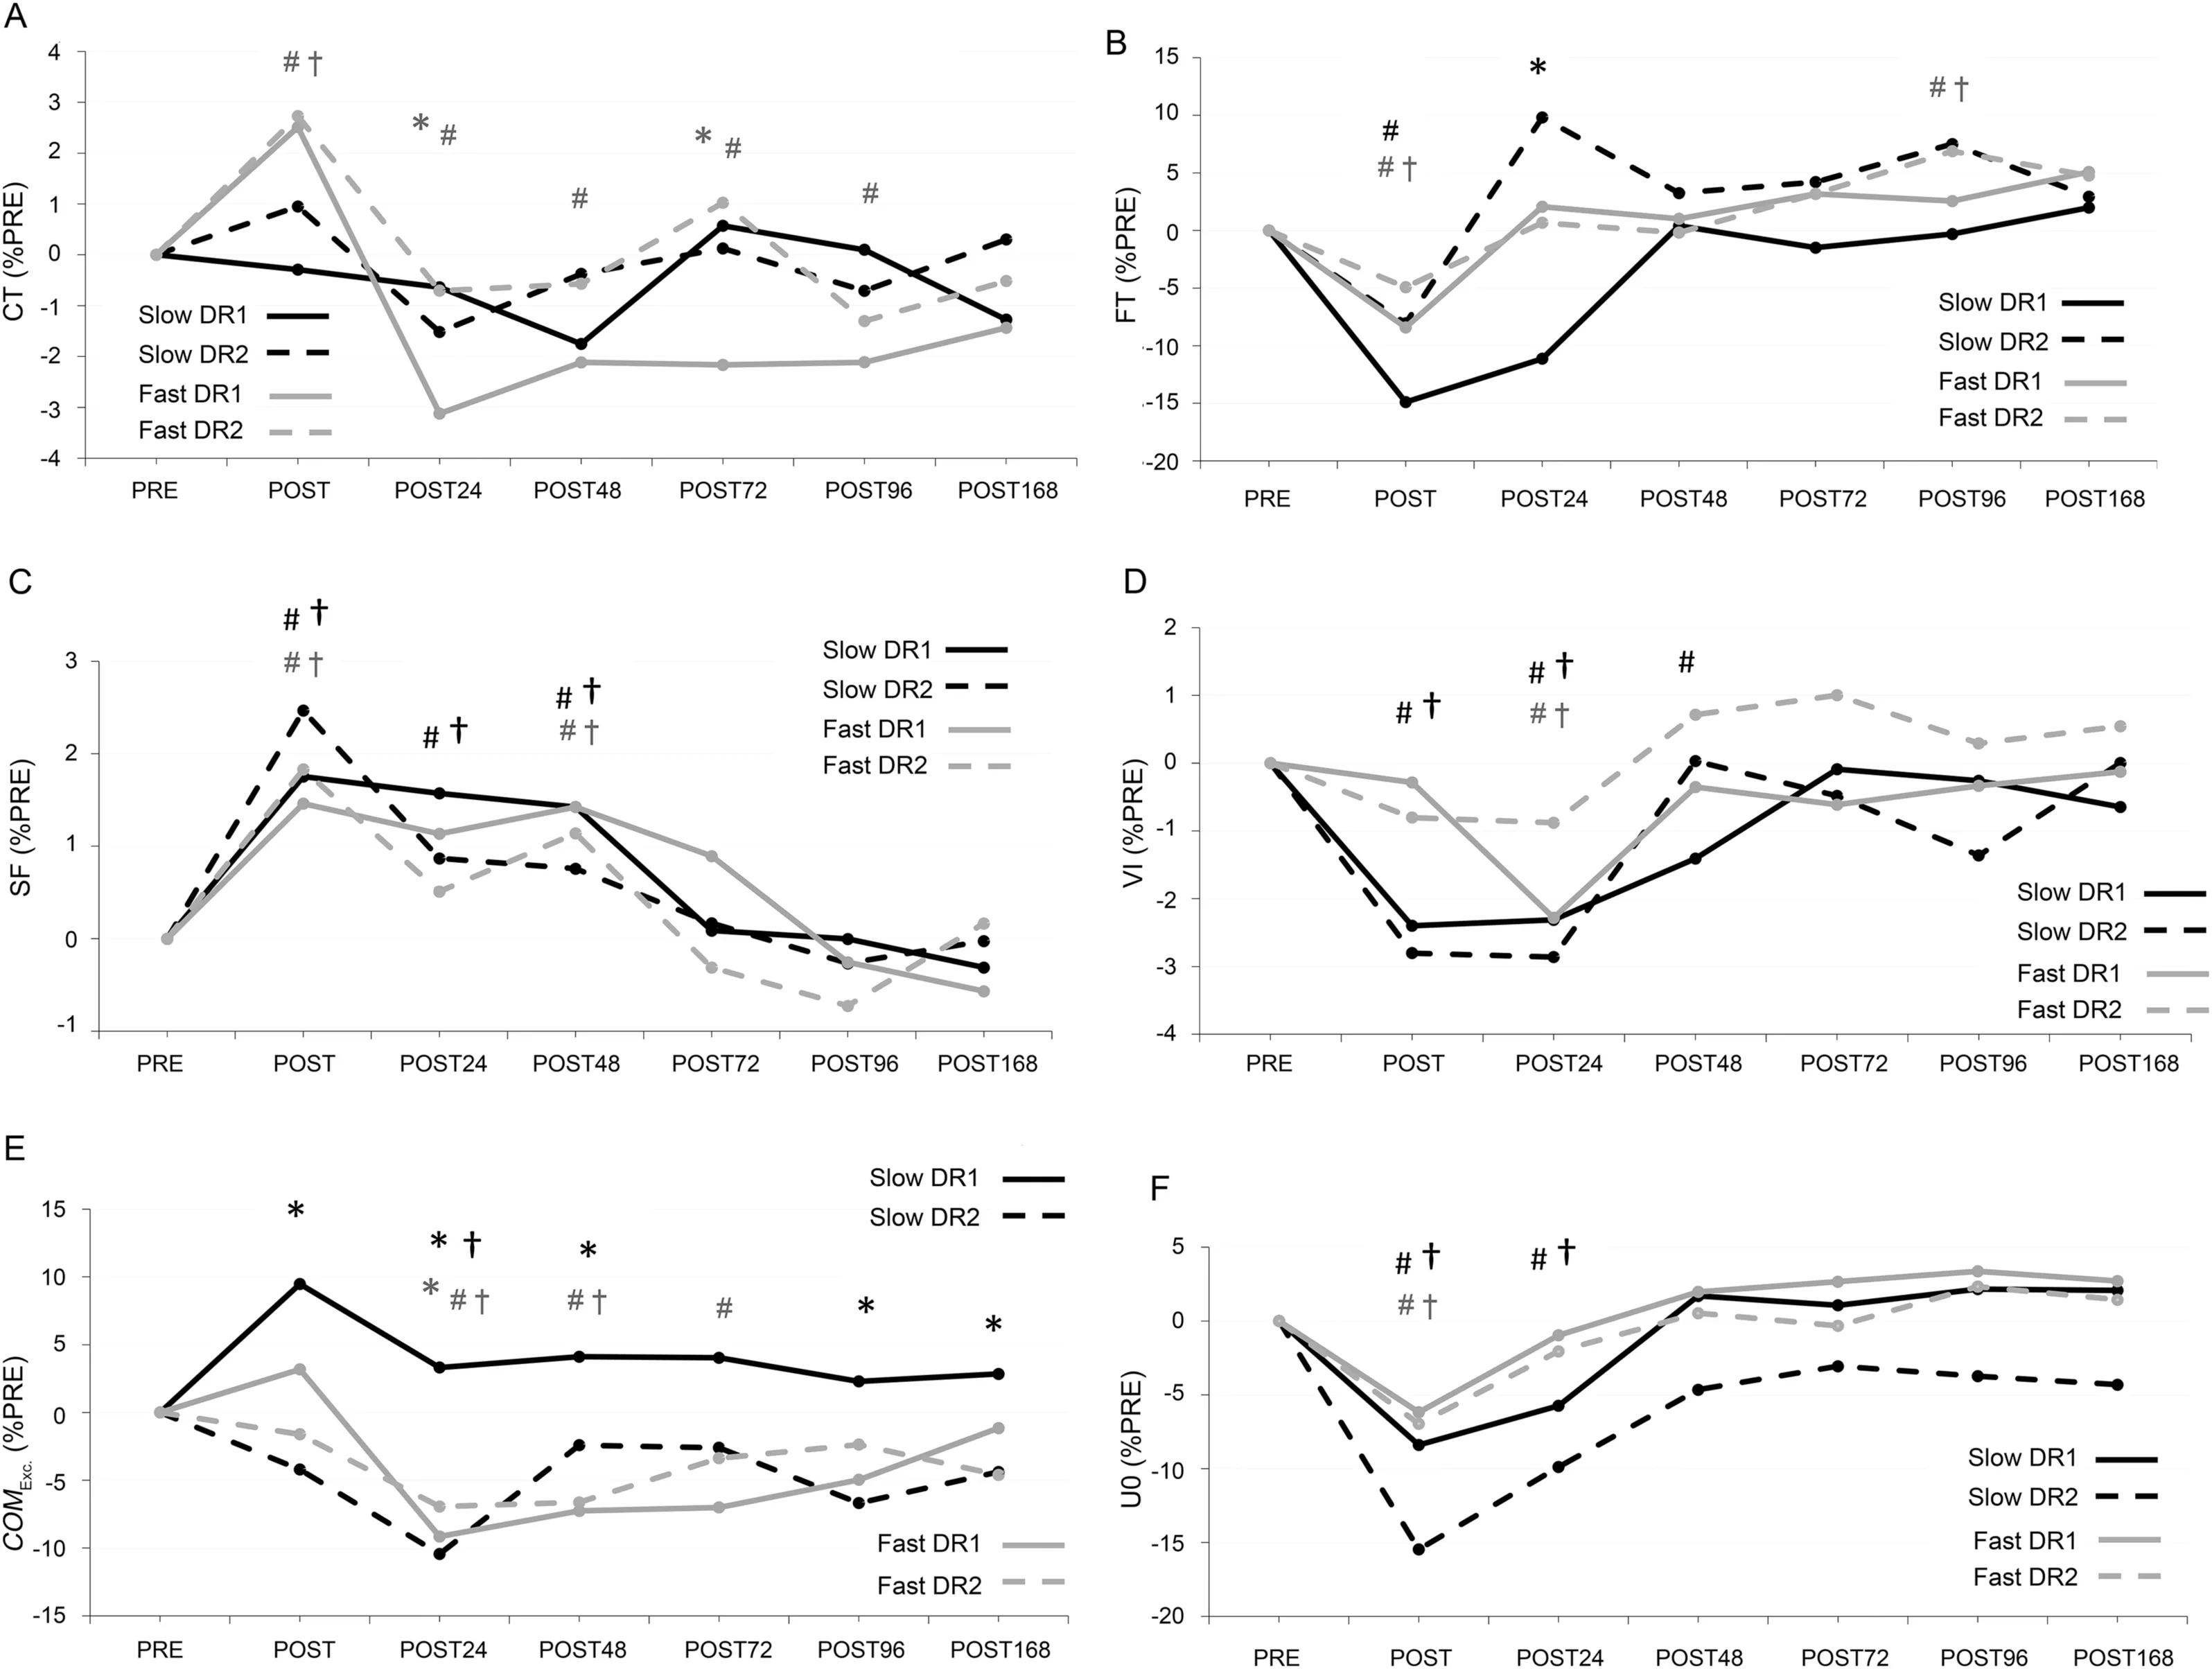
Fig.4.Mean values of percent changes in biomechanical parameters:(A)CT;(B)FT;(C)SF;(D)VI;(E)COMEXC.;and(F)U0 normalized to PRE.For clarity,standard deviations were not presented.Solid lines (DR1) and dashed lines (DR2).Slow running (2.5 m/s) results are in black lines and fast running (3.9 m/s)results are in gray lines in all panels.*p <0.05,significant difference between bouts; #p <0.05,significant difference from PRE in DR1; †p <0.05,significant difference from PRE in DR2.Black markers denote significance in slow running,and gray markers denote significance in fast running.COMEXC.=center of mass excursion;CT=contact time;DR1=downhill running 1;DR2=downhill running 2;FT=flight time;PRE=before downhill run;SF=step frequency;U0=touchdown velocity;VI=vertical impulse.
A significant bout×time interaction was not observed for touchdown velocity at either slow or fast speeds(Table 1).A significant time effect was observed for touchdown velocity at both slow and fast speeds(Fig.4F)(Table 1).On average,touchdown velocity was reduced by 11.9%and 6.6%(all p <0.001)for slow and fast speeds at POST,respectively,and returned to baseline at POST48 for slow speed and at POST24 for fast speed.
3.4.Running economy parameters
A significant bout×time interaction (χ2(6)=78.4, p <0.001)was observed for ˙VO2(Fig.5A)(Table 1).After DR1,˙VO2at POST24 was 2.9% higher than baseline, while there was no difference compared to PRE on other days (all p >0.139)or after DR2(all p >0.378).Furthermore,the increase inO2after DR1 was 2.4% (p=0.019) higher than that after DR2 at POST48.
A significant bout×time interaction (χ2(6)=8.8,p=0.187) was not observed for Cr (Fig.5B) (Table 1).Although the time effect (χ2(6)=17.195, p=0.009) was significant for Cr,pairwise comparisons did not show any significant differences from the baseline (all p >0.146).Further metabolic variables are shown in Fig.5 and Table 1.
4.Discussion
This study investigated the effects of repeated bouts of DR on neuromuscular function and their possible translation to LR biomechanics and Cr.It was hypothesized that performing the second DR bout would result in attenuated global, peripheral,and central fatigue and SOR and, thereby, attenuated changes in running biomechanics and Cr.The presence of an RBE was confirmed by attenuated CK, force loss, and perceived soreness after DR2.An RBE was also present for select LR biomechanical variables, but, contrary to our hypothesis, this did not translate to an RBE for Cr.
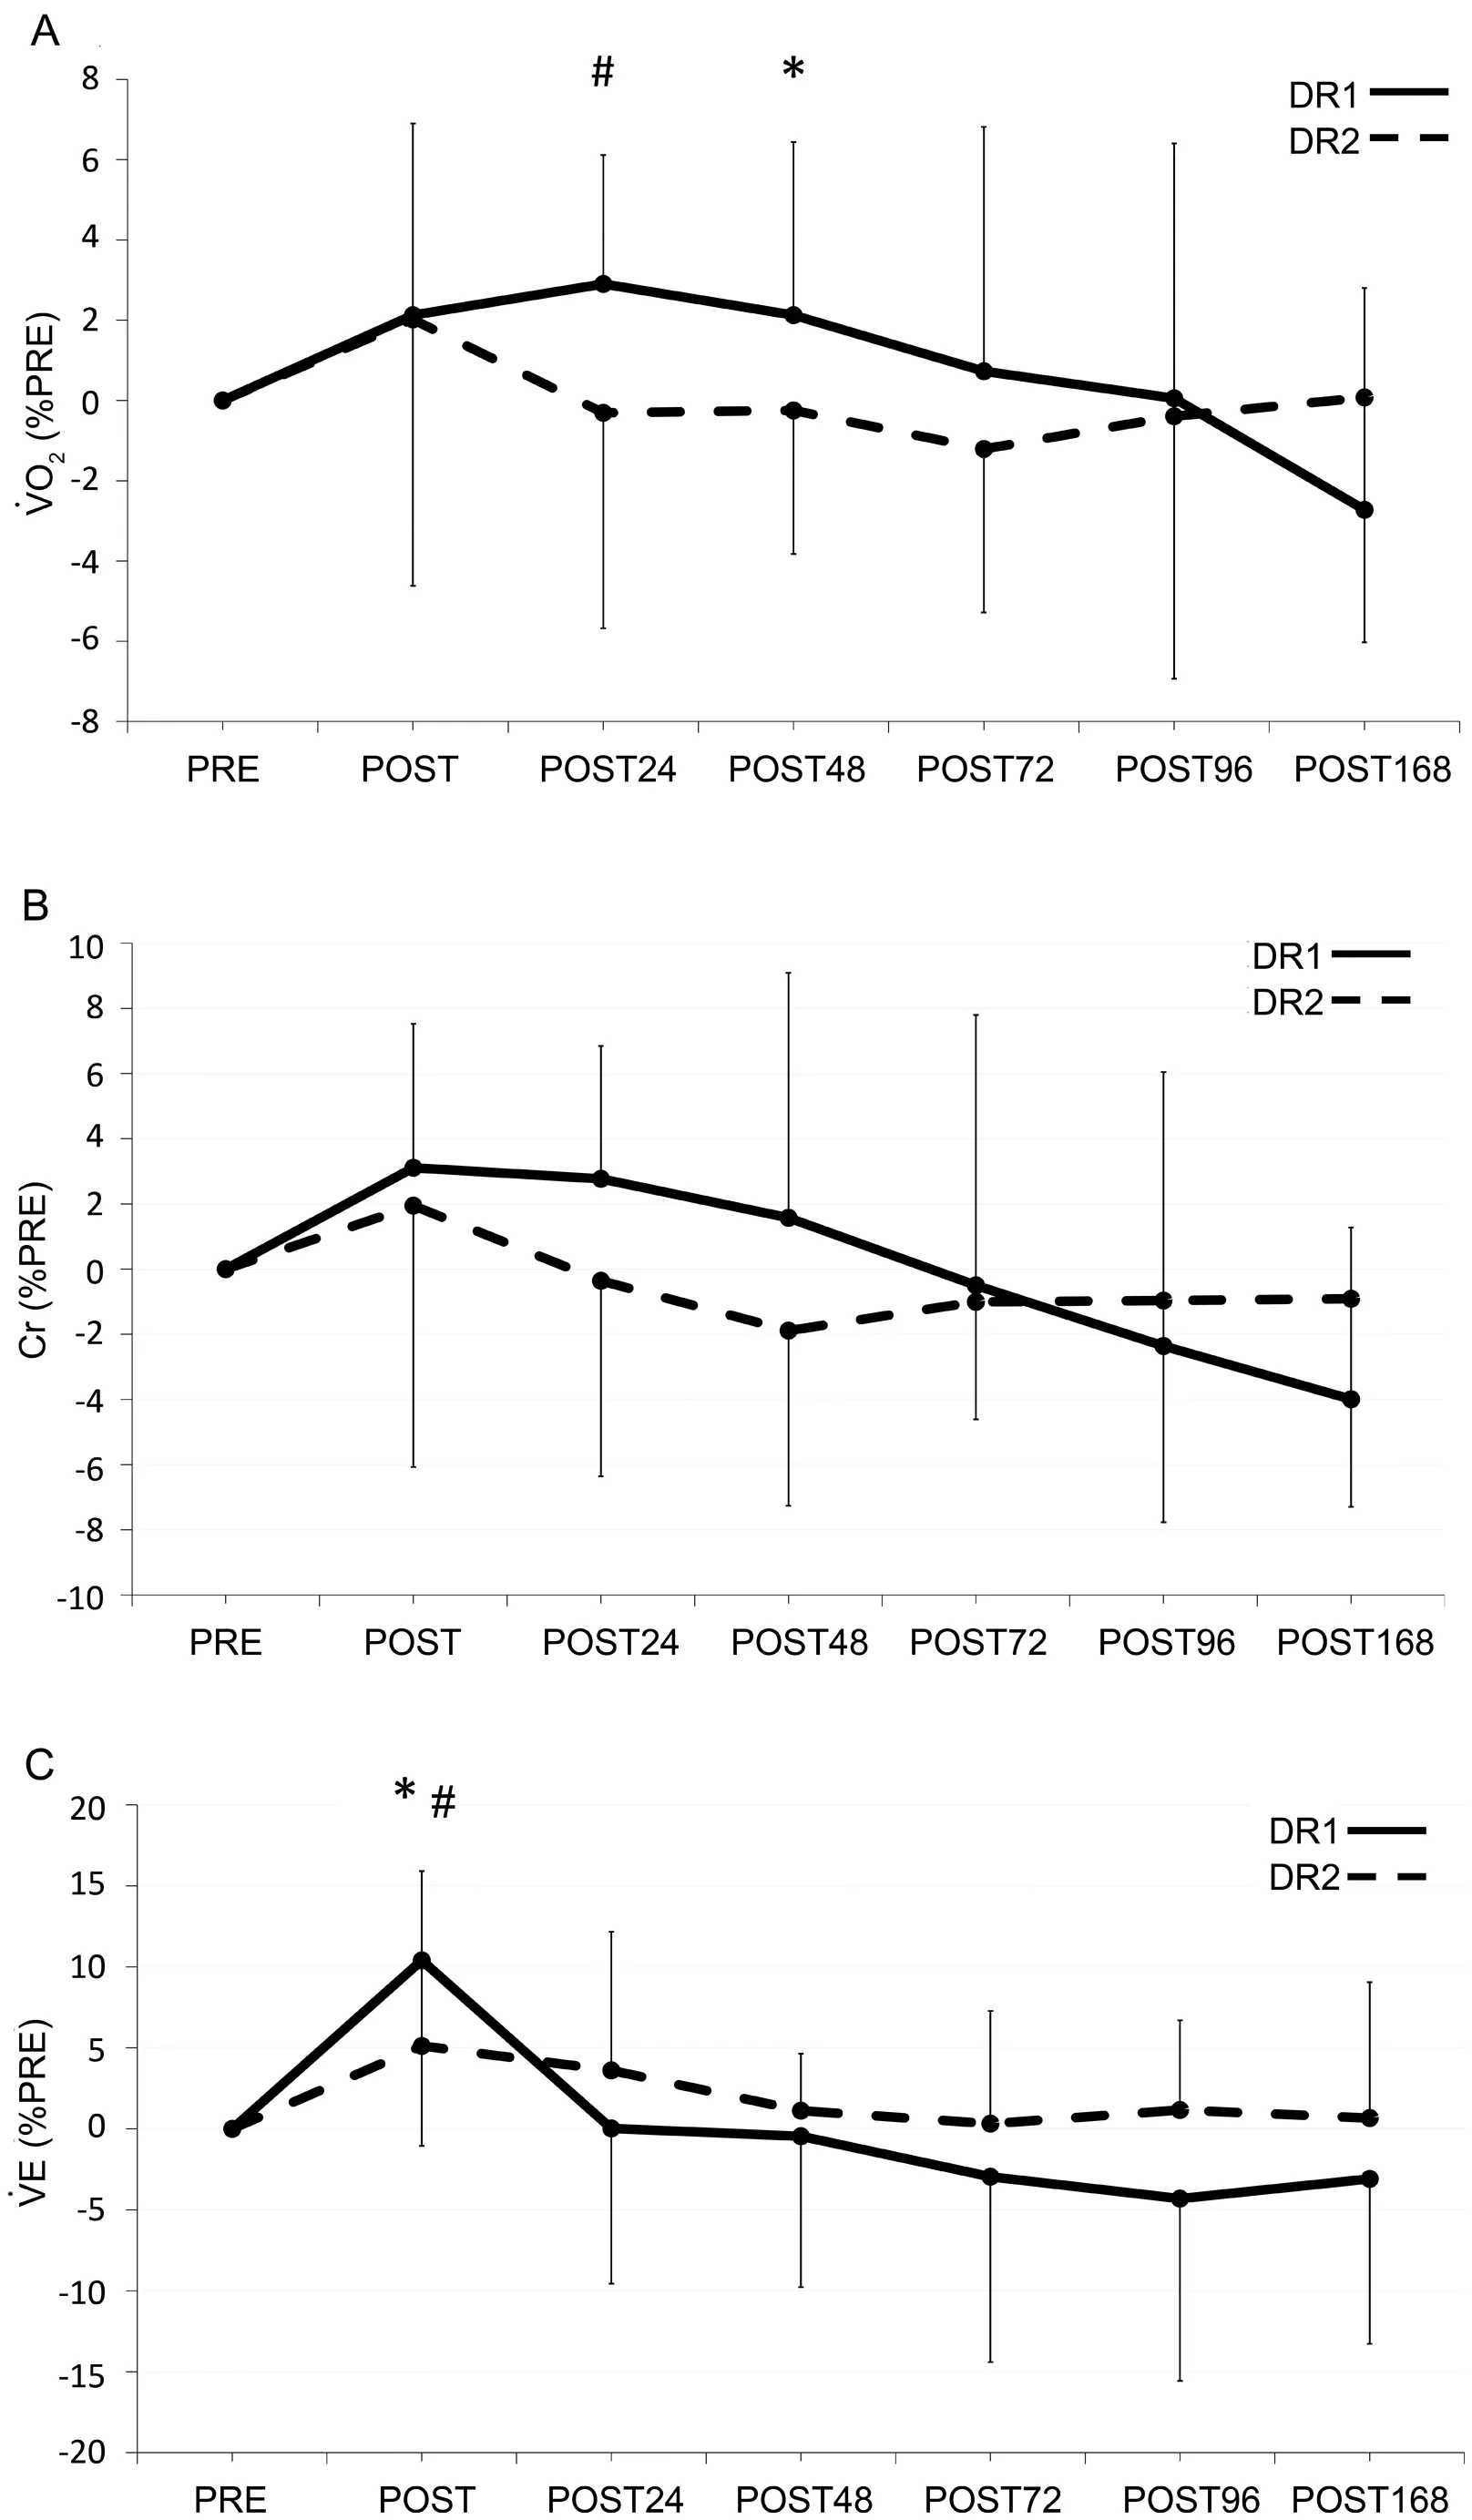
Fig.5.(A)Percent changes in ˙VO2;(B)Cr;and(C) ˙VE normalized to PRE.Values are means ± SD.*p <0.05, significant difference between bouts;# p <0.05, significant difference from PRE in DR1; † p <0.05, significant difference from PRE in DR2.Cr=cost of running;DR1=downhill running 1;DR2=downhill running 2;PRE=before downhill run; ˙VE=pulmonary ventilation; ˙VO2=oxygen consumption.
4.1.Fatigue and RBE
Immediately after DR1,there was a significant reduction in MVC, the magnitude of which (16.5%) was consistent with the literature.13,14,18,21,23This MVC force loss was partly due to peripheral fatigue, particularly low-frequency fatigue as demonstrated by a decrease in Db10:Db100.Low-frequency fatigue likely occurred due to impairments in 1 or more mechanisms involved in excitation-contraction coupling,36such as decoupling at the T-tubule-sarcoplasmic reticulum interface and/or a decreased Ca2+release from the sarcoplasmic reticulum.36Central fatigue was also present, as indicated by a decrease in VA.The deficit in central activation after DR was likely due to several yet unknown factors, such as changes in the intrinsic properties of the motoneuron pool19or disfacilitation of Ia afferents.37The observed reductions in the Db10:Db100 ratio and the VA are in line with those found in the previous literature.21,32
Immediately after DR2,MVC also decreased(8.4%);however,the magnitude of MVC force loss was lower at DR2 than DR1, which is in line with a previous study.23Conversely,Chen et al.13did not find any RBE for MVC after DR;although the time between their 2 DR sessions was only 5 days, whereas in the current study, it was 3 weeks.Possible mechanisms contributing to the RBE are increased muscle-tendon stiffness via reduced myotendinous junction displacement38and extracellular remodeling.4Increased stiffness may prevent muscle fibers from over-straining,which results in less muscle damage and less reduction in force-production capacity.38Furthermore,a recent review suggested that the strengthening of the extracellular matrix starts more than 2 days after eccentric exercise.1It may, therefore, be possible that a 5-day period was not long enough to elicit an RBE in the overall muscle strength loss.The observed RBE for MVC was accompanied only by an RBE for VA.Therefore, the results of the current study suggest that the participants were less fatigued after DR2 than after DR1.The RBE may be explained partly by a modification in voluntary drive.Possible mechanisms include: (1) decruitment of faster motor units and preferential recruitment of additional slower motor units;39(2) enhanced synchronization of motor units;39(3)attenuated level of supraspinal fatigue;2and(4)less disfacilitation of Ia afferents.37
In the present study, running biomechanics were substantially affected immediately after both DR sessions.A significant increase in step frequency and a concomitant reduction in flight time during slow running suggested a transition to a“shuffling”type of running gait.This was further confirmed by reductions in touchdown velocity and vertical impulse.Such a reduction in touchdown velocity indicates a lower kinetic energy at touchdown, which would result in lower breaking impulse and energy absorption (e.g., eccentric work).This transition may have occurred to minimize the pain and reduce the eccentric workload on already damaged knee extensor muscles.The results were somewhat similar during fast running,except that contact time also increased immediately after both DR sessions.This suggests a transition to a more“grounded running” style.An RBE was evident for MVC and VA, but most biomechanical variables did not show any RBE at POST.One explanation is that the amount of muscle force needed for submaximal running is only a fraction of the maximum capacity of the locomotor muscles.40Therefore, the reduction in maximal force may not substantially translate into changes in running biomechanics.Center of mass excursion during slow running was the only biomechanical variable that showed an RBE at POST.An increased center of mass excursion could potentially lead to an increased Cr31due to the greater mechanical work required to move vertically;however,this was not observed.˙VO2and Cr depend on numerous variables, such as muscle-tendon unit stiffness,41muscular strength,42and running biomechanics.31Running biomechanical parameters, such as leg stiffness,41step length,43and contact time44have been shown to affect ˙VO2.In general, itappears that changes in running biomechanics were not of a magnitude and/or direction to affect Cr substantially.
4.2.RBE during follow-up days
In agreement with the previous studies,12,13,16we observed an attenuated response in the primary markers of muscle damage following DR2.Specifically, CK and ratings of muscle soreness were lower, whereas the recovery of maximal forcegenerating capacity was accelerated.Furthermore, higher VA following DR2 lends support to the notion that the RBE is mediated by a neural drive adaptation.45This might be a consequence of the altered recruitment strategy during the repeated activity that reduced the magnitude of damage.2Interestingly, no RBE was observed for Db10:Db100.This is surprising because low-frequency fatigue is a prominent characteristic of exercises involving lengthening contractions of the active muscles, such as eccentric-biased DR.32Accordingly, an attenuated response for Db10:Db100 was expected following DR2, in agreement with the notion that the RBE is mediated by mechanical adaptation.45However,methodological limitations in the assessment of Db10:Db100 using paired stimulations vs.trains of stimulation can be called upon as a potential explanation.Although the 2 methods were found to be correlated after DR,46the extent of low-frequency fatigue is underestimated using paired stimulations because of a much lower release of Ca2+from the sarcoplasmic reticulum following a pair vs.a train of stimuli at high frequencies.47
Biomechanics of LR at slow and fast speeds remained altered up to 72 h after both DR1 and DR2.The paramount alteration during both slow and fast running was elevated step frequency.Increased step frequency after DR has been reported previously,13-15,48and was thought to be related to a reduction in lower extremity joint range of motion14,15and,probably, stiffer joints.Increased SOR might have caused higher discharge of Type III and IV afferents;29therefore, it can be speculated that reduction in ranges of motion may help reduce strain within the muscle and,hence,maintain SOR at a tolerable level.For example, Hamill et al.49reported a reduction in maximum knee flexion 2 and 5 days after DR and suggested that this alteration may help reduce stretching of the already damaged quadriceps muscles.However, if this deduction were true, then the effect of muscle damage on step frequency should be greater when a larger range of motion is required, such as in fast running vs.slow running.Although 1 study showed more altered step frequency in fast running vs.slow running,14our results did not demonstrate any noticeable speed effect for step frequency.The role of SOR in alterations of running biomechanics,however,cannot be ruled out by this result.Considering the complexity of the running task,altered step frequency may have been achieved by changes in other spatiotemporal variables,such as contact time or flight time.In fact, our results show different mechanisms involved in slow and fast running.Unlike slow running,elevated step frequency was accomplished in fast running by a reduction in contact time and center of mass excursion,which suggests a stiffer leg compared to baseline; these results are in line with previous observations.14,15A stiffer whole-leg implies a smaller lowerextremity joint excursion,50thus reducing the mechanical strain within the muscle-tendon units, possibly to cope with the sensation of soreness.Chen et al.13also reported an RBE on step frequency,showing that only the first DR bout resulted in elevated step frequency.However, our results indicated no RBE for this parameter.Considering the argument mentioned with respect to the relationship between SOR and LR biomechanics, it is possible that the work done by Chen et al.13and our protocol(and/or participants’fitness levels)resulted in different influences of the repeated bout on SOR and, consequently,on step frequency.
Finally,the observed differences in both neuromuscular and running biomechanics variables did not substantially translate into metabolic changes during LR.The repeated bout affected only ˙VO2at POST48,which is in line with a previous observation.13However, Cr did not show any time effect or RBE.An increased resting ˙VO2has been demonstrated following eccentric-biased exercise;27however,the change in resting ˙VO2was taken into account when assessing Cr in the present study.One explanation for the observed consistency in Cr is that the amount of damage within the first DR bout was not enough to elicit meaningful differences in Cr when compared to Chen et al.14Moreover, it is also possible that the participants optimized their running biomechanics and/or muscle recruitment to maintain Cr.Future research could use electromyography recording to help assess such speculations.
4.3.Limitations
The same constant speed was chosen for all the participants during DR.This is an intrinsic limitation to prescribing an appropriate intensity to induce damage during DR.An appropriate constant speed during DR cannot be determined solely by maximal oxygen uptake, given that DR is more mechanically demanding than aerobically demanding;this emphasizes the importance of factors such as maximal knee extensor strength and muscle-tendon unit stiffness.51Furthermore, the sample size for CK analysis was only a subset of participants.Still, despite the small sample size, the DR protocol induced great enough damage that it was statistically significant.Finally, the properties of the running surface can potentially affect running biomechanics.For example, running on grass may result in longer step lengths and contact times compared to running on a track,52which would influence leg-stiffness measurements.53In the current study, participants performed all running trials on a Bertec instrumented treadmill with an appreciably stiff surface.Considering that the treadmill surface was the same for all biomechanical measurements, we do not feel that a different surface would affect the observed differences between experimental conditions or, in turn, our interpretation of the study findings.
5.Conclusion
The results of this study suggest that the adaptation in the neural drive is an important contributor to the observed repeated bout effect in knee extensors’ MVC force lossimmediately and up to 72 h after repeated bouts of downhill running.The acute and delayed reductions in MVC and running biomechanics did not substantially translate to metabolic parameters during level running.It can be concluded that the RBE after downhill running manifests as changes to global and central fatigue parameters and running biomechanics without substantially altering the Cr.
Acknowledgments
We thank the dedicated group of participants for their time and effort.We would also like to thank Michael Baggaley,Michael Esposito,Colin Lavigne,Stacy Lobos,Dr.Rogerio N.Soares,and Dr.Saied Jalal Aboodarda for their help with data collection.
Authors’contributions
AK collected, analyzed, and interpreted the data and drafted,edited,and revised the manuscript;GV and RLK collected and interpreted the data,and drafted,edited,and revised the manuscript; WBE and GYM designed the research, interpreted the data, and edited and revised the manuscript.All authors have read and approved the final version of the manuscript,and agree with the order of presentation of the authors.
Competing interests
The authors declare that they have no competing interests.
Supplementary materials
Supplementary materials associated with this article can be found in the online version at doi:10.1016/j.jshs.2021.06.001.
 Journal of Sport and Health Science2022年3期
- Journal of Sport and Health Science的其它文章
- The secrets to running economy
- Metabolic and performance responses of male runners wearing 3 types of footwear:Nike Vaporfly 4%,Saucony Endorphin racing flats,and their own shoes
- Longitudinal bending stiffness does not affect running economy in Nike Vaporfly Shoes
- Can changes in midsole bending stiffness of shoes affect the onset of joint work redistribution during a prolonged run?
- Metabolic cost of level,uphill,and downhill running in highly cushioned shoes with carbon-fiber plates
- Systematic reduction of leg muscle activity throughout a standard assessment of running footwear