
Systematic reduction of leg muscle activity throughout a standard assessment of running footwear
2022-06-09 09:23MauriceMohrVinzenzvonTscharnerSandroNiggBennoNigg
Maurice Mohr*,Vinzenz von Tscharner,Sandro Nigg,Benno M.Nigg
a Department of Sport Science,University of Innsbruck,Innsbruck 6020,Austria
b Human Performance Laboratory,Faculty of Kinesiology,University of Calgary,Calgary,AB T2N 1N4,Canada
Abstract Purpose:This study aimed to investigate whether there is a systematic change of leg muscle activity,as quantified by surface electromyography(EMG),throughout a standard running footwear assessment protocol at a predetermined running speed. Methods:Thirty-one physically active adults(15 females and 16 males)completed 5 testing rounds consisting of overground running trials at a speed of 3.5 m/s.The level of muscle activity from 6 major leg muscles was recorded using surface EMG.The variables assessed were the EMG total intensity as a function of time and the cumulative EMG overall intensity.Systematic effects of the chronological testing round(independent variable) on the normalized EMG overall intensity(dependent variable) were examined using Friedman analysis of variates and post hoc pairwise Wilcoxon signed-rank tests(α=0.05). Results: There was a systematic reduction in overall EMG intensity for all 6 muscles over the time course of the running protocol(p <0.001)until the fourth testing round when EMG intensities reached a steady state.The one exception was the biceps femoris muscle,which showed a significant reduction of EMG intensity during the stance phase(p <0.001)but not the swing phase(p=0.16). Conclusion:While running at a predetermined speed,the neuromuscular system undergoes an adaptation process characterized by a progressive reduction in the activity level of major leg muscles.This process may represent an optimization strategy of the neuromuscular system towards a more energetically efficient running style.Future running protocols should include a familiarization period of at least 7 min or 600 strides of running at the predetermined speed.
Keywords: Muscle co-contraction;Running familiarization;Running footwear;Running shoes;Surface electromyography
1.Introduction
Every runner exhibits a unique style, even to the degree that individuals can be recognized based solely on their running kinematics.1Within each particular runner, however,the movement pattern is quite stable (i.e., it does not necessarily change when the runner is exposed to varying environmental constraints,e.g.,different footwear conditions).2This latter observation has led to the growth of the “preferred movement path(PMP)”paradigm,which suggests that a runner’s neuromuscular system tries to maintain a certain PMP under varying internal or external conditions and that this path is optimal with respect to global energy costs and/or joint loading.3The proposed mechanism for the nervous system to maintain the PMP under varying conditions is the adaptation of muscle activation patterns that occurs through adjustments to the activation timing and magnitude of muscles involved in the running movement.4,5As a consequence, when an individual runs in 2 different pairs of running shoes, the underlying muscle activation pattern may change substantially even when the kinematic pattern appears to remain the same.2,4,6
Whether and how the neuromuscular system modifies the activity of leg muscles in response to different running(footwear) conditions has been the focus of many investigations.7-16In such standard footwear assessment protocols,runners are asked to test a range of different and randomly presented running shoes in separate bouts of constant-speed running.While the majority of investigators have applied thesame experimental technique to investigate muscle activation patterns, i.e., surface electromyography (EMG), the experimental designs have varied greatly between studies.The methodological differences lie mainly in (1) the selection of examined running speeds (self-selected vs.predetermined speed(s)), (2) the running protocol (e.g., short bouts of treadmill running vs.multiple repetitions of overground running),and(3)the length of the warm-up/familiarization period(durations between 5-50 min).
When carefully selecting the above aspects of experimental design, the basic question to consider is: “Which procedures allow for testing of different experimental conditions during a situation when the runner’s muscle activation pattern has sufficiently adapted to the running environment (i.e., running speed, running surface, footwear condition, etc.) while avoiding the onset of neuromuscular fatigue?” The wide range of reported experimental procedures demonstrates that little agreement exists regarding this question.During treadmill running,the kinematic pattern has been observed to reach a steady state between approximately 6 and 8 min.17-19When forced to run at a predetermined speed,this adaptation period may represent an optimization procedure of the neuromuscular system to find the energetically optimal (i.e., preferred) combination of stride frequency and length at this speed.20However, the underlying adaptation with respect to muscle activation patterns is not well understood.Given that many different combinations of muscle forces can produce the same kinematic pattern,21the neuromuscular system may continue to optimize muscle activation parameters even after a stable movement has been established.Specifically, runners may continue to increase their efficiency at a predetermined speed by reducing unnecessary amounts of antagonistic muscle activity,i.e.,muscle co-contraction,which would lead to an overall reduction in the corresponding EMG intensity of the leg muscles involved.22-25
Wakeling and colleagues26showed that the properties of leg muscle activity, as quantified by the corresponding EMG intensity and frequency, changed systematically during a submaximal 30-min run with no prior warm-up.Although the results of this study help us to understand muscle activity adaptations to a fast-paced,sustained run,they cannot differentiate between effects of familiarization and effects of fatigue.Furthermore, most experimental protocols try to avoid fatigue by avoiding prolonged running; instead, they examine muscle activation patterns during separate running bouts for each condition of interest, with intermittent rest periods between them.8,10,12,14,15Therefore, it is necessary to characterize how leg muscle activity adapts to a standard protocol intended for the comparison of different running(footwear)conditions and to determine whether or when a steady state can be reached.
The aim of this study was to investigate whether there is a systematic change in leg muscle activity, as measured by the EMG intensity, while running at a predetermined speed over the time course of a standard footwear assessment protocol.We hypothesized that the level of muscle activity would progressively decrease for most leg muscles throughout a standard running protocol before reaching a steady state.
2.Methods
2.1.Participants
Thirty-one healthy and physically active adults(15 females and 16 males) participated in this study.Volunteers were excluded from this study if they (1) had recently (less than 3 months ago) sustained a lower extremity injury that forced them to stop exercising for at least 1 day, (2) were not physically active on a regular basis (less than twice a week),or(3)did not fit the available shoe sizes(US 7-9 for females,US 9-11 for males).All participants gave written informed consent in accordance with the University of Calgary’s Conjoint Health Research Ethics Board policy on research using human subjects.
2.2.Study design
This study investigated muscle activity quantified through surface EMG for 6 leg muscles during overground running in 5 different running shoes (Table 1).The shoe conditions represented moderate variations in midsole properties, heel-to-toe drop,pronation elements,and weight(reference27for mechanical properties of shoes).We limited the protocol to 5 conditions based on feedback from recreational runners,who reported during pilot testing that they perceived the first signs of muscular and mental fatigue (“heavy legs”) after 5 or 6 testing rounds.The order of tested shoe conditions was randomized across participants.The focus of the current study is the order effect,i.e.,the temporal change in muscle activity variables with increasing conditions during the testing protocol independent of the shoe model.Consequently, the independent variable for the primary analysis was chronological“testing round”with 5 levels(1-5).A secondary analysis was carried out to investigate anypotential systematic influence of“shoe type”on muscle activity that could interact with the temporal change.
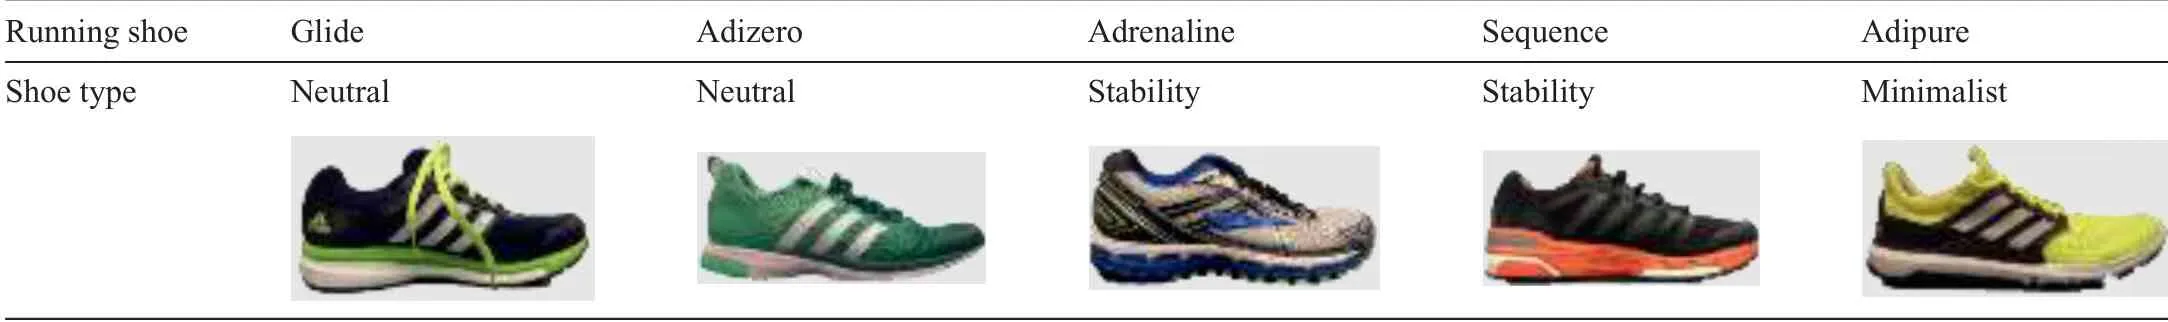
Table 1Running shoe types.
2.3.Testing protocol
The data collection was conducted on a 200-m indoor running track at the University of Calgary.After filling out an initial questionnaire related to demographics, weekly exercise routines, and injury history, participants were prepared for EMG measurements.Following the set-up, participants ran a 200-m warm-up lap on the indoor running track at a selfselected speed in order to familiarize with the equipment and running surface (W in Fig.1A).Then participants were asked to complete 5 rounds of testing (R in Fig.1A) corresponding to each of the 5 shoe conditions.Each round(except R1)began with participants switching into a new shoe and then running a 200-m familiarization lap to get used to the current shoe condition(bottom of Fig.1A).The running speed for these laps was not controlled.Next, participants completed 3 straight 60-m running trials at a predetermined speed of 3.5 m/s.The speed was controlled by 4 timing gates that were set up at 20-m marks along the track (Fig.1B).Once participants had achieved the correct running speed and completed 1 successful practice trial,the data collection was started.If any one of the 20-m splits in the 60-m trials was not within 10% of 3.5 m/s, the entire trial was repeated.In cases where there were no repeated trials (and excluding practice trials), this protocol led to a total running distance of 2100 m(1×200 m warm-up lap+(200 m familiarization lap+3 trials×60 m)×5 rounds).
The running protocol in this study was purposely designed to allow mobile data collection,avoid the need to run in a laboratory environment or on a treadmill, and still include a high number of captured running gait cycles.These protocol features were selected to mimic a more natural running environment that recreational runners would experience during everyday life and to provide a more realistic assessment of their running style.
2.4.EMG measurements
Muscle activity data were obtained via EMG from 6 major muscles of the right leg(gastrocnemius lateralis(GL),gastrocnemius medialis (GM), biceps femoris (BF), vastus lateralis(VL), vastus medialis (VM), and tibialis anterior (TA)).For each participant, the electrode locations for these 6 muscles were identified according to the guidelines for electrode placement developed by the Surface ElectroMyoGraphy for the Non-Invasive Assessment of Muscles (SENIAM) project and verified based on clinical muscle tests.28The location of the TA electrode was placed 3-4 cm more distally than recommended in the SENIAM guidelines due to spatial constraints resulting from additional inertial sensors that are not part of this analysis.After identifying the electrode locations, theparticipant’s skin was shaved,abraded,and cleaned with alcohol wipes.Bipolar Ag-AgCl EMG electrodes(10-mm diameter, 22-mm inter-electrode distance) were placed and taped onto the identified locations, including a ground electrode on the tibial tuberosity.EMG signals were recorded at 2400 Hz with an amplification factor of 1000 (Biovision, Wehrheim,Germany) and band-pass filtered (10-500 Hz) via a 12-bit analog-to-digital converter(National Instruments,Austin,TX,USA).In addition to EMG electrodes, a synchronized 1D-accelerometer (Biometrics Ltd., Newport, UK) was taped to the heel of each tested shoe for the identification of heel strike (HS) during data analysis.Mobile EMG data collection was enabled by connecting the A/D converter to a small tablet that the participant carried inside of a lightweight backpack.
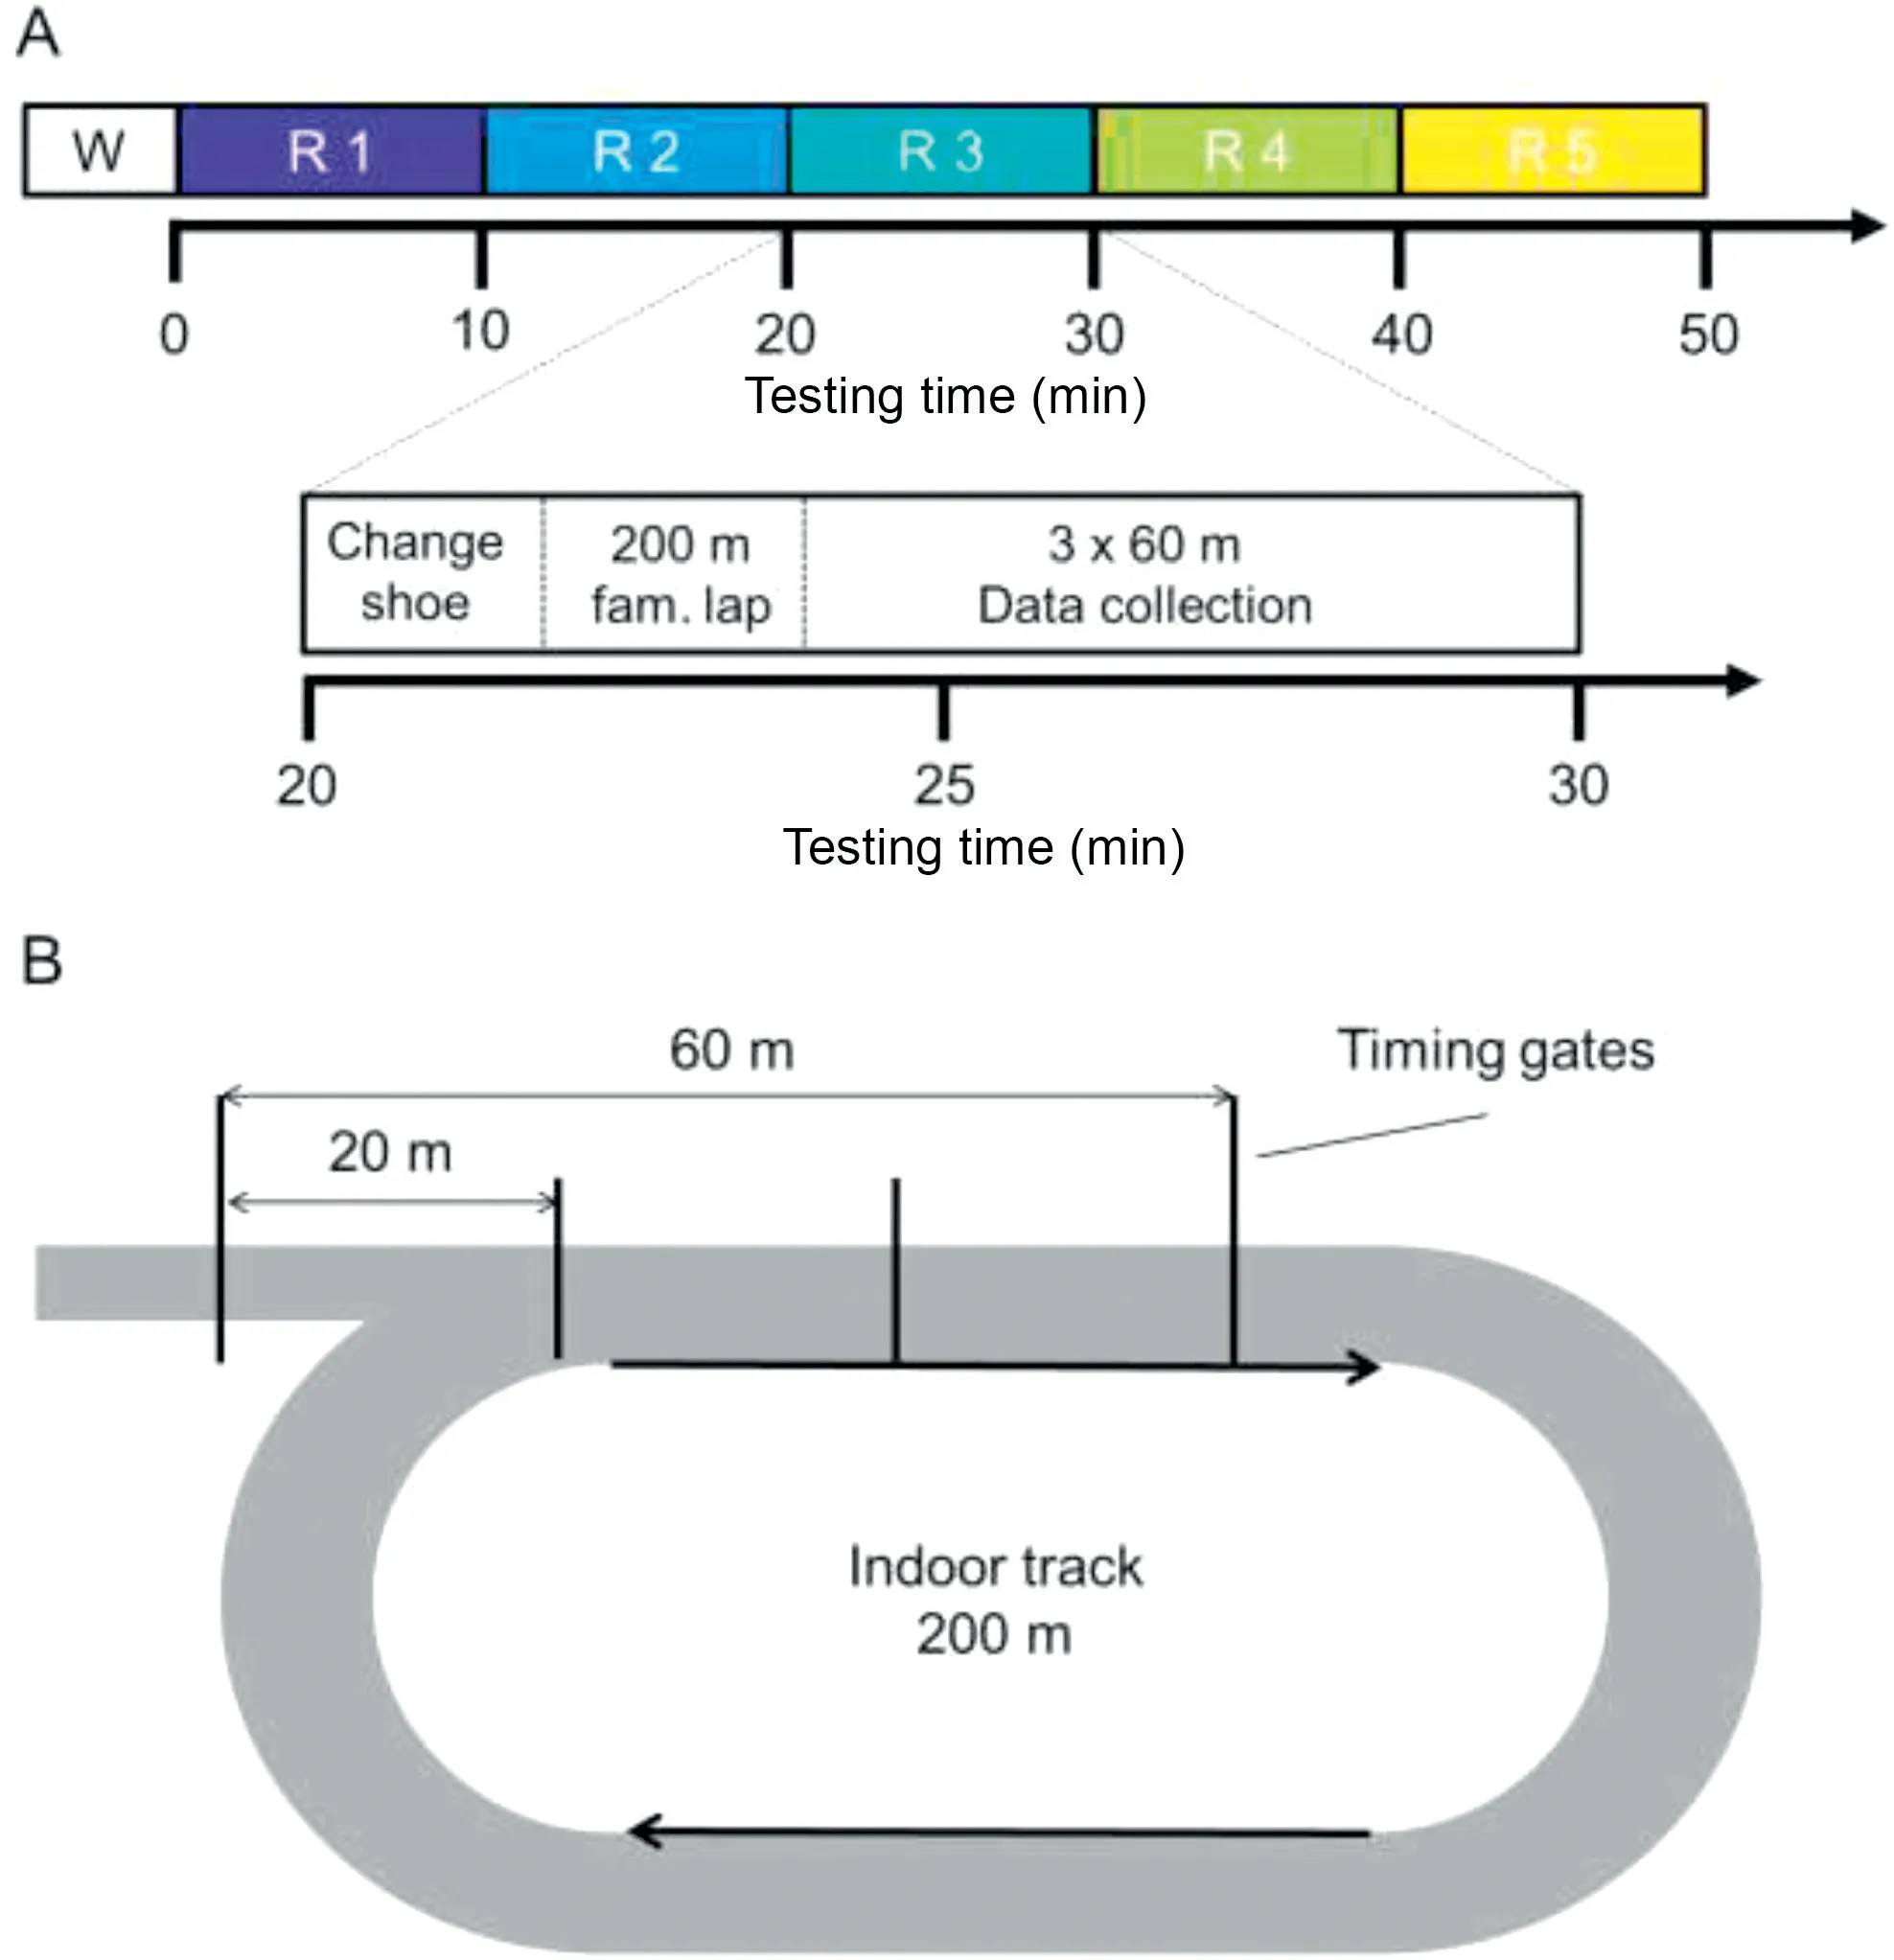
Fig.1.(A) Testing protocol and (B) experimental set-up.The bottom of A shows an expanded view to illustrate the exact components of each testing round.fam.=familiarization;R=round of testing;W=warm-up.
2.5.Data analysis
EMG analysis was performed using custom-written software (MATLAB R2016a; Natick; MA, USA).For each running trial, 15 HS were identified according to peaks in the accelerometer data,27yielding for analysis 45 gait cycles per testing round and participant.The first 3 HS were discarded to ensure that only constant-speed running was analyzed.The 2 main outcome variables for the current analysis were the EMG total intensity and the EMG overall intensity(EMG OI),which were determined as follows:EMG signals were resolved using a wavelet approach.The wavelet analysis, which resolves the power of the EMG signal in time and frequency, was performed using 13 non-linearly scaled wavelets with center frequencies ranging from 6.9 Hz to 542.0 Hz.29The square root of the power resolved by the wavelets was called the intensity of the EMG.The sum of the intensities of wavelets 3-11 yielded the EMG total intensity (EMG TI), which is an approximation of the EMG root mean square and represents the activity of a muscle over time.Lower and higher frequency wavelets were excluded from the analysis in an effort to reject signal power originating primarily from motion artifacts and high-frequency noise.Within the time window of 250 ms pre-HS to 250 ms post-HS,the EMG TI waveforms were averaged across 45 running strides, yielding a mean EMG TI for each muscle, testing round, and participant.The sum of the EMG TI over a certain time interval of the running stride was called the EMG OI,a cumulative index of muscle activity per stride.The time intervals before and after HS were selected for all muscles individually so as to reflect their respective main activity bursts during the gait cycle (transparent boxes in Fig.2).For the TA and BF muscles we determined the EMG OI separately for a pre-HS and post-HS window representing the individual activity bursts of these muscles before and after HS, respectively.The GL, GM, VL, and VM muscles only show a single activation burst around the time of HS during running and were thus not suitable for a separate analysis.
To enable comparisons of EMG intensities between participants and muscles, we amplitude-normalized the mean EMG TI waveforms and the corresponding EMG OI values for each testing round to 1 normalization factor per muscle andparticipant.The factor was determined as the average EMG OI across all 5 testing rounds.If a given muscle shows a similar level of muscle activation across all testing rounds, the corresponding normalized EMG OIs will be close to 100% (i.e.,similar to the mean).Conversely,if testing rounds significantly affect the level of muscle activation, some rounds will show values higher or lower than 100%.
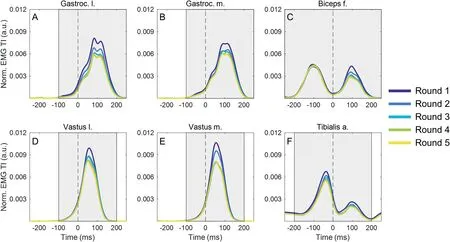
Fig.2.Average (n=31), normalized EMG TI as a function of time for the 6 investigated muscles (A) gastrocnemius lateralis, (B) gastrocnemius medialis, (C)biceps femoris,(D)vastus lateralis,(E)vastus medialis,and(F)tibialis anterior and for a window from 250 ms before to 250 ms after heel strike(time=0 ms,dashed vertical line).The color-coding of lines indicate the testing rounds from Round 1(dark blue)to Round 5(yellow).The transparent boxes illustrate the time windows for calculating the EMG overall intensity for each muscle.a.=anterior;a.u.=arbitrary unit;EMG=electromyography;f.=femoris;Gastroc.=gastrocnemius;l.=lateralis;m.=medialis;Norm.=normalized;TI=total intensity.
In addition to the EMG analysis, the average stride frequency(1/time in between 2 consecutive HS)was determined per testing round and participant as a spatio-temporal variable to characterize the overall gait pattern.
2.6.Statistical analysis
Descriptive statistics included medians and interquartile ranges of the normalized EMG OIs and stride frequencies across participants for each muscle and testing round.Further, we determined the median percentage change in normalized EMG OIs between all(i.e.,10)possible pairwise comparisons with respect to 5 testing rounds or 5 shoe types across partici pants for each muscle.The primary goal of the inferential sta tistical analysis was to investigate whether there were systematic differences in the normalized EMG OIs(dependent variable) across testing Rounds 1-5 (independent variable). Shapiro-Wilk tests indicated that the normalized EMG OIs were not normally distributed for the majority of muscle-testing round combinations, precluding a parametric analysis.There fore, we performed separate Friedman analyses of variance (ANOVA)by ranks for each investigated muscle/time window (GL,GM,VL,VM,BF-pre,BF-post,TA-pre,TA-post)to test the null hypothesis that the distributions of normalized EMG OIs were identical across testing rounds.If muscles showed a statistically significant main effect of“testing round”,we per formed post hoc pairwise comparisons between individual test ing rounds using Wilcoxon signed-rank tests and then adjusted the p values using a Bonferroni correction.30Effect sizes (r) were determined from the z-statistic of the Wilcoxon tests and interpreted according to the following intervals: negligible effect if r <0.1,small effect if 0.1 ≤r <0.3,moderate effect if 0.3 ≤r <0.5,and large effect if r ≥0.5.31The same proce dure was applied to the stride frequencies.In addition,we car ried out a secondary analysis to investigate whether there were systematic differences in the normalized EMG OIs(dependent variable) across shoe types (5 levels, independent variable). The secondary analysis followed the same procedure as the primary analysis.All statistical procedures were carried out in IBM SPSS Statistics for Windows (Version 25.0; IBM Corp., Armonk, NY, USA) at an a priori significance level of α=0.05.
3.Results
3.1.Participant characteristics
Fifteen females(age:23.1±2.6 years;height:169±5 cm;body mass:60±5 kg;mean±SD)and 16 males(age:27.0±3.2 years; height: 177 ± 9 cm; body mass: 73 ± 9 kg)participated in this study.With respect to physical activity routines,19%of the participants ran 3 or more times per week while 58%ran once or twice per week.The remaining 23%of participants were involved in other types of physical activity at least twice a week.
3.2.EMG TI
Fig.2 shows the normalized, average EMG TIs for the 6 investigated muscles and testing rounds as a function of time during running.The color coding reveals that there was a systematic effect of the testing round on the muscle activation profiles of all muscles.Generally,the EMG TIs were highest in the first and second testing rounds; and between the last 2 rounds,the EMG TI waveforms show no visible difference.Of note is the fact that the first activation burst of the BF during the swing phase does not appear to be affected by the testing round,while the second activity burst of the same muscle during the stance phase clearly shows a reduction in EMG TI with increasing testing rounds(Fig.2C).However,this effect was not seen for the TA, which also has 2 distinct activation bursts, one before and one after HS(Fig.2F).
3.3.EMG OI
These observations were supported by the statistical analysis of the normalized EMG OIs displayed in Fig.3 and summarized in Supplementary Table 1.The Friedman ANOVAs indicated a systematic effect of testing round on the distributions of the normalized EMG OIs for all muscles/time windows (p <0.001;Figs.3A-D and F-H) except BF during the pre-HS phase(p=0.163;Fig.3E).For all muscles/time windows that showed a main effect, the EMG OIs demonstrated a significant reduction from the first to the second testing round (p <0.02, moderate/strong effects),the third testing round(p <0.02 moderate/strong effects),the fourth testing round(p <0.02,moderate and strong effects), and the fifth testing round (p <0.005, moderate and strong effects).When comparing the fifth and first testing rounds for these muscles/time windows (i.e., the beginning and end of the running protocol), we observed a percentage reduction in EMG OIs between a minimum of 25 % (GM, VL) and a maximum of 50 % (GL).In contrast, none of the muscles/time windows showed a significant difference in EMG OIs between the fourth and the fifth rounds(p >0.05,with effect sizes(r)between 0.01 (BF-post) and 0.26 (VL) indicating negligible and small effects).Whether the normalized EMG OIs of testing Rounds 1,2,3,and 4 differed from one to the other was muscle dependent(see symbols in Fig.3).
In contrast to the large effect of the chronological testing rounds, there were few statistically significant effects of shoe type on the EMG OIs.The Friedman ANOVAs indicated that only VL (p=0.045) and BF during the post-HS phase(p=0.02) showed significant, systematic differences in EMG intensities between shoes.Post hoc testing resulted in only one significant pairwise comparison, specifically between the shoes “Adrenaline” and “Glide” for the VL (p=0.014,r=0.38).The majority of comparisons showed small or negligible effects(r <0.3;Supplementary Table 1).
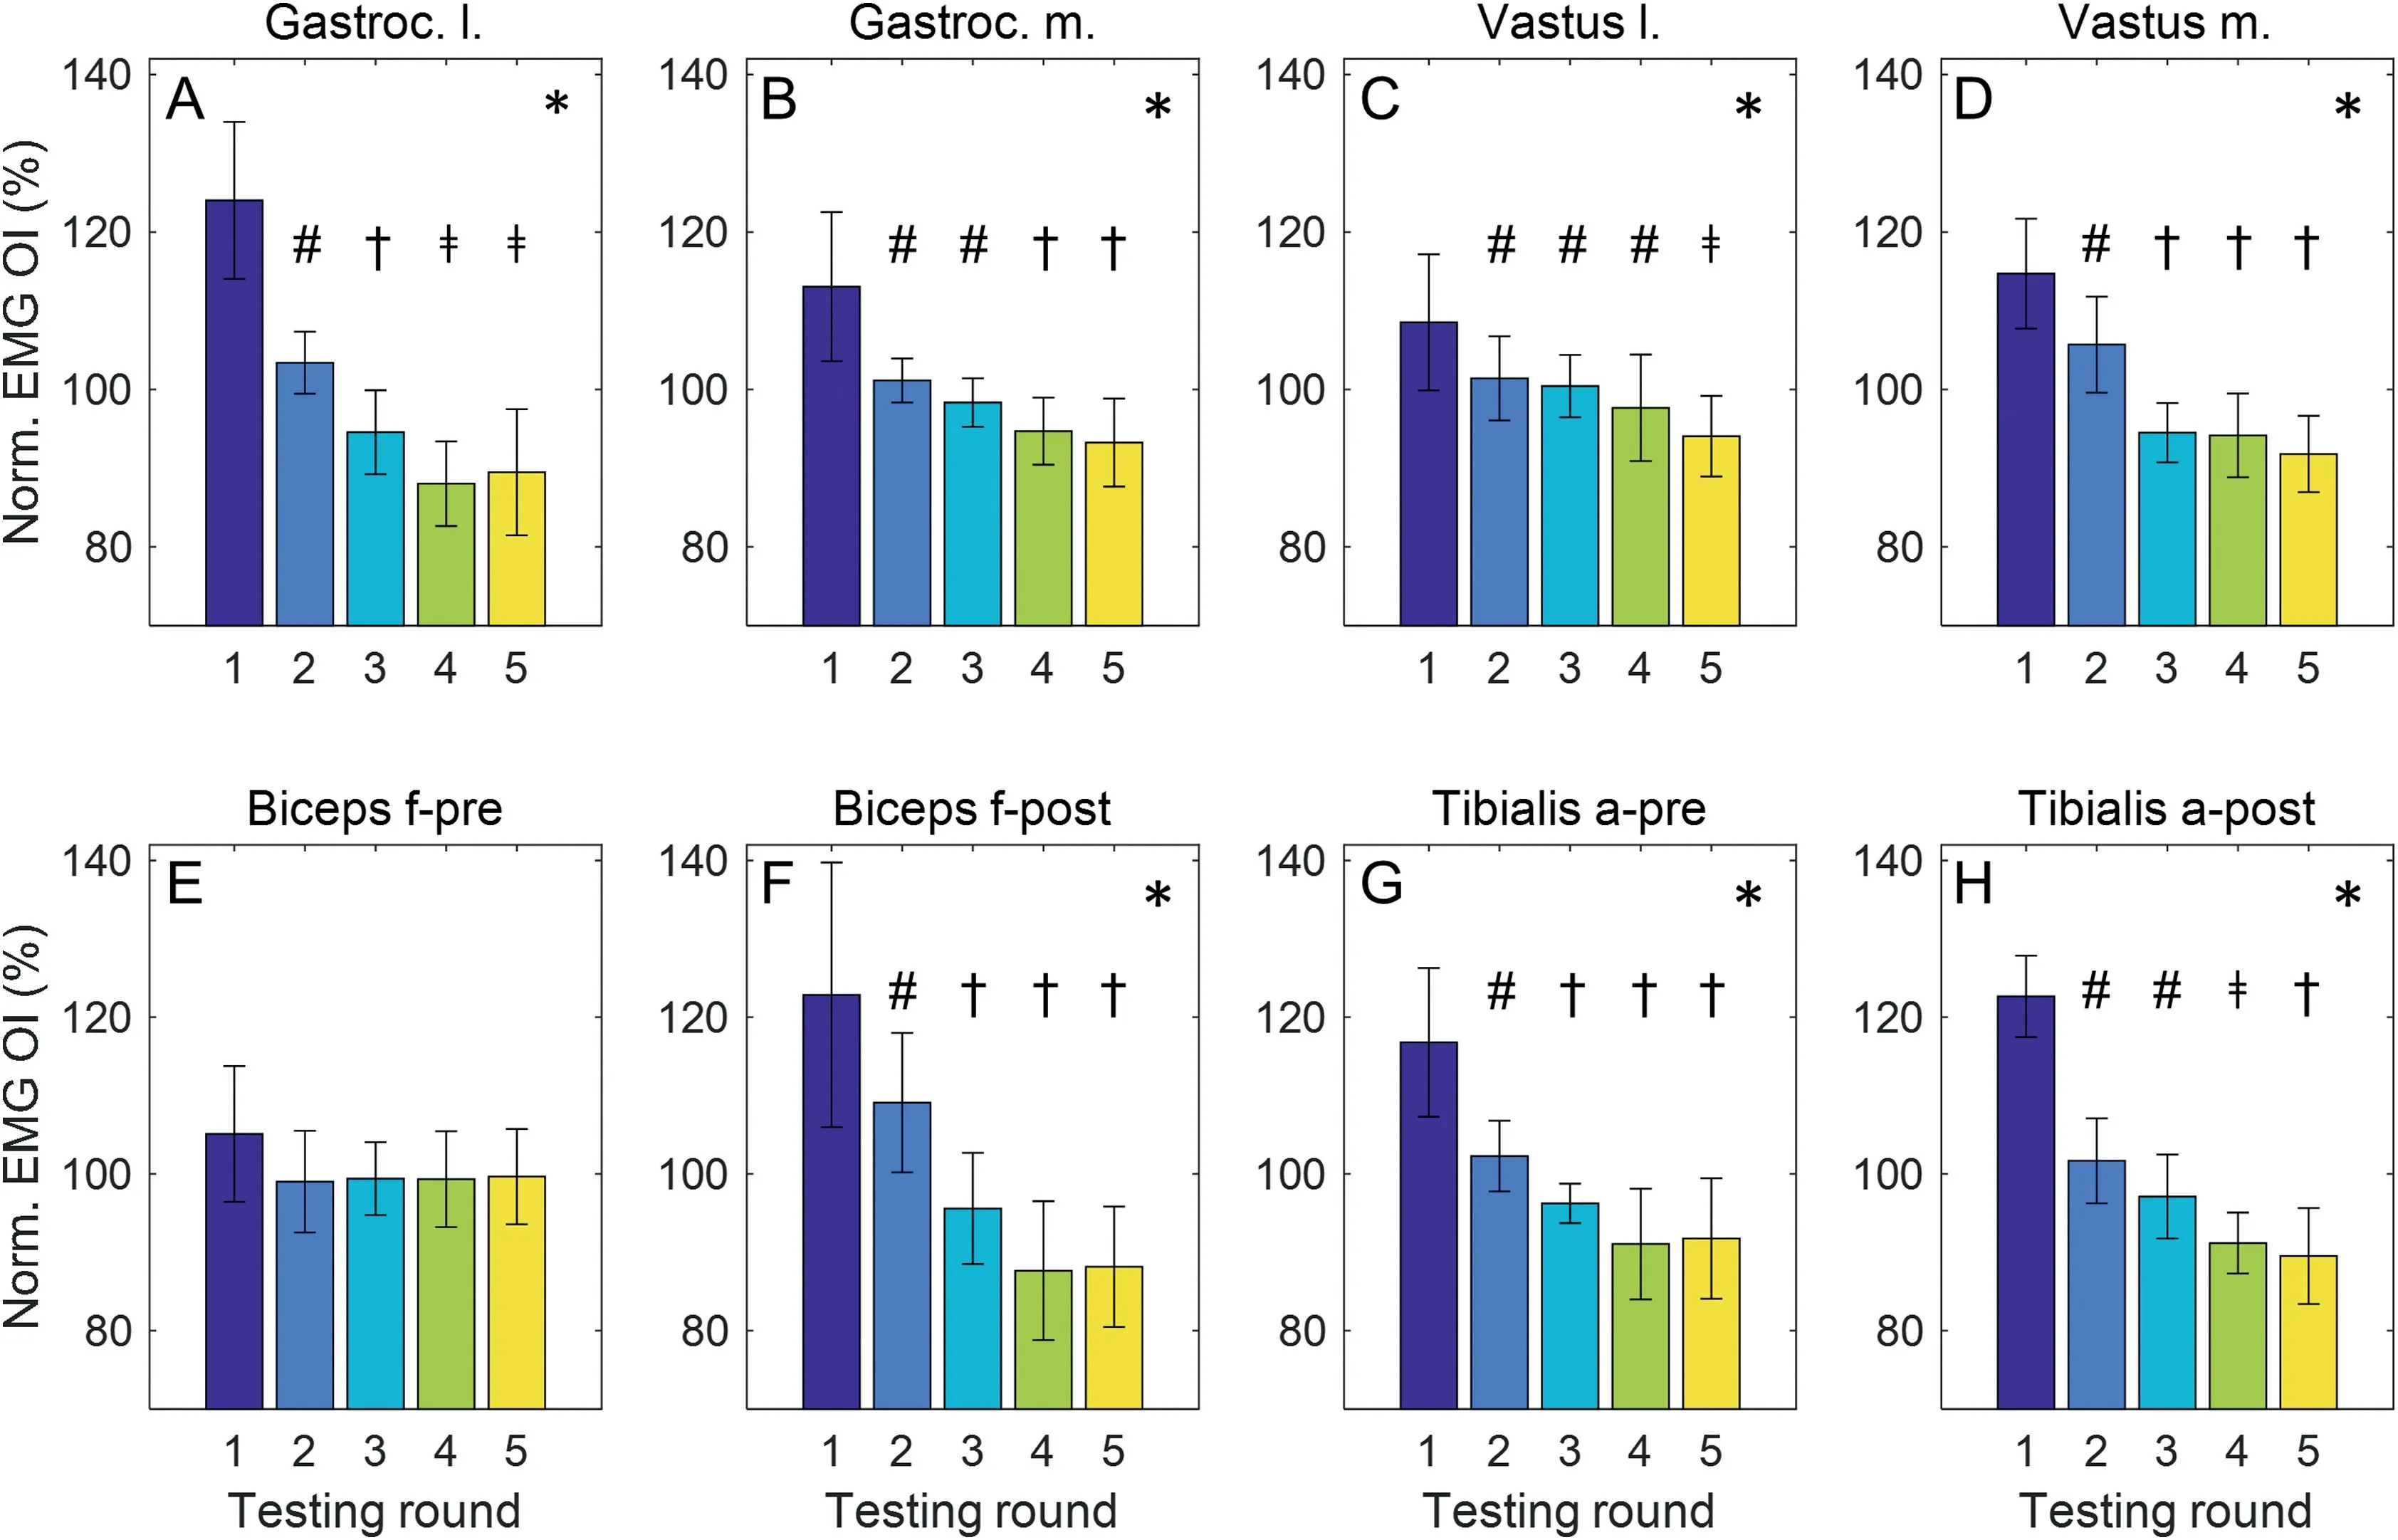
Fig.3.Normalized EMG OI(n=31;data are presented as median±0.5 × interquartile range)as a function of testing rounds for the 6 investigated muscles(A)Gastroc lateralis; (B) Gastroc medialis; (C) Vastus lateralis; (D) Vastus medialis; (E) and (F) biceps femoris; (G) and (H) tibialis anterior.Two time windows(“pre”and“post”heel strike)were investigated for biceps femoris and tibialis anterior.*significant main effect of testing round; #significant different from Round 1; †significant different from Rounds 1 and 2; ǂsignificant different from Rounds 1,2,and 3.a.=anterior;EMG=electromyography;f.=femoris;Gastroc.=gastrocnemius;l.=lateralis;m.=medialis;Nom.=normalized;OI=overall intensity.
3.4.Stride frequency
There was no significant difference in stride frequencies between the 5 testing rounds (p=0.338), with effect sizes of 0.01 <r <0.19 indicating no and small effects.The median stride frequencies (interquartile range) across participants for Rounds 1 through 5 were:1.40(0.10),1.40(0.10),1.40(0.08),1.40(0.07),1.40(0.08).
4.Discussion
The purpose of this investigation was to characterize the adaptation of the leg muscle activation pattern to an experimental running protocol typically used for comparing muscle activities between different running shoe conditions.We quantified the level of leg muscle activity by the corresponding surface EMG intensities.The significant decrease in the EMG intensities of 6 leg muscles with increasing testing rounds supports our hypothesis that leg muscle activity is progressively reduced during adaptation to the running protocol where fatigue is not considered to be a factor.Further, the lack of significant differences in EMG intensities between the second-to-last and last testing rounds supports the hypothesis that the muscle activation pattern reaches a steady state once the adaptation process has been accomplished.
4.1.Origin of EMG intensity reduction
Conceptually, there are 2 possible origins for the reduction in EMG intensities over the time course of the running protocol: (1) the neuromuscular system progressively adjusted the level of muscle activity throughout the testing rounds, for example, by adjusting the number and type of active motor units per muscle;26,32or(2)other physiological adaptations to the running protocol, for example, sweat accumulation,increased blood flow,or higher muscle temperature,influenced the EMG intensities by affecting the skin-electrode interface and/or conductivity.26,32,33If the second scenario were true,however, the systematic change in EMG intensities over time should be equal for different phases of the running gait cycle(e.g.,swing vs.stance phase).Since the BF EMG intensity was progressively reduced only for the stance phase but not the swing phase (Fig.3E vs.3F), the second scenario appears unlikely.Furthermore,lower extremity sweat rates at moderate running intensities like those in the current study have been reported at about 200 g/m2/h, which corresponds to an instantaneous sweat layer of about 0.02 mm that accumulates under a standard bipolar surface electrode after 1 h of exercise.33,34For a sweat layer of this order of magnitude, changes in the EMG intensity have been shown to be negligible and areunlikely to have had a considerable effect on the current study.33Instead,it is more likely that the systematic change of the leg muscle EMG intensities over time represents an optimization process of the motor control system as it tries to establish a more efficient muscle activation pattern for running at the predetermined speed.
4.2.Properties of muscle activity adaptation
Except for the BF during the swing phase,EMG intensities were reduced by at least 25%for all investigated muscles and by up to 45%(BF-post,Fig.3F)and 50%(GL,Fig.3A)when comparing the last to the first round.At the same time, the average running speed (predetermined at 3.5 m/s) and the stride frequency—and, therefore, the stride length—did not change systematically.If we assume a monotonic relationship between the EMG intensity and the level of muscle activity,then the leg muscles achieved a similar overall gait pattern with a significantly reduced level of muscle activity.This indicates the development of a more economical running style over time.The observation that the EMG intensities did not change significantly after the fourth testing round suggests that the adaptation of the muscle activation pattern reached a steady state,or at least slowed down significantly,after about 30 min of the running protocol.This corresponded to about 600 m of running at the predetermined speed (3 rounds of three 60 m trials plus practice and unsuccessful trials, Fig.1) plus 4 intermittent 200-m laps of running at an uncontrolled speed, for a total of about 1400 m of running.Assuming that runners completed the intermittent laps at a speed similar to the test speed of 3.5 m/s,reaching a steady state muscle activation pattern during running bouts at a predetermined speed requires a familiarization period of at least 6 min 40 s(1400 m at 3.5 m/s=400 s)or at least 560 strides(400 s at an average stride frequency of 1.40).
It is important to note,however,that slower adaptation processes may have continued for certain muscles past the fourth testing round, but that such adaptations were not detected in this study.A post hoc sensitivity analysis (G*Power; Version 3.0),35indicated that given a desired power of 0.8, a Bonferroni-corrected significance level of α=0.05/5, and n=31, our Wilcoxon signed-rank tests could detect large and moderate but not small effects.Therefore, small reductions in the level of muscle activation did not reach statistical significance, for example, for VL in the fifth testing round as compared to the fourth (p=0.2, r=0.26, small effect; Fig.3C).Further, visual analysis of Fig.3 suggests the possibility of muscle-specific adaptation profiles throughout the running protocol,with some muscles showing little to no change in intensity past Round 2(e.g., VM), while others show more gradual reductions in intensity between Rounds 2 and 5 (e.g., GM or TA-post).In order to estimate the exact decay in EMG intensity while running at a predetermined speed,and to contrast the decay function between different muscles, future investigations should continuously monitor the level of leg muscle activity during a sustained treadmill or overground run.Nevertheless, our finding that the main adaptation process related to the muscle activation pattern has finished after running for about 7 min or 600 strides is in alignment with previously recommended familiarization periods for reaching stable kinematic patterns during treadmill walking and running.17-19,36Consequently,the present results suggest that adaptation processes related to the movement pattern and to the underlying muscle activation pattern may operate on similar time scales.
4.3.The relationship between EMG intensity and motor unit activity
The assumption, made above, of a monotonic relationship between the EMG intensity and the level of muscle activity deserves further attention.The EMG intensity is a measure of the summed electrical activity of the motor units located within the pick-up volume of the EMG electrodes.37During isometric muscle contractions, a reduction in EMG intensity has been interpreted as a reduced number of active motor units and/or a reduced motor unit firing rate, both of which would correspond to a reduced muscle force.32During dynamic tasks such as running, however, the muscle forces generating the required joint torques must be produced during a short time window just before and during the ground contact phase.Consequently,all active motor units must fire approximately at the same time, that is, they appear in clusters.38Model computations have demonstrated that for a constant number of active motor units, the EMG intensity can increase or decrease substantially as motor units become more or less synchronized,respectively.38,39The authors speculate, however, that as the muscle activation pattern is optimized during familiarization to a running protocol, if anything, motor unit activity would become more instead of less synchronized.This would result in an increased EMG intensity over time, which we did not observe.Therefore, the reduction in EMG intensity in this study most likely reflects a reduced number of active motor units and/or a reduced motor unit firing rate of the investigated muscles.
4.4.Motor control strategies underlying muscle activity adaptation
Finally,the question remains how the neuromuscular system can maintain a constant running speed and stride frequency with a reduction in motor unit activity and,supposedly,a reduction in muscle forces across all major leg muscles.Here, it should be noted that the changes in EMG intensity are relative to the mean EMG intensity across all testing rounds and not a maximum voluntary contraction.For example, at a running speed of 3.5 m/s, the BF stance phase activity reaches about 25%of its maximum EMG intensity during a maximum voluntary contraction.40Therefore, a 45% reduction in BF EMG intensity in the current study would approximately correspond to reducing the maximum voluntary contraction-normalized EMG intensity from 25%to 14%—still a considerable but more reasonable reduction.One possible mechanism to explain the simultaneous reduction in muscle activity for both knee and ankle flexors/extensors is that the motor control system reduced the amount of co-contraction between agonist and antagonist leg muscles,thus shifting the task goal away from a strategy toenhance dynamic joint stability and towards an energetically efficient muscle activation strategy.23This mechanism is consistent with the finding that as children develop more efficient running patterns with increasing age and experience,they show an associated reduction in ankle and knee muscle co-contraction.22This hypothesis should be confirmed in follow-up experiments that include additional measures of running economy and muscle co-contraction.
The only muscle that did not show a systematic reduction in EMG intensity was the BF during its activity in the late swing phase.Before ground contact, the hamstrings decelerate knee extension(negative work)and in parallel extend the hip(positive work), thus efficiently transferring energy from the knee to the hip.41Further,at the time point of peak BF activity during swing (100 ms pre-HS) there is little to no co-contraction of the antagonistic quadriceps muscles (Figs.2D and 2E).Therefore, we speculate that there were no solutions for the neuromuscular controller to further optimize or reduce activity in the BF during late swing,thus leaving its control unaltered.Returning to the PMP paradigm, these results suggest that when forced to run at a predetermined speed, runners quickly(within seconds)adjust their overall gait pattern to reach a preferred stride frequency and stride length.42Their bodies then fine-tune the kinematic and muscle activation pattern to achieve the most efficient running style within this gait pattern.It is this latter fine-tuning process that was observed in the current study.
4.5.Interaction between testing rounds and shoe type
At the group level we observed only a few significant and predominantly small effects of running shoe type on the level of leg muscle activity.Given the systematic effects of increasing testing rounds and the randomized order of tested running shoes,the analysis with respect to shoe type was characterized by large between-subject variations and should be interpreted with caution.Nevertheless, this finding indicates that if systematic effects of running shoe type on the muscle activation pattern are present at the group level, their effect sizes are significantly smaller than the effect of the familiarization process (which shows percentage changes up to 50%).Our results are supported by a recent study reporting only small average percentage changes of about 10% in the EMG intensity of leg muscles when running in 3 different running shoes.43It is likely, however, that more substantial effects of shoe type on the level of leg muscle activity were present in our runners, but that they can only be observed at the individual level.6Our findings emphasize that adaptations of muscle activity in response to footwear—at the individual or group level—must be investigated during a time period after runners have fully familiarized with the running protocol.In any other case, the investigation will lack sensitivity to detect adaptations at the group level or may lead to spurious conclusions at the individual level.
4.6.Limitations
It is unclear whether our results can be generalized to running protocols where participants run at self-selected speeds and/or run on treadmills.As kinematic adaptations to treadmill running have been observed for both self-selected and predetermined speeds,however,it is likely that muscle activity adaptations are also present for preferred speed protocols(overground and treadmill alike) but potentially with distinct magnitudes or time courses.17-19In our running protocol, individuals wore a different running shoe during each testing round, which likely added a second layer of adaptation,i.e.,adaptation of the muscle activation pattern to the running protocol and the current running shoe.44Although the influence of shoe-related adaptations was minimized by the intermittent 200 m familiarization laps(Fig.1),the 2-layered adaptation process may still have resulted in an overestimated duration of familiarizing to only the running protocol.However, since this 2-layered adaptation process is part of most studies investigating the effects of various types of running footwear,our recommended familiarization period of at least 7 min remains valid.Further,because we tested 5 different footwear conditions in a randomized order,we had to limit our analysis to the group-average adaptation in muscle activation patterns and were unable to investigate individual adaptations.Such individual adaptations may account for the large variability in EMG intensities that was observed specifically for the first and last testing rounds(Fig.3).Future studies should investigate the relationship between the skill level/prior running experience and the time course and magnitude of muscle activity adaptations because highly skilled and experienced runners may already have optimized gait patterns for a wide range of running speeds.42Finally, we cannot exclude the possibility that the reduced muscle activity of the investigated muscles was compensated by increased activity in synergistic muscles,which we did not investigate(e.g.,rectus femoris or peroneus).This would represent an alternative adaptation process as opposed to a reduction in co-contraction.Given that force sharing patterns among synergistic muscles appear to be highly individual,45this alternative mechanism requires further investigation.
5.Conclusion
When running at a predetermined speed and with a similar overall gait pattern, the neuromuscular system undergoes an adaptation process characterized by a progressive reduction in the activity level of major leg muscles.This process may represent an optimization strategy of the neuromuscular system to increase the efficiency of the gait pattern at the given predetermined speed by reducing the amount of muscle co-contraction.The adaptation process is highly relevant for the design of typical running protocols aimed at comparing muscle activation patterns between running bouts under different running conditions, such as variations in footwear.This study suggests the familiarization period that takes place prior to such protocols should include at least 7 min or 600 strides of running at the predetermined speed.
Acknowledgments
The authors would like to acknowledge Jordyn Vienneau,Aimee (Smith) Mears, Christian Meyer, and Antonio Blago for their support in collecting data for this study.The authorswould like to thank Adidas (Herzogenaurach, Germany) for providing the test shoes.
Authors’contributions
MM conceived, designed, and coordinated the study, collected part of the EMG data, analyzed all of the EMG data,and drafted the manuscript; VvT conceived and designed the study,provided analysis software,and revised the manuscript;SN and BMN conceived, designed, and supervised the study,and revised the manuscript.All authors have read and approved the final version of the manuscript, and agree with the order of presentation of the authors.
Competing interests
Adidas (Herzogenaurach, Germany) provided the running shoes that were used for this study.However, the results presented in this article do not in any way represent a bias toward Adidas products over other brands.Furthermore, the results of the present study do not constitute endorsement of the product by the authors.The authors declare no competing interests and that all results of the study are presented clearly,honestly,and without fabrication,falsification,or inappropriate data manipulation.
Supplementary materials
Supplementary materials associated with this article can be found in the online version at doi:10.1016/j.jshs.2021.01.003.
 Journal of Sport and Health Science2022年3期
- Journal of Sport and Health Science的其它文章
- The secrets to running economy
- Metabolic and performance responses of male runners wearing 3 types of footwear:Nike Vaporfly 4%,Saucony Endorphin racing flats,and their own shoes
- Longitudinal bending stiffness does not affect running economy in Nike Vaporfly Shoes
- Can changes in midsole bending stiffness of shoes affect the onset of joint work redistribution during a prolonged run?
- Metabolic cost of level,uphill,and downhill running in highly cushioned shoes with carbon-fiber plates
- Neuromuscular,biomechanical,and energetic adjustments following repeated bouts of downhill running