
Changes in ankle work,foot work,and tibialis anterior activation throughout a long run
2022-06-09 09:23EricHonertFlorinOstermirbVinzenzvonTschrnerBennoNigg
Eric C.Honert*,Florin Ostermirb,c,Vinzenz von TschrnerBenno M.Nigg
a Human Performance Laboratory,Faculty of Kinesiology,University of Calgary,Calgary,AB T2N 1N4,Canada
b Institute of Sports and Sports Science,Karlsruhe Institute of Technology,Karlsruhe 76131,Germany
c Department of Sports Science and Sports,Friedrich Alexander University Erlangen-Nuremberg,Erlangen 91058,Germany
Abstract Background:The ankle and foot together contribute to over half of the positive and negative work performed by the lower limbs during running.Yet,little is known about how foot kinetics change throughout a run.The amount of negative foot work may decrease as tibialis anterior(TA)electromyography(EMG)changes throughout longer-duration runs.Therefore,we examined ankle and foot work as well as TA EMG changes throughout a changing-speed run. Methods:Fourteen heel-striking subjects ran on a treadmill for 58 min.We collected ground reaction forces,motion capture,and EMG.Subjects ran at 110%,100%,and 90%of their 10-km running speed and 2.8 m/s multiple times throughout the run.Foot work was evaluated using the distal rearfoot work,which provides a net estimate of all work contributors within the foot. Results:Positive foot work increased and positive ankle work decreased throughout the run at all speeds.At the 110%10-km running speed,negative foot work decreased and TA EMG frequency shifted lower throughout the run.The increase in positive foot work may be attributed to increased foot joint work performed by intrinsic foot muscles.Changes in negative foot work and TA EMG frequency may indicate that the TA plays a role in negative foot work in the early stance of a run. Conclusion:This study is the first to examine how the kinetic contributions of the foot change throughout a run.Future studies should investigate how increases in foot work affect running performance.
Keywords: Electromyography;Footwear;Running performance
1.Introduction
Many shoe companies and research labs are developing long-distance footwear to enhance running performance.1,2New footwear construction concepts have been shown to alter ankle3,4and foot biomechanics.5-8The ankle and foot together contribute to more than 50%of the positive and negative lower limb joint work during running.6,9Generating positive work distally in the leg takes advantage of natural pendular dynamics to reduce the cost of locomotion.10,11Furthermore,generating positive work about the ankle utilizes a small active muscle volume,12which reduces the metabolic demand of running.Interestingly,during a long-distance,near maximal speed run,positive ankle work decreases and positive hip work increases.13Such a redistribution of work is thought to be a contributing factor to the increased metabolic cost over a long-duration run.13However, biomechanical characterizations of long-duration runs have overlooked how foot kinetic contributions change throughout.13,14The work performed by the foot during running can be attributed to several sources including soft tissues(e.g.,foot pad),shoe cushioning,plantar fascia,and intrinsic foot muscles.15-17In order to have a comprehensive understanding of the work performed during long distance running, one must study all of the contributors, especially those structures that generate positive work distally in the leg.
The absorption performed by the soft tissues of the foot and the shoe cushioning may decrease throughout a run due to changes in the muscle activity of the tibialis anterior(TA).During incremental speed runs lasting longer than 25 min, the TA exhibits fatiguing-like electromyography (EMG) patterns.18,19TA muscular fatigue has been shown to reduce its isometric force capacity.20This could be the reason runners with TA fatigue tend to contact the ground with a less dorsiflexed ankle,21-23which would mitigate the amount of negative work(e.g., eccentric contraction) performed by this muscle.Such a change in running style may reduce the amount of work absorbed by the soft tissues of the foot or shoe cushioning.
Furthermore, it is not known how ankle kinetics and TA EMG change during a realistic,long-duration run.Previously,these changes have been quantified in constant speed or incremental speed protocols that do not reflect realistic running.For instance, during a 10-km race, runners will vary their running speed up to 10%.24More drastic running speed changes can occur depending on terrain.25Understanding how ankle kinetics and TA EMG change throughout a varied speed run can provide further insights into how running performance changes during everyday running.
The primary aim of this study was to characterize how negative and positive foot work change throughout the duration of a changing-speed run.Our first hypothesis was that the negative work would decrease in magnitude throughout a run at a range of running speeds.Our second hypothesis was that the positive work would not change throughout the run at a range of running speeds.We predicted no change in the amount of positive foot work as a previous study showed little to no change in foot kinematics and foot pressure after a long-duration run.26We evaluated the change in foot work through the distal rearfoot work.The distal rearfoot work provides a net estimate of all work sources in the foot.15,17
The secondary aim of this study was to examine the ankle positive work and TA activation throughout a changing-speed run.Our third hypothesis was that the ankle positive work would decrease throughout the run, similar to trends established in a constant, near-maximal speed run.13Our fourth hypothesis was that the TA EMG frequency would decrease and the activation intensity would increase, similar to incremental-speed runs.18,19
2.Methods
2.1.Participants and protocol
Fourteen recreationally active subjects(7 males:age=25±3 years, height=1.76 ± 0.07 m, weight=73.0 ± 4.5 kg,10-km speed: 3.0 ± 0.3 m/s, mean ± SD; 7 females: age=26±4 years,height=1.68±0.07 m,weight=63.4±4.1 kg,10-km speed: 2.7 ± 0.3 m/s) provided written informed consent and participated in this study.Subjects were recruited between September and November of 2019.Subject activity level can be seen in Supplementary Table 1.All participants were self-reported heel-strike runners and wore neutral running shoes (Brooks Ghost 11; Brooks Sports, Seattle, WA,USA).The protocol was approved by the University of Calgary’s Conjoint Heath Research Ethics Board (REB17-0171).Subjects ran on an instrumented treadmill with 23 retro-reflective markers attached to their right lower limb to track pelvis, thigh, shank, and rearfoot motion.Specifically, 4 markers were placed on the shank (2 on the anterior aspect,2 on the lateral aspect),2 markers on the ankle malleoli,and 3 markers on the exterior of the shoe representing the medial,lateral,and posterior aspects of the calcaneus.A functional movement trial was used to define the ankle, knee, and hip joint centers.27Additionally, a Delsys trigno EMG sensor (Delsys,Natick, MA, USA) was placed on their TA in accordance to SENIAM(https://seniam.org)recommendations.Motion capture(200 Hz,Vicon,Oxford,UK),ground reaction forces(1000 HZ,Bertec,Columbus,OH,USA),and EMG(1111 Hz,no amplification, 20-450 Hz band pass filtered by the equipment) were collected throughout the changing-speed run.
Subjects ran continuously for 58 min at a variety of different speeds on level ground (Fig.1).Subjects performed a 5-min warm-up for familiarization to treadmill running.All subjects then ran at 2.8 m/s for 2 min.This speed was chosen to correspond with running 10 km in approximately 1 h, an approximate cut-off time for recreational runners.28This speed was higher than some subjects’ 10-km speed and lower than that of some others.Subjects then performed 3 bouts(randomized running bout (R) 1, R2, and R3) of running.R1, R2, and R3 occurred during the following times of the run:7-22 min,24-39 min, and 41-56 min, respectively.Each running bout had 3 randomly ordered speeds based on subjects’self-reported 10-km (10k) running speed.These speeds were 90%(2.6±0.3 m/s),100%(2.9±0.3 m/s),and 110%(3.2±0.4 m/s) of the subjects’ 10k speed (see Supplementary Table 2 for subject-specific running speeds).Subjects ran at each of these speeds for 5 min.Before the first bout and after each subsequent bout,subjects ran at 2.8 m/s for 2 min.Subjects ran at this speed incrementally throughout the protocol in order for us to better understand biomechanical differences throughout the run,irrespective of speed.Motion capture,ground reaction forces,and EMG were collected during the last 60 s of running at a given speed.In total,data were collected 13 times throughout the run.Heel-strike for all runners was verified after the data collection by examining the vertical ground reaction force from the first trial (at 2.8 m/s) to ensure that all subjects contacted the ground with their rearfoot first.
2.2.Kinetics
Ankle and distal rearfoot power and work were computed in Visual3D(C-Motion,Germantown,MD,USA)and MATLAB (MathWorks Corp., Natick, MA, USA).Marker trajectories and ground reaction forces were filtered with a third-order,dual-pass,Butterworth Filter at 20 Hz and 35 Hz,respectively.The ankle power was the 3 degree-of-freedom rotational power between the rearfoot and shank segments.The distal rearfoot power is the 6 degree-of-freedom (3 rotational and 3 translational)power between the rearfoot and the ground.29The distal rearfoot power has been referred to by different names such as “unified deformable foot”,30“distal hindfoot”,31and“distal-to-rearfoot”,17among others.The distal rearfoot power provides a net estimate of the intrinsic foot joints (such as the mid-tarsal joint and metatarsophalangeal joint)17,31and soft tissues in and around the foot (such as the heel pad and shoe cushioning).15Power metrics for each subject and trial were determined as the mean of 50 steps.Positive and negative work was computed for each of these metrics by integrating the power curves with respect to time for the positive and negative portions of the curves, respectively.Power and work metrics were non-dimensionalized using subject-specific leg-length and body mass in order to remove spurious correlations that can occur due to these physiological parameters.32These metrics were subsequently re-dimensionalized using study-average leg-length and body mass to present data in commonly used units(e.g.,watt(W)/kg,J).Mean±SD power and work non-dimensionalization constants were 1889 ±206 W and 548 ± 72 J, respectively.Leg-length was defined as the distance from the functional hip joint center to the functional ankle joint center during a standing trial.
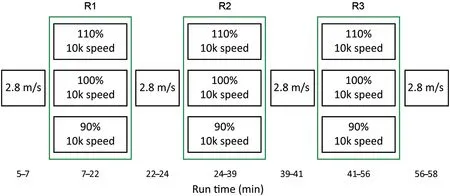
Fig.1.Changing-speed run protocol.All subjects performed a 5-min warm-up prior to the protocol.The randomized running bouts were all based on subjectreported 10-km running speed.10k=10-km;R=randomized running bout.
2.3.EMG analysis
TA muscle activation was measured via the EMG sensor placed on the TA muscle belly.Using a wavelet analysis, the TA EMG signal was decomposed into EMG-power as a function of time and frequency.33The wavelet analysis has been used previously to understand changes in muscle activity during long-duration running.34-36The present analysis convolves (determines the similarity of) 20 Cauchy wavelets of non-linearly spaced center frequencies and the TA EMG signal to create a wavelet-power pattern.These center frequencies were:2,6,13,21,34,46,62,78,95,116,139,165,192,220,251,283,319,355,395,and 435 Hz.As the first 3 center frequencies were below the band-pass filter of the equipment,we removed them from further analyses.The non-linear wavelet approach used here is favorable over other wavelet approaches as it equally weights the frequency content between the first and last center frequency.37As such, the overall intensity can be resolved from the wavelet-intensity pattern by summing the intensities from each wavelet center frequency together,effectively creating a band-pass filter between the lowest center frequency and highest center frequency.33,37
We then computed the wavelet-intensity pattern, which was the square-root of the wavelet-power pattern.In order to account for TA activation prior to foot contact, the wavelet-intensity pattern was computed from 50% of stance time before foot contact to toe-off.38The wavelet-intensity pattern was computed for 50 steps in each trial.The wavelet-intensity patterns for each subject were normalized to the intensities above 125 Hz summed over all timepoints of a step.39This frequency range was chosen because clustering of motor unit action potentials is expected to have little effect in this range.39
A principal component analysis was performed on the wavelet-intensity patterns to determine a boundary that differentiates between low- and high-frequency TA activations.Visual inspection was performed on the mean reconstructions of the first 5 principal components, which explained, in most cases, >70% of the variance in the wavelet-intensity patterns(Supplementary Fig.1).Inspecting all subjects and trials, we observed distinct TA muscle activations in a low-frequency band between the 21 and 34 Hz center frequencies and in a high-frequency band between the 46 and 435 Hz center frequencies.
The TA EMG intensity was then examined in the low-and high-frequency bands as well as across all frequencies.Similar examinations have been performed in the past in order to understand differences in muscle activity with orthotic interventions during running.40The wavelet intensities with center frequencies between 21 and 34 Hz were summed together to create the TA low-frequency intensity.This summation provides a single, time-dependent curve.An increased activation below 35 Hz has been attributed to the clustering of motor unit action potentials.20,41The wavelet intensities with center frequencies between 46 and 435 Hz were also summed to create the TA high-frequency intensity curve.The low-and high-frequency intensity curves illustrate an understanding of when the TA is activated.The intensity curve across all frequencies(termed here overall intensity) was computed by summing together the TA EMG intensity curves from all of the wavelet intensities.The total overall, total high-frequency, and total low-frequency intensities (scalar values) were then computed by integrating the overall, high-frequency, and low-frequency intensity curves with respect to time.
We then examined similar EMG metrics to those examined during long-duration running.The total overall intensity is the first metric of interest for examining TA EMG changes throughout a long-duration run.18,19We analyzed the TA activation frequency shift by computing the ratio of the total high-frequency intensity to the total low-frequency intensity(a similar approach to reference42).This ratio is the second metric of interest for examining TA EMG changes throughout a long-duration run.Such a ratio is similar to examining the mean EMG frequency19as both metrics provide information regarding the frequency of EMG signal shifts.A shift in the mean EMG frequency during fatiguing isometric contractions has been attributed to a change in the motor unit conduction velocity and/or clustering of motor unit action potentials.20,41However, a shift in the frequency during dynamic tasks (such as running)may indicate a change in muscle fiber type recruitment.43,44Alternatively,this frequency shift could be due to a difference in muscle activity before and after foot contact during running,38which is normally not considered when interpreting the mean frequency.All EMG processing was performed in MATLAB(MathWorks Corp.).
2.4.Statistical analysis
Statistical analyses were performed to determine significant differences and effect sizes (ES) in ankle and distal rearfoot work, TA total intensity metrics, and the ratio between the total TA high- and low-frequency intensities throughout the run.Shapiro-Wilk’s tests were performed to determine normality.As not all data were normally distributed,non-parametric statistics were performed.All statistical tests performed were paired tests to establish whether observed biomechanical changes were different from zero.Friedman’s tests were used to determine if there were significant differences in the outcome metrics throughout the run at a given speed.Follow-up Wilcoxon signed-rank tests were performed if the Friedman’s tests revealed significant differences.The family-wise α level was 0.05 for all tests.A Holm-Sidak,step-down correction was performed to account for multiple comparisons.This correction adjusts the α level for individual comparisons.The ES was computed from Hedge’s g.45Small,medium, and large effects sizes are considered 0.2, 0.5, and 0.8, respectively.Hedge’s g is a parametric test, and was utilized here as there is not a robust,non-parametric equivalent for the sample size we collected.45Presented results are the study-averaged mean and SE.
3.Results
3.1.Kinetics
The positive distal rearfoot work increased throughout the run, regardless of the running speed (p <0.002, ES ≥0.6,Figs.2 and 3).This increase in positive work was on average 22% ± 8% (2.3 ± 0.6 J, between time (t)=6 min and t=57 min,p <0.001,ES=1.0)at 2.8 m/s.The negative distal rearfoot work significantly decreased,on average dropping by 15% ± 4% (p=0.003, ES=0.7) at the fastest running speed(110%10k speed)between R1 and R2.There was also an average decrease of 13% ± 4% in the negative distal rearfoot work between R1 and R3 at this speed;however,this decrease was not statistically significant (p=0.04, ES=0.6).There were no significant differences in the negative distal rearfoot work at the other running velocities(p >0.07).
The positive ankle work decreased throughout the run,regardless of running speed(p <0.03,ES ≥0.5,Figs.2 and 4).This decrease in positive work was on average 17%±2%(5.6±0.8 J,between t=6 min and t=57 min,p <0.001,ES=1.6)at 2.8 m/s.There were no significant changes in negative ankle work throughout the run (p >0.6).See the Supplementary Tables 3-6 for results not graphically shown.
3.2.EMG
There were greater differences in TA activation in lower frequencies between 21 and 34 Hz than in higher frequencies between 46 and 435 Hz(Fig.5).There was an average increase of 214% ± 44% (p=0.009, ES=0.5) in TA total low-frequency intensity between R1 and R3 at the fastest running speed(110%10k speed).There were no significant differences in total low-frequency intensity at the other running speeds(p >0.1).Additionally, there were no significant differences in the total high-frequency intensity at any speed throughout the run (p >0.5).The TA total overall intensity increased throughout the run at all speeds;however,these increases were not significantly different(p >0.2,Fig.6).There was a significant decrease in the ratio of total high-frequency intensity to total low-frequency intensity at the 110%10k speed condition(p <0.009,ES ≥0.4,Fig.6).See Supplementary Tables 3-6 for results not graphically shown.
4.Discussion
This study is the first to examine how the kinetic contributions of the foot change throughout a long-duration run with changing running speeds.We measured changes in foot work through the distal rearfoot work,which has been shown to provide a net estimate of all work contributors within thefoot.17,29We found partial support for our first hypothesis as the amount of negative foot work decreased at the fastest running speed (110% 10k speed).Surprisingly, we observed an increase in positive foot work throughout the run.As such,we could not confirm our second hypothesis.We also observed a decrease in positive ankle work thus confirming our thirdhypothesis.Finally, we cannot confirm our fourth hypothesis as we did not observe both a decrease in TA EMG frequency and an increase in intensity.
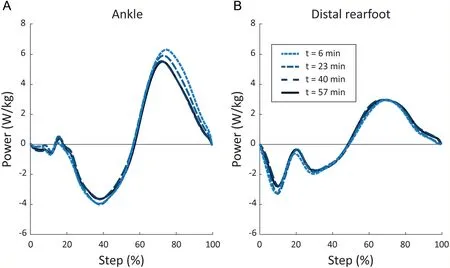
Fig.2.(A) Ankle and (B) distal rearfoot power throughout a changing-speed run when running at 2.8 m/s.Presented data are the mean of 14 subjects.t=time;W=watt.
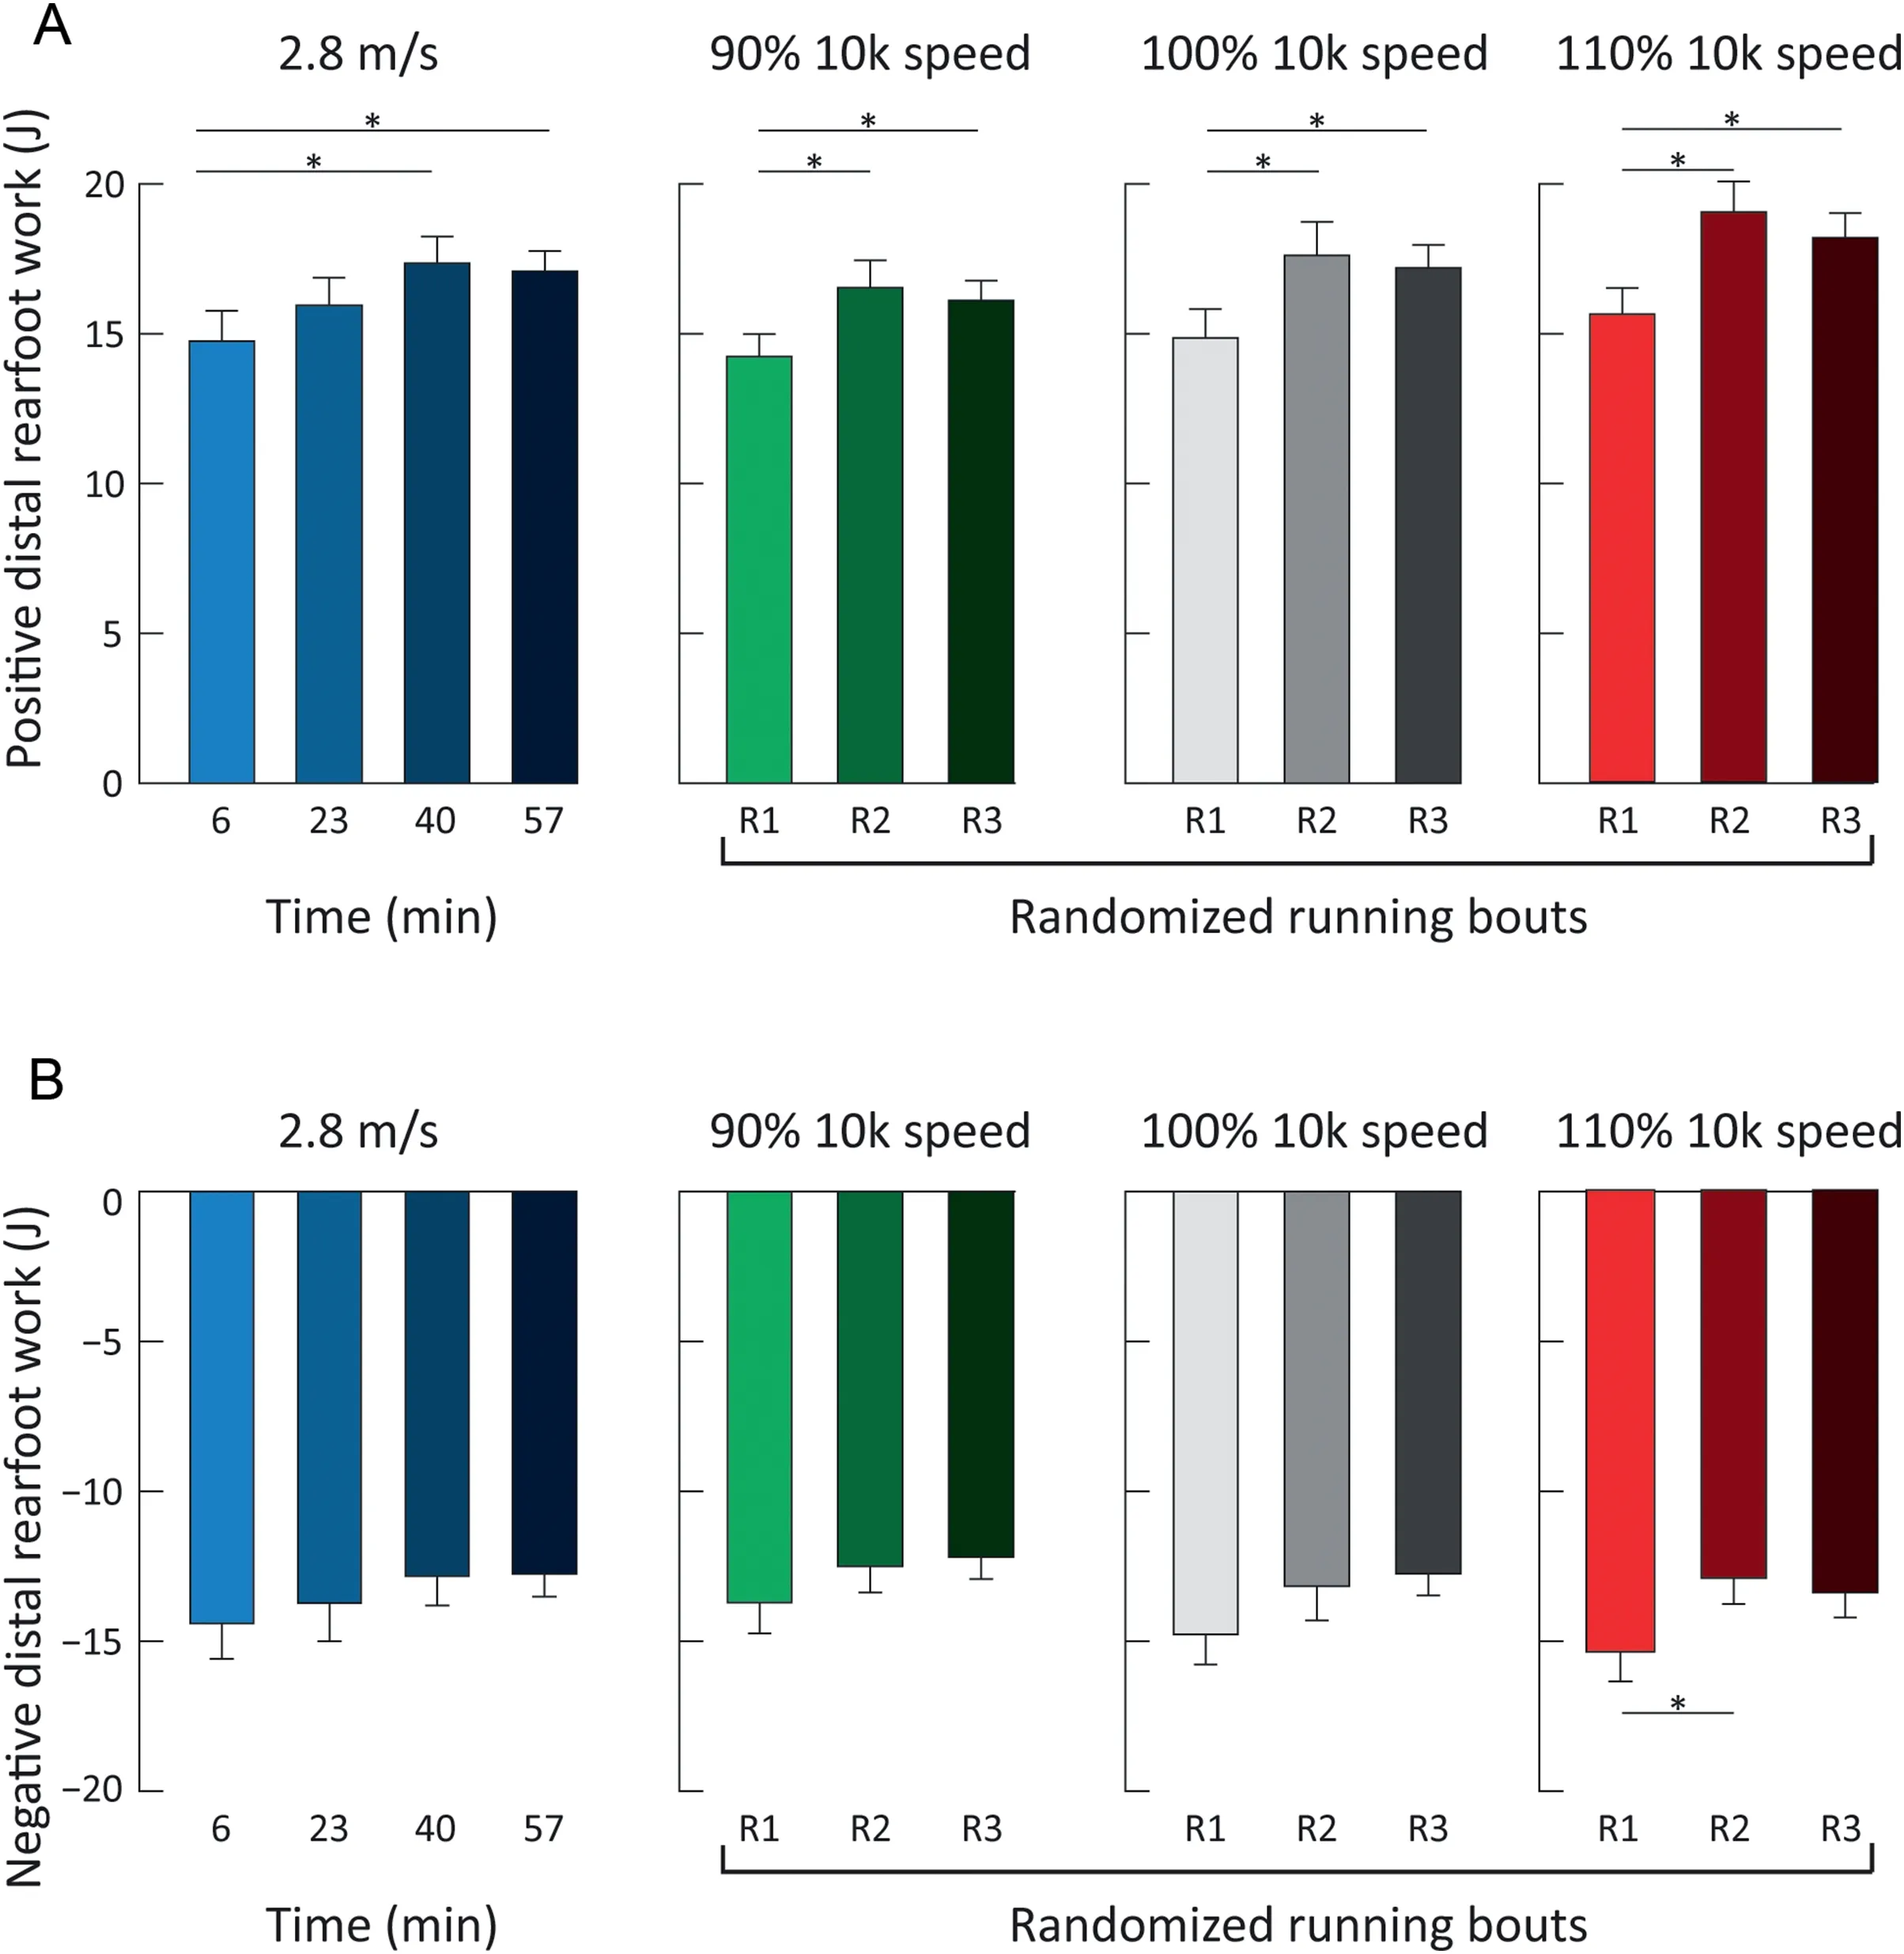
Fig.3.(A) Positive and (B) negative distal rearfoot work for all speeds throughout the entire run.The randomized running bouts (R1, R2, and R3) occur in between the consistent running bouts at 2.8 m/s.*indicates significant differences between the different times throughout the run(p ≤0.03).Presented data are the mean±SE of 14 subjects.10k=10-km;R=randomized running bout.
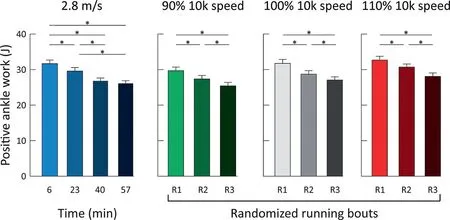
Fig.4.Positive ankle work for all speeds throughout the entire run.The randomized running bouts (R1, R2, and R3) occur in between the consistent running bouts at 2.8 m/s.* indicates significant differences between the different times throughout the run (p ≤0.03).Presented data are the mean ± SE of 14 subjects.10k=10-km;R=randomized running bout.
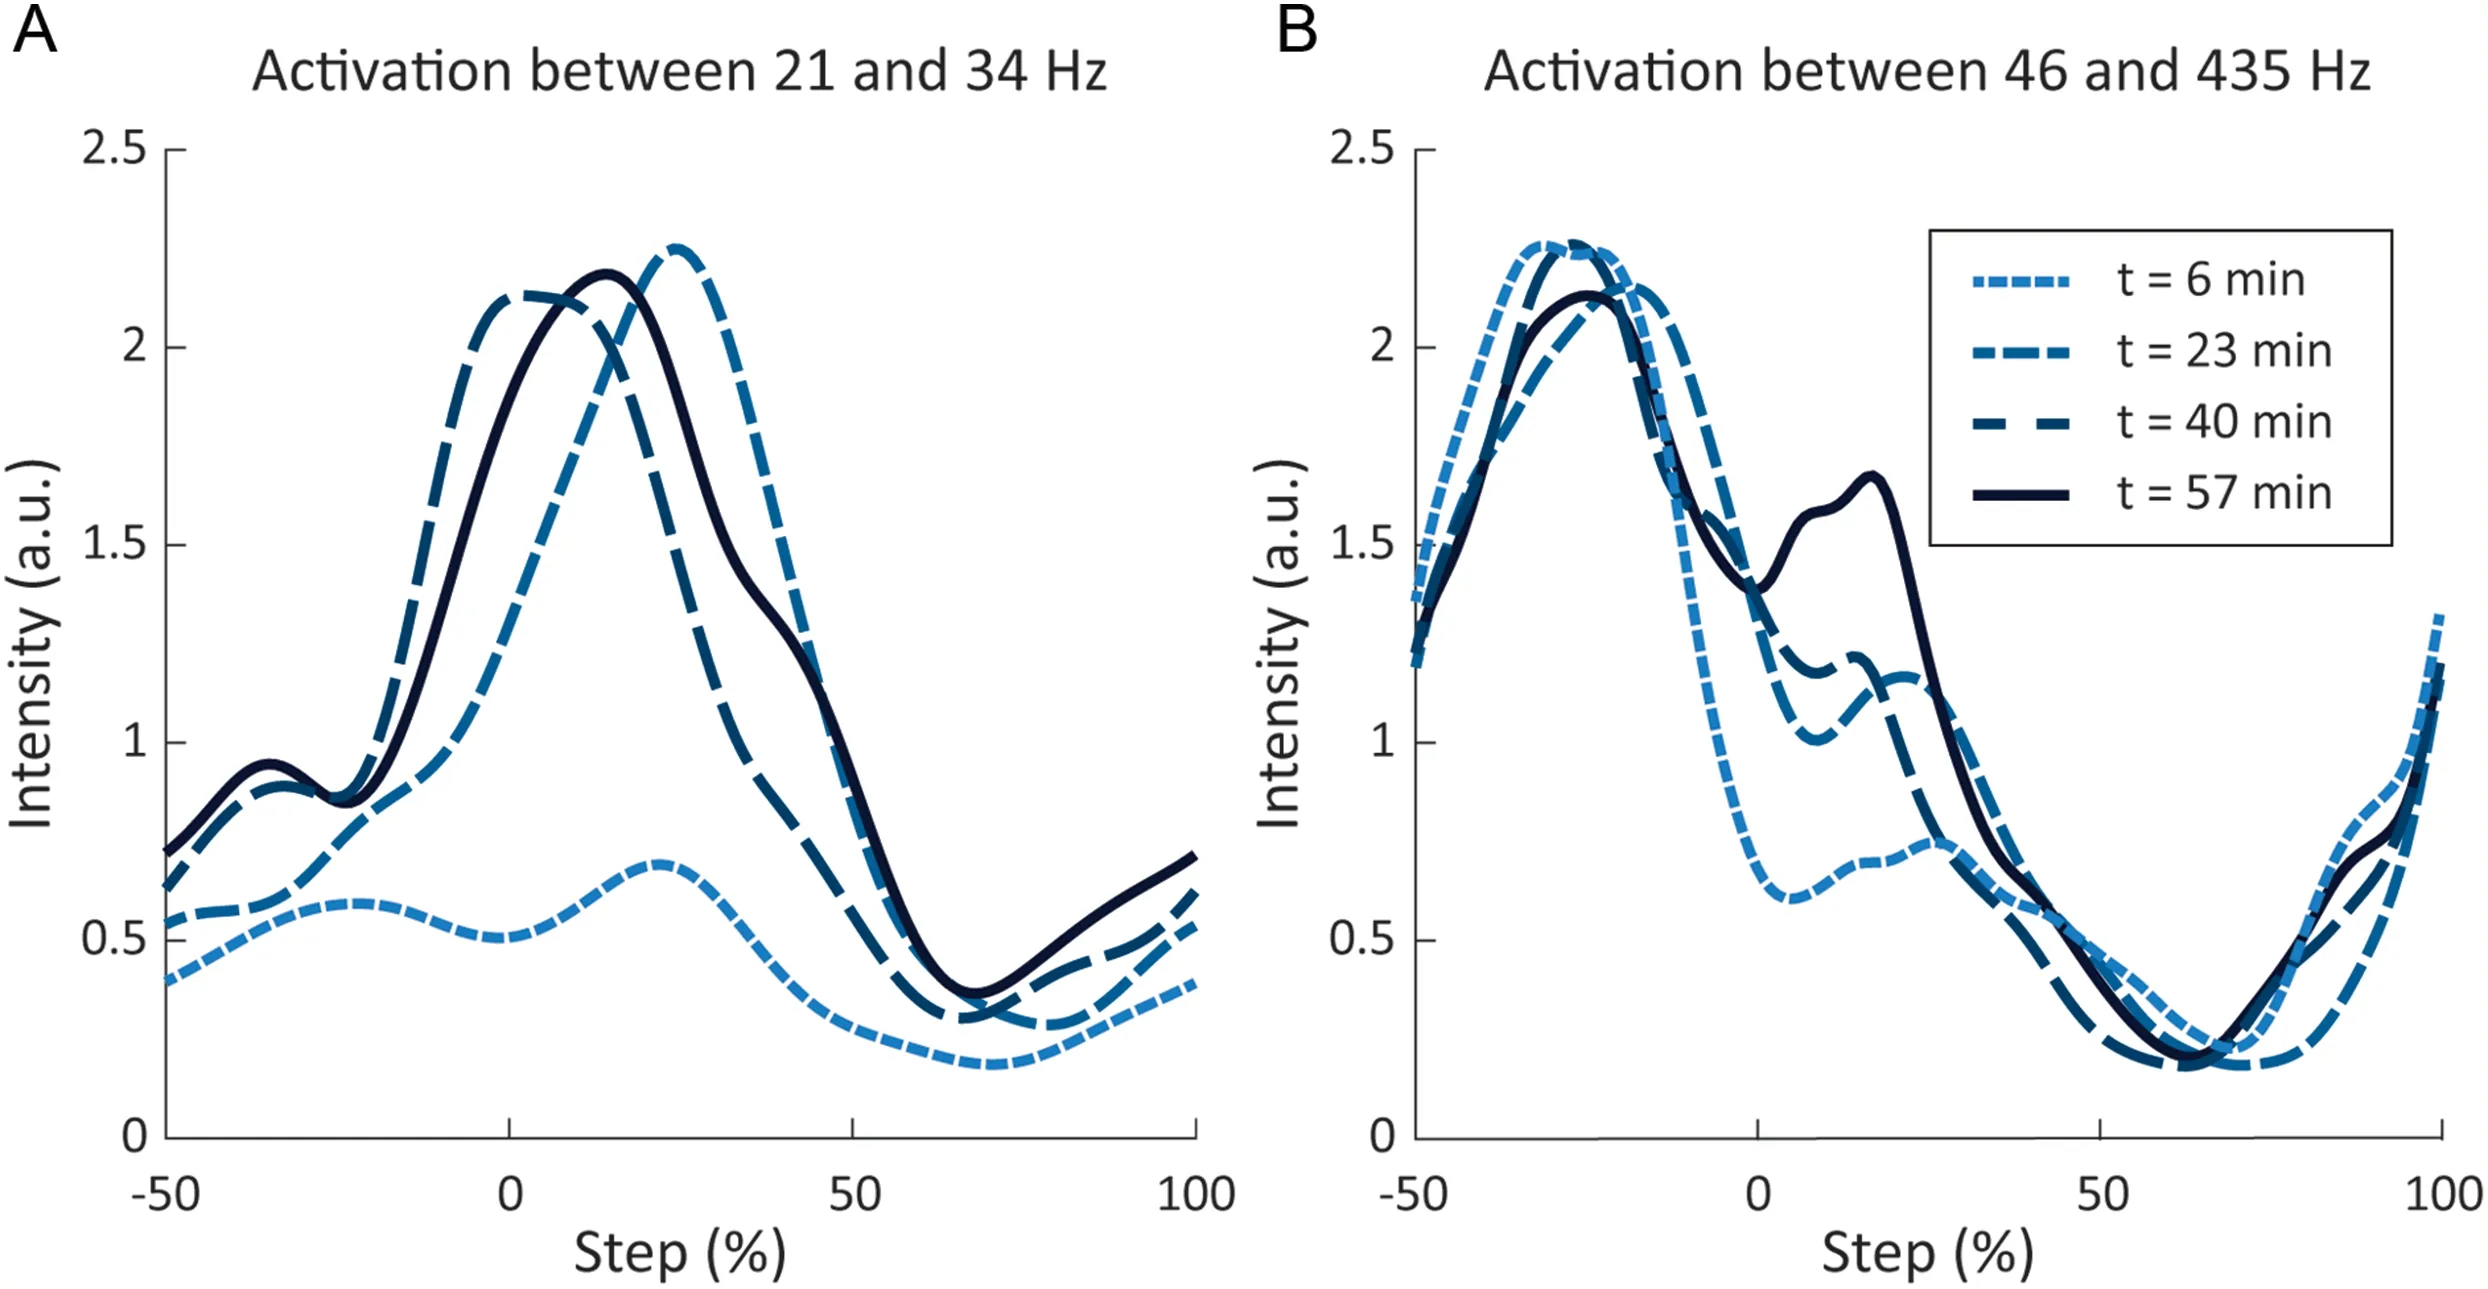
Fig.5.Tibialis anterior intensity between(A)21-34 Hz and(B)46-435 Hz throughout the running protocol at 2.8 m/s.Intensity curves are the mean of 14 subjects.a.u.=arbitrary unit;t=time.
Since an exhaustion running study observed little change in foot kinematics and plantar pressures,26the increase observed in the positive distal rearfoot work at all running speeds in this study was unexpected.Positive distal rearfoot work can be linked to energy return from passive structures such as the plantar fascia and active structures such as the intrinsic foot muscles.Presumably, an increased energy return from the plantar fasciawould be accompanied by increased energy storage or increased negative distal rearfoot work.However,we observed no change or even a decrease in the negative distal rearfoot work (Figs.1 and 2).As such,the relevant increase is most likely due to positive work generated by intrinsic foot muscles46that articulate about the mid-tarsal joint.This joint(sometimes modeled as the Chopart and Lisfranc joints) is the main positive joint power contributor in the foot.17,47Inhibiting intrinsic foot muscles,and thus mitigating the positive work performed by intrinsic foot muscles, does not affect the metabolic cost of running.46However, it is currently not known whether increasing the positive work contributions from these muscles is deleterious to the metabolic cost of running.
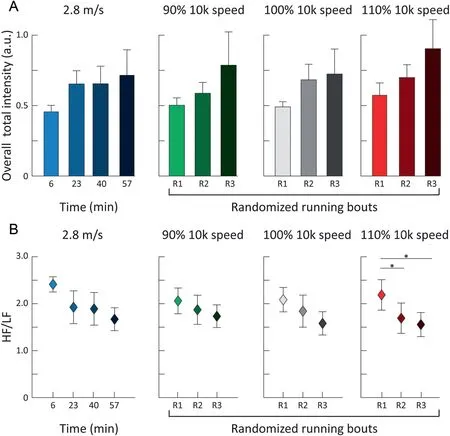
Fig.6.Tibialis anterior(A)magnitude and(B)frequency changes throughout a changing-speed run.HF/LF indicates the ratio of the total high-frequency intensity to the total low-frequency intensity.*indicates significant differences between 2 different times in the run (p <0.009).Presented data are the mean ± SE of 14 subjects.10k=10-km;a.u.=arbitrary unit;HF=high-frequency;LF=low-frequency;R=randomized running bout.
Mitigating the positive work performed by foot joints may be beneficial during a long-duration run.Many high-performance, long-distance running shoes now include carbon fiber plates(e.g.,Brooks Hyperion Elite,Hoka One One Carbon X,Adidas Adizero Pro Shoes, Saucony Endorphin Pro,and Nike VaporFly)to increase bending stiffness.Increasing shoe bending stiffness reduces the positive work performed by foot joints.5Increasing shoe bending stiffness may have mitigated the increase in positive distal rearfoot work we observed here.Future research should examine how long-distance footwear mitigates foot kinetic contributions to enhance long-distance running performance.
The reduced negative distal rearfoot work can be attributed to reduced power during the first 20%of stance(Fig.2)at the fastest running speed.Foot soft tissues,shoe cushioning,15and foot joints17perform negative work within the foot; however,foot joints perform negative work after 20% of the running stance.17As such, the reduced amount of absorption observed at the fastest speed is likely due to a reduction in the negative work performed by the foot’s soft tissues (e.g., heel pad) and shoe cushioning.
Throughout this changing-speed run, we observed a decrease in positive ankle work similar to that in exhaustive runs.13This decrease in ankle work(-5.6 J at 2.8 m/s,Fig.4)was partially offset by the increase in positive distal rearfoot work(+2.3 J at 2.8 m/s,Fig.3).This overall decrease(-3.3 J)in the amount of work performed by the ankle and foot may negatively affect the cost of running during a changing-speed run as other,less efficient,sources of joint work would have to compensate in order to maintain running speed.13
Interestingly, we observed a distinct difference in TA activation before vs.after foot contact after about 20 min of running (Fig.5).The TA intensity prior to foot contact was mainly due to activation in the 46-435 Hz band.After foot contact, the activation was mainly in the 21-34 Hz band.Such a difference may have occurred for several reasons.For instance,it could reflect a change in the foot kinematics as the TA inserts onto the medial cuneiform.We cannot confirm this hypothesis as we did not measure the foot kinematics here.Another potential explanation for this phenomenon is that there could be a different activation pattern in before vs.after foot contact that might itself reflect a change in neural strategy to perform concentric vs.eccentric contractions.48Similar TA activation differences in before vs.after foot contact have also been observed in barefoot running.38We did observe an increase in TA low-frequency activation during the eccentric contraction phase as well as a decreased amount of negative distal rearfoot work at the fastest running speed (Fig.3).This may indicate that the TA influences the amount of work absorbed by the foot soft tissues and shoe cushioning.
Our study has several limitations that should be mentioned.The distal rearfoot power/work may have been slightly overestimated in both positive and negative contributions due to non-constant treadmill belt speeds.As the discrepancies in treadmill belt velocity were present for all subjects, we feel confident in the trends of our results.It is also unknown how these results will translate to mid-foot or fore-foot striking runners as we exclusively recruited rearfoot-striking runners.Additionally, it is not known whether there will be similar results with high-caliber runners,as this group does not exhibit similar fatiguing effects in positive ankle work as recreational runners.13Subjects also wore standardized shoes in order to mitigate confounding factors; however, subjects were not habituated to these shoes, and that may affect the outcomes observed.49The observed changes in TA EMG could have been impacted by motion artifacts.Previous, high-impact experiments (e.g., jumping)50in our laboratory have shown that typical movement artifacts are triangular EMG intensity patterns that extend up to the highest frequencies (e.g., from long duration, low frequency to short duration, high frequency);however,this trend was not observed here.If motion artifacts were a cause of the observed changes, we would expect each subject to have a similar TA EMG response, but this was not the case.For example,at the 110%10k speed for the total low-frequency TA intensity between R1 and R3, 2 out of 14 subjects had no change,1 subject decreased,and the other subjects increased total intensity.
5.Conclusion
This study is the first to examine how the kinetic contributions of the foot change throughout a long-duration run.We observed an increase in positive distal rearfoot work throughout the run with a simultaneous decrease in ankle positive work.Future studies should investigate how increases in distal rearfoot work, specifically during a long-duration run, affect running performance.Additionally, long-distance running footwear (e.g., Nike VaporFly) with an increased bending stiffness may mitigate the increased distal rearfoot work observed here,which may in turn improve performance.
Acknowledgments
We would like to thank Frieder C.Krafft for his support with the data collection performed in this paper.This work was supported by Biomechanigg Sport & Heath Research which provided salary support to ECH, VvT and BMN.Biomechanigg Sport&Health Research did not contribute to writing,analysis,interpretation of results,nor publishing.
Authors’contributions
ECH participated in the design of the study, analysis of data,interpretation of results,and manuscript writing;FO participated in data collection,data analysis,and manuscript writing; VvT participated in interpretation of results and manuscript writing; BMN participated in interpretation of results and manuscript writing.All authors contributed to the manuscript writing.All authors have read and approved the final version of the manuscript,and agree with the order of presentation of the authors.
Competing interests
The authors declare that they have no competing interests.
Supplementary materials
Supplementary materials associated with this article can be found in the online version at doi:10.1016/j.jshs.2021.02.003.
 Journal of Sport and Health Science2022年3期
- Journal of Sport and Health Science的其它文章
- The secrets to running economy
- Metabolic and performance responses of male runners wearing 3 types of footwear:Nike Vaporfly 4%,Saucony Endorphin racing flats,and their own shoes
- Longitudinal bending stiffness does not affect running economy in Nike Vaporfly Shoes
- Can changes in midsole bending stiffness of shoes affect the onset of joint work redistribution during a prolonged run?
- Metabolic cost of level,uphill,and downhill running in highly cushioned shoes with carbon-fiber plates
- Systematic reduction of leg muscle activity throughout a standard assessment of running footwear