
Dual-contrast Optical Projection Tomography With Principal Component Analysis*
2022-04-24 06:15YANGXuLunZHANGYanTingGUANCaiZhongZHANGZhangWANGLuQuanYIMinHANDingAnWANGMingYiCHENYongZENGYaGuang
生物化学与生物物理进展 2022年4期
YANG Xu-Lun,ZHANG Yan-Ting,GUAN Cai-Zhong,ZHANG Zhang,WANG Lu-Quan,YI Min,HAN Ding-An,WANG Ming-Yi,CHEN Yong*,ZENG Ya-Guang*
(1)School of Mechatronic Engineering and Automation,Foshan University,Foshan 528000,China;2)School of Physics and Optoelectronic Engineering,Foshan University,Foshan 528000,China)
Abstract Objective We propose a dual-contrast optical projection tomography (DC-OPT) based on principal component analysis (PCA) to obtain a three-dimensional (3D) visualization of the blood-flow network and skeleton in a live organism.Methods The PCA method was used to extract the absorption and flow contrast images (15 images/projection position). The absorption image was obtained with the use of the first principal component of the raw image sequence. The flow images were obtained based on the computation of the modulation depth of each pixel. The flow and absorption contrast images at different projection positions are combined to achieve a synchronous reconstruction of a 3D image. Results The combination of PCA and OPT is used to realize the 3D imaging of the blood-flow network and skeleton of the biological sample by separating the dynamic blood flow signal and the static background signal of the sample. Conclusion The novelty of our study is attributed to the fast,simultaneous, dual-contrast 3D images of the blood-flow network and skeleton by the same optical system.The experimental result can be applied in physiological development studies in live model organisms.
Key words optical projection tomography,principal component analysis,dual-contrast imaging,three-dimensional angiography
The visualization of a three-dimensional (3D)blood-flow network and skeleton development is conducive to the provision of an effective means for the development of live organisms[1-2]. Label-free blood-flow network reconstruction methods, such as photoacoustic (PA) imaging and optical coherence tomography (OCT), have been developed in optical imaging[3]and applied biological research. PA imaging and OCT are noncontact methods and have high contrast. However, their applications are limited owing to the image depth and high cost. Optical projection tomography (OPT) is an inexpensive 3D microscopic imaging technology that can perform fullview 3D imaging of specimens. With laser speckle and laser Doppler effect of the moving blood flow,some methods have been developed to obtain 3D flow images in OPT systems[4-5].In this regard,Liaoet al.[6]proposed a method based on the scattering of lateral dynamic light called optical projection angiography(OPA).They used an intensity fluctuation modulation(IFM) method[7]to obtain the blood flow signal.However, to achieve this they recorded 512 raw frames(5.1 s)at every projection angle.
In this paper, we propose a dual-contrast optical projection tomography (DC-OPT) with the same laser source to simultaneously obtain the visualization of the blood-flow network and skeleton of live biological specimens. In the present study, the principal component analysis (PCA) method was used to extract the two-dimensional (2D) absorption and flow contrast projection image from 15 raw image frames at every projection position. For the DC-OPT, the absorption image was obtained with the use of the first principal component of the raw image sequence.The 2D flow images can be potentially achieved by using the modulation depth (MD) of each pixel as the image parameter. The flow and absorption contrast images at different projection positions are combined to synchronously reconstruct 3D blood-flow networks and skeleton images with the filtered backprojection algorithm. Compared with our previous work, we only use 15 raw image frames (0.15 s) with the PCA method to simultaneously obtain the absorption and flow images at every projection position. The experimental innovation of this study is based on the ability to generate synchronous, fast-speed, dualcontrast 3D images for blood-flow networks and skeletons in the same optical system. The experiment result can be applied potentially in physiological developmental studies.
1 Experimental setup

Fig.1 Schematic of DC-OPT
Figure 1a shows the schematic of the DC-OPT experimental setup. A laser source (LS) (λ=650 nm,average power: 50 mW) forms two symmetrical laser beams optical paths through a 1/2 fiber splitter (FS)continuous output. Using expanding lenses (L), two symmetric lasers to illuminate the sample as uniformly as possible, the telecentric imaging system avoid to receive the parallel transmission light from the light source and the camera only receives scattered light in the illumination field as show in the dotted frame①[8]in Figure 1a.A zebrafish (35 d old, length of 17 mm, width of 3.9 mm, and approximate maximum and minimum thicknesses of 2.5 mm and 0.4 mm, respectively) were used as the specimens to achieve 3D imaging for its blood network and skeleton. The customized telecentric system was used to capture raw speckle images at each projection angle position. The telecentric system (Edmund optics 58428) has a field depth of 9.67 mm and a spatial resolution of approximately 8.5 μm, and aperture is 0.025 and the magnification is 0.3×.The entire system was fixed on a vibration-isolating optical platform.The raw images were recorded by a camera (C)(acA2000-340 km, Basler with a pixel size of 5.5 μm×5.5 μm. As shown in Figure 1b, the camera records 15 raw speckle images at each projection position, and uses the PCA algorithm to obtain a blood flow and absorption contrast images. In the experiment, a 16-bit, high-speed analog output board(NI PCI-6221) was used to synchronize and trigger the camera acquisition and step motor rotation.First,a laser source (LS) was triggered to achieve a stable output followed by the digital camera acquisition.Subsequently, the stepping motor was triggered to rotate by 1.8°, and this process was repeated until the stepping motor was rotated by 360° to capture 200 angles in total. Herein, LabVIEW(version: 2015) was used for data acquisition, and MATLAB (version:2015 a) is used to process data. The biological specimen zebrafish used in the experiment was first anesthetized with a stabilizer. It was then hung in a cylindrical glass tube with thin walls (1 mm) and a large diameter (8 mm) with a low-melting point(L.M.P.)agarose(1%agar,gel temperature:24-29°C)fixation. The tube follow the specimen rotation and prevent its movement. Herein, the cylindrical glass tube was placed in the refractive index matching pool(IMP). With this, any refractive index difference between the glass and water/agarose was used to eliminate lens aberration[9].
2 Methods
The key problem of the DC-OPT was the synchronous extraction of the absorption and flow signal from the raw images. Our method can be described as follows. When a laser beam illuminates moving particles of the specimen, a time-dependent fluctuating intensity with a Doppler-shifted frequency can be observed. For capillaries, the Doppler frequency of the blood flow signal was generally in the range of 20 Hz-10 kHz.In our study,the exposure time of the camera was set to 50 µs. Based on the Nyquist sampling theorem,the camera can capture the variation of the Doppler signal up tof0= 1/2t0= 10 kHz[10]. The signal recorded by the camera was lower than the half period of the Doppler signal to retain its fluctuation condition. However, the acquired frame speed of the cameras was set to 100 frames per second (fps) that is much lower than the Doppler frequency. Thus, the sub-Nyquist sampling acquisition method can obtain the fluctuation information. In this case, the undersampled Doppler signal comprises a dynamic component from the moving red blood cells (RBCs) and a static component from the background, such the muscle or skeleton. The reason for the use of the particular sampling method has been explained in detail in our previous work[11]. Therefore, the acquired raw signal can be written as follows:

WhereIdc(x,y,t) andIac(x,y,t) are the static and dynamic components of the raw signal, respectively,xandyindicate the size of the collected data, andtis the data sample that denotes the acquisition time,xstands for Pixel.Figure 2 shows the schematic of PCA method used to extract the staticIdc(x,y) and dynamic signalIac(x,y). In this study, data with dimensions Pixel×Y×Time were acquired in the case of the DCOPT, and the datasets (Pixel-time), including the spatiotemporal information, were employed in each PCA algorithm. Herein, we remarked that PCA-based techniques have been proposed for several applications in medical ultrasonic imaging. Further,on the basis of the different statistical characteristics of the blood flow and wall thump signals, PCA has been employed to discriminate the blood flow component from a mixed signal in ultrasonic imaging[12]. Accordingly, in this study, we separated the dynamic blood flow signal from the static background signal and low-frequency noise with PCA.In this regard,we first calculated the covariance of the row pixel data along the time sequence and obtained the covariance matrixC(x,yi,t)=cov[(x,yi,t)],whereI(x,yi,t) denotes the undersampled Doppler signal at the pixel in rowi, and cov[I(x,yi,t)] denotes the covariance operation.C(x,yi,t) is the eigenvalue decomposed along T orthogonal directions expressed as

where Λ=diag(λ1,λ2,…,λT), (λ1>λ2>…λT) denotes the eigenvalue matrix andEis the eigenvectors[10]. PCA uses an orthogonal transformation to convert raw correlated variables in linearly uncorrelated variables.This indicates that the base vectors of all the components are orthogonal. This is similar to our previous optical projection angiography method[6]. In that study, we used Fourier transform to convert the time-domain signal in the frequency domain, and extracted the blood flow information according to the frequency component between the dynamic flow signal (high-frequency signal). The dynamic signal can be obtained as follows[10]:

Fig.2 Schematic diagram of PCA algorithm
The static background signal (low-frequency signal)can be presented as:

whereωdandωsdenote the weights that decide the filtering range. Notably, the weights can be modified according to the required case. We setωd=(0,1,1,1,…)T, which presents all the high-order principal components,i.e., from 2 to N. We setωs=(1,0,0,0,…)T, which presents the first principal component. ∑denotes the sum operator with respect to the time. In the traditional OPT case, the import problem refers to the extraction of the absorption signal that presents the absorption message along the field depth in the optical telecentric system. Based on the PCA method shown Figure 2,we assumed that the first principal component represents the absorption information for most specimens. We usedIdc(x,y)processed by Equation (4) to represent the absorption information of the specimens at every projection position.
To visualize the blood flow image, the MD of each pixel was defined as the flow image parameter,i. e., the ratio of the dynamic signal to the static signal[10]:

According to our previous study, the flow parameter MD presents the concentration of moving particles, and the parameter MD is related to the particle concentration.Given that the PCA method has the capacity to separate the blood flow signal from the background tissue signal. In our previous work[10], we verified that the imaging effect of the PCA method when the number of frames is 5-15 frames is better for the flow contrast, but in order to balance OPT absorption imaging, it requires multi-frame image to average the laser speckle.So the number of 15 frames at every projection position is chosen as optimal frames to process the data. Then the acquired time was approximately 0.15 s. Compared with the IFM method that acquires 512 frames raw images (5.1 s),our method improved considerably the imaging speed.This is important for live organisms. Absorption images and blood flow images at different angles were reconstructed with the filtered backprojection reconstruction algorithm to form 3D image[13].
Herein, * represents the convolution,M(l,θ)represents the projection parameter MD orldcfor the same angle of viewθ.In the case of OPT images,it is the polar coordinate representation ofIdc, and in the case of OPA, it is the polar coordinate representation of MD. In addition,c(l) denotes the spatial domain representation of the appropriate filter required for back projection. So far, the 3D vascular structure and 3D tissue structure were obtained.
3 Results and discussion
Figure 3 shows the normalized raw image(Figure 3a), the normalized absorption image (Figure 3b), and the normalized flow image (Figure 3c) at a projection position.The laser speckle character can be identified in Figure 3a. This may mean that internal interference take place with the live specimen. The boxed area (0.1 mm×0.1 mm) marked with the number 1 is the swimming bladder in which the tissue is transparent and exhibits increased brightness. The average of the data in the box 1 is 0.64. Box 2 shows the spinal cord position,and the average of the data in the boxed area (0.1 mm×0.1 mm) is 0.53. Box 3 shows the posterior cardinal vein position, and the average of the data in the box area (0.1 mm×0.1 mm)is 0.54. Figure 3b shows the absorption image processing outcome based on the PCA method. The 15 raw images were processed based on Equation (4)with the first principal component. The laser speckle character can also be found from the absorption image. The averaged values of boxes 1, 2, and 3 are 0.70,0.58,and 0.57,respectively.From the absorption image, it can be inferred that the intensive image is similar to the raw image at the same position. The flow signal is not outstanding.This is attributed to the fact that the first principal component only extracts the static speckle signal but does not completely remove the influence of laser speckle effect. Further studies will investigate and elucidate the speckle effect from the first principal component signal.Figure 3c shows the imaging outcomes when MD is used as the imaging parameter following processing based on Equation (5). Compared with Figure 3a, b,the averaged intensity values of the boxes 1, 2, and 3,are 0.12, 0.49, and 0.63, respectively. The intensity of the swimming bladder(box 1)has been declined.This means that the background static signal is eliminated.However, the flow signal of the posterior cardinal vein(box 3)has been improved considerably.
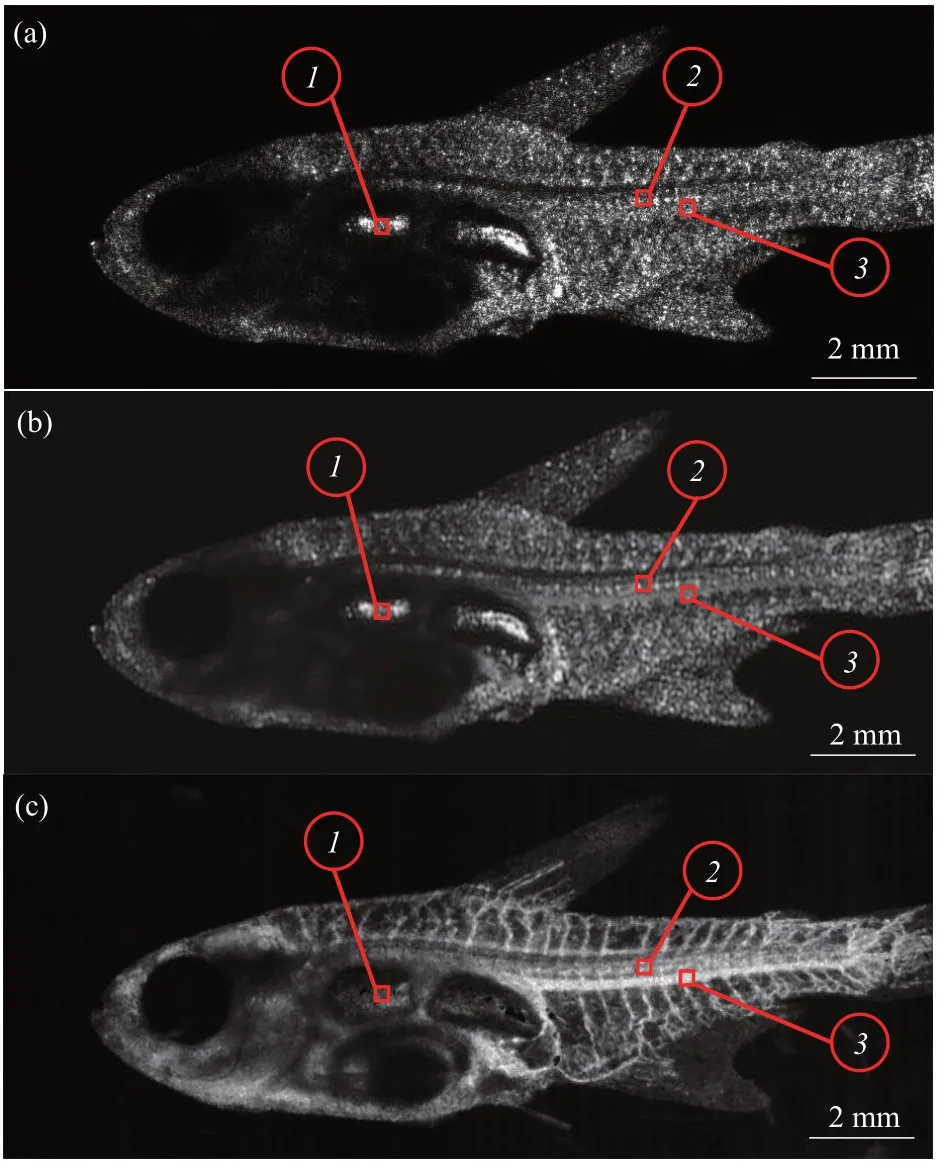
Fig.3 Various normalized two-dimensional(2D)images at the same projection position
Figure 4 shows the 3D experimental results for the zebrafish with the back-projection algorithm.Figure 4a and Supplementary movie S1 shows the 3D absorption image, the spinal cord and dorsal fins can be observed clearly, but the organ located in the abdomen cannot be reconstructed owing to the increased absorption. From the 3D absorption image,one can infer that the speckle pattern is attenuated considerably. The reason for this is attributed to the fact that the back-projection computation at different positions has superimposed the speckle effect at the trajectory light path. In other words, the filter backprojection algorithm can lead to a more consistent reconstruction absorption effect. Figure 4b and Supplementary movie S2 shows the 3D vascular distribution image of the specimen based on the reconstruction of the flow images extracted by the PCA method.In this reconstruction,the major vessels,such as the posterior cardinal, hepatic portal, and gonadal veins, and blood capillaries, such as the intersegment vessels, can be observed clearly. These outcomes have considerable reference value to life science research. Figure 4c and Supplementary movie S3 is the fusion of the 3D absorption and 3D vascular distribution images. Serial numbers1,2, and3represent the zebrafish swimming bladder, spinal cord, and posterior cardinal veins, as shown in Figure 3, respectively. As observed in the 3D fusion image,the swimming bladder disappeared. It is sheltered by the spinal cord in some projection positions. We consider that the reason for this is attributed to the flat shape of the specimen. However, the spinal cord and posterior cardinal vein can be clearly observed. Our results show that our method can realize the dualcontrast optical projection tomography for a live zebrafish. The 3D visualization of the blood-flow network and skeleton should be applied in physiological developmental studies for live model organisms.
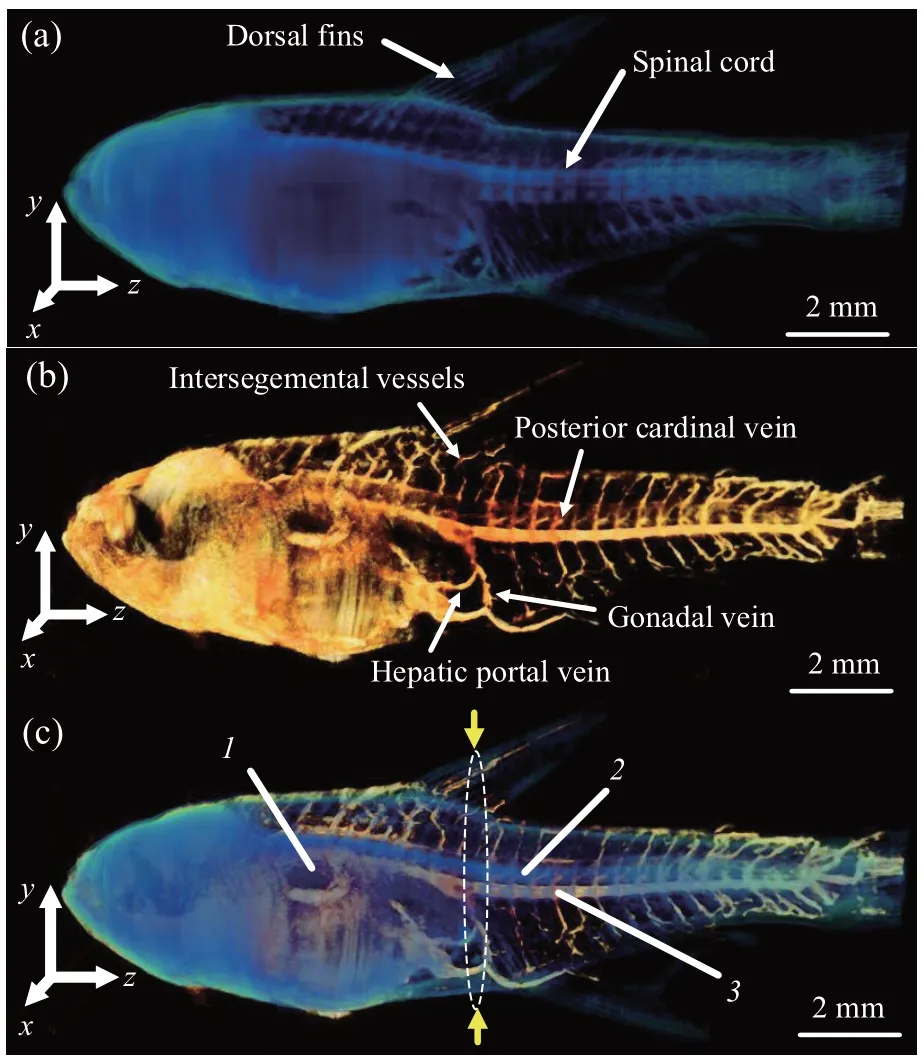
Fig.4 Three-dimensional(3D)diagram of experimental results
Figure 5 shows the images of the zebrafish section marked by a white dotted line, and the yellow arrows in Figure 4c. Figure 5a shows the absorption image slice map in which the skeleton distribution of the specimen was reconstructed. We can clearly observe the cross-sectional image of the spinal cord,dorsal, and ventral fin. Figure 5b shows the vascular distribution in this section in which the major vascular channels, such as the aorta and cardinal vein, hepatic portal vein, and the intersegment vessels (highlighted in red) can be clearly observed. Figure 5c shows the fused images shown in Figure 5a, b, The outcome shows details of the skeleton and the distribution of vascularity, and provides more comprehensive information for life science research. To evaluate the spatial resolution of this system, two curves are plotted in Figure 5d that show the fluctuations of the signals along the white line on Figure 5c. The red curve represents the blood flow signal of the specimen, and the black curve represents the skeleton signal. We cut across the half-amplitude and quarteramplitude lines in the red curve points inA,A', andB,B', respectively. |BB'-AA'|in Figure 5d is approximately 31.45 μm. Additionally, the value of the black curve in |DD'-CC'|is 24.05 μm[14].Compared with our previous method[6], the experimental results show that our method can not only achieve the 3D visualization of bones with a lower number of frames, but also acquire the highresolution 3D blood flow network imaging in the same optical system.
Although the proposed method simultaneously achieves dual-contrast optical projection tomography,it is only suitable for the case that the sample is nearly transparent, thickness uniform, and the size is within the depth of field. There are some improvements should be further considered in our future study. DCOPT can highlight 3D skeleton and blood flow of microbial specimens simultaneously. But we admit there is an entanglement relationship between the extracted static signals and absorption or scattering coefficient, we should verify it in the future work. In the current experiment, we used a glass tube (n=1.5)in water (n=1.33) to match the refractive index. In order to obtain higher accuracy refractive index match, the FEP tubes (n=1.37) will be used in future experiments.
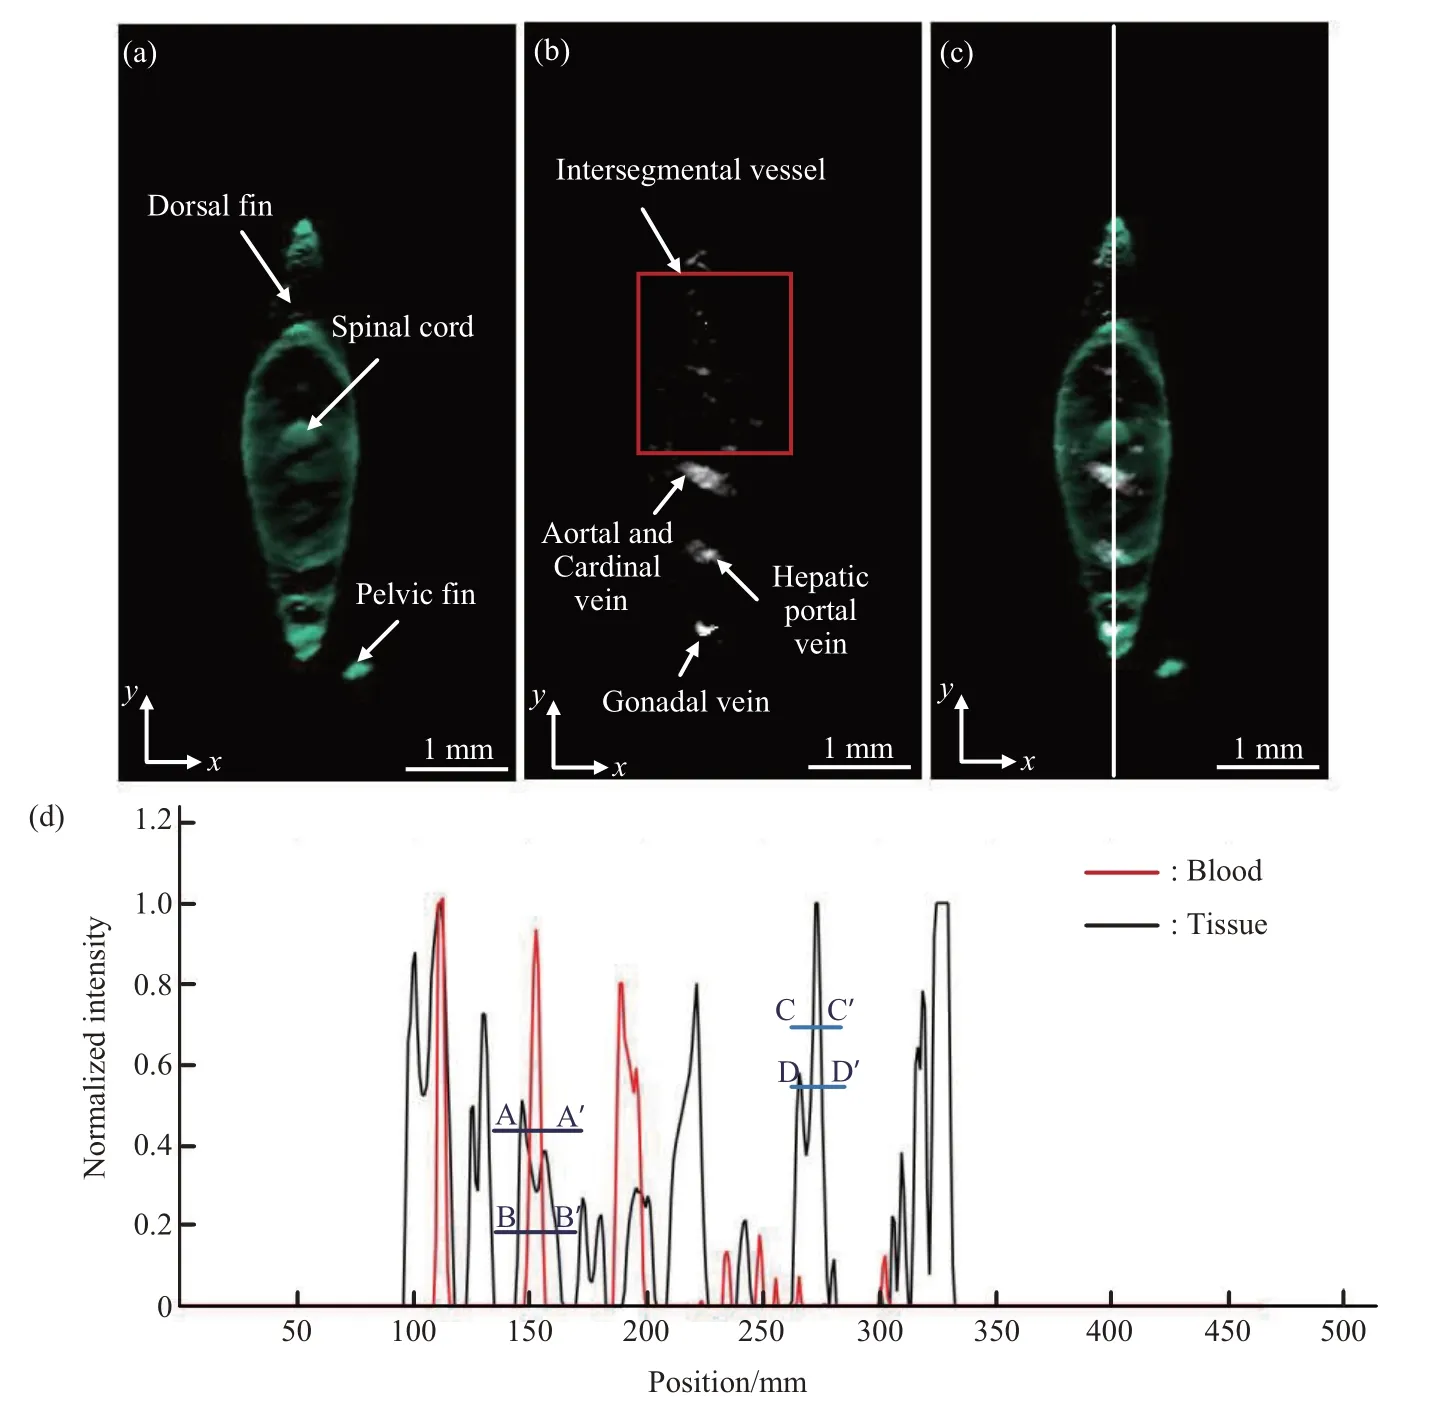
Fig.5 The images of the zebrafish section marked by a white dotted line,and the yellow arrows in Figure 4c
4 Conclusion
We propose a dual-contrast optical projection tomography method to simultaneously acquire a 3D visualization of the blood-flow network and skeleton.2D absorption and flow images of each projection position are extracted based on the separation of dynamic blood flow signals from static background signals. 3D blood flow network and bone were reconstructed by the filtered backprojection algorithm.The innovation of this method is that we use the idea of static background signal and dynamic blood flow signal separation to realize the fast, simultaneous,dual-contrast 3D images of the blood-flow network and skeleton. The experimental results in live biological specimens prove the feasibility of our method and may have potential applications in physiological developmental studies of live model organisms.
SupplementaryPIBB_20210124.Movie_S1-S3.mpg are available online (http://www.pibb.ac.cn or http://www.cnki.net).
