
The Identification of Common Potential Biomarkers and Mechanism for Two Types of Renal Cancer*
2022-04-24 06:15NIERenQingTANGTangZHANGXiaoYiZHANGJin
生物化学与生物物理进展 2022年4期
NIE Ren-Qing,TANG Tang,ZHANG Xiao-Yi,ZHANG Jin
(The Faculty of Environment and Life Science,Beijing University of Technology,Beijing 100124,China)
Abstract Objective Renal cell carcinoma is a malignant tumor originating from the renal tubular epithelial system.In the field of miRNA biomarkers for renal cancer, many previous researches had ignored the large gap in the amounts of samples between different subtypes of renal cancer, this may lead to differences in the diagnostic ability of selected miRNA biomarkers among patients with different subtypes of renal cancer, and may cause missed diagnosis and misdiagnosis. Therefore, we considered two subtypes of kidney cancer common markers for the study. Methods Statistics and two machine learning methods were performed to screen the expression profile data of clear renal cell carcinoma(ccRCC,KIRC)and papillary renal cell carcinoma(pRCC,KIRP)respectively and the results were intersected to obtain common miRNA markers for both types of kidney cancer. Then, ROC curve was used to verify the diagnostic ability of these biomarkers, machine learning methods using external data set (KICH) were also conformed to these biomarkers, the two methods further proved that these miRNA biomarkers’ diagnostic ability and avoided overfitting. The rationality of these biomarkers was also verified by existing experimental literature. The molecular mechanisms of miRNA markers were investigated using bioinformatics methods. Results A total of 6 common miRNA markers for both types of kidney cancer were obtained (miR-21, mir-210, mir-185, mir-188, mir-362, mir-199a-2), 4 of them have been reported to be associated with renal cancer. Mir-188 and mir-199a-2 have not been reported to be associated with renal cancer, and maybe novel miRNA biomarkers of renal cancer. Then, we performed bioinformatic analysis on these 6 miRNA biomarkers, the results showed that the newly discovered biomarkers(mir-188 and mir-199a-2),were involved in the regulation of two renal cancer related pathway,MAPK signaling pathway and TGF-β signaling pathway. The differential expression of miRNA and its target genes in the pathway was verified, which further proved the reliability of miRNA as a marker and its regulatory effect on target genes. Also a possible mechanism of how 9 target genes of mir-185 (all belonging to the UGT1A gene family) participate in renal cancer was found, and there was no related literature. Conclusion The present study identifies possible new common miRNA markers for both types of kidney cancer and discovers a mechanism of kidney carcinogenesis that has not been seen in kidney cancer-related fields.
Key words miRNA,renal cell carcinoma,diagnostic biomarker,bioinformatics,machine learning
Renal cell carcinoma (RCC) is a malignant tumor originating from the renal tubular epithelial system, it is one of the most common urinary system tumors in adults[1]. According to WHO, RCC is divided into 14 subtypes by their histopathological features, the most conventional type is clear-cell RCC(ccRCC), it accounts for approximately 75% of the incidence of RCC, the second conventional type is papillary RCC (pRCC), it accounts for approximately 10% of the incidence of RCC, the rest of the types,e.g.chromophobe RCC and oncocytoma RCC,accounts for the rest 15% of the incidence of RCC[2].The prognosis of RCC is related to the stage of this disease, the overall 5-year survival rate of the RCC patients is 74%, the survival rate for late stage RCC patients are 53%, and the survival rate for metastatic RCC patients is only 8%[3]. Like most cancers, RCC usually does not show significant clinical symptoms in its early stages, many patients are detected by an incident on their radiographic examination,at the time these patients may be in the late stage of RCC[4].This is partial because of the low sensitivity and specificity of traditional diagnostic methods[5].Therefore,a novel diagnostic method that can easily detect RCC is urgently needed.
MicroRNA (miRNA) is a kind of small noncoding RNA, current studies demonstrated that miRNAs can affect gene expression at the posttranscription level[6]. Recent studies have suggested that miRNA is an ideal tumor diagnostic marker because it has some excellent characteristics such as stable presence in body fluids, blood and human tissues, and is not easy to be degraded[7].Also, studies have shown that miRNAs are related to the development[8]and prognosis[9]of RCC. The study of Chanet al.[8]shows that down-regulation of miR-381 promotes the growth of cells and restrains the ccRCC cell apoptosis, and the inhibition of miR-381 promotes chemo-resistance.Mytsyket al.[9]found that miR-15a is significantly up-regulated in tumor tissues and is strongly associated with poor histologic prognostic features of ccRCC, they concluded that the tissue expression of miR-15a can be used as a potential prognostic biomarker for RCC. These studies indicate that miRNAs may involve in multiple biological processes related to RCC and have great research value.
However, because of the high incidence of ccRCC, the other subtypes of RCC such as pRCC do not have as many related studies as ccRCC. Also, in the data sets of The Cancer Genome Atlas (TCGA),ccRCC has more samples than other RCC subtypes(Table 1), thus the biomarker identified by mixed data sets of different subtypes of RCC[10]may have gaps in the diagnostic ability for different subtypes of RCC.Also, the common mechanism of occurrence and development among different subtypes of RCC is currently unknown, finding reasonable common biomarkers and biological pathways between them could provide support for future research, for example, common treatment and drugs for different subtypes of RCC.

Table 1 The amounts of samples of three subtypes of RCC in TCGA database
Considering these problems,the main idea of this study is to take the intersection of the results of ccRCC data set and pRCC data set in every step, and eventually find useful common diagnostic biomarkers for ccRCC and pRCC. Firstly, statistical methods were used to identify common significant differentially expressed (SDE) miRNAs from two TCGA data sets. Secondly, machine learning methods were used to further select important SDE miRNAs.Thirdly, three verification methods were used to verify the diagnostic ability and biological reliability of these miRNAs. Lastly, bioinformatic analysis,e.g.biological pathway enrichment analysis and gene ontology enrichment analysis, were performed on candidate miRNA biomarkers and their target genes.
1 Materials and methods
1.1 Downloading and pre-processing of miRNA expression data
The miRNA expression data of human ccRCC and pRCC were downloaded from the official website of TCGA. These two types of RCC were also marked as KIRC and KIRP in the data sets of TCGA,to avoid ambiguity and ensure the consistency of the names in data processing, we will use this version of name as the name of data sets in the sections below.
After the data sets were downloaded, miRNAs which have more than 20% missing values were removed. Then, the mean-value method was used to fill in the remaining missing values. Lastly, thezscore method was used to replace abnormal values and normalize the data sets, the formula ofz-score is as below (μrepresents mean value,σrepresents standard deviation).

1.2 Identification of common significant differentially expressed miRNAs
Firstly, theP-value of the miRNAs was calculated using the Kolmogorov-Smirnov test (K-S test)[11]. K-S test was a non-parametric test, it can test if there was a significantly different distribution of two sample sets, in this study, it was used to test whether miRNAs were significantly differentially expressed between tumor samples and normal samples.
Secondly, the volcano plots method was used to visually show the expression pattern of the miRNAs.The first parameter of the volcano plots was thePvalues calculated by the K-S test and the second parameter was the expression quantity fold-change(FC) between tumor samples and normal samples.The criteria of SDE miRNA wasP-value <0.05 andFC>2 or <0.5.
Thirdly, in order to find out the common SDE miRNAs between ccRCC and pRCC, the SDE miRNAs screened out from KIRC and KIRP were intersected.
1.3 Screening important SDE miRNAs using machine learning methods
To screen out miRNAs with more credible potential diagnostic ability, two machine learning methods were used in order to further select miRNAs with higher importance than others. These two methods are both based on random forest algorithm,but the parameters they use to screen features are different, so they can measure the importance of miRNAs in different aspects.
The first method is called “mean decrease impurity”, the score of each miRNA is positive correlated with the decreases it does to the weighted impurity in a tree model. The miRNA with higher score in this method indicates that it can separate two types of samples more effectively.
The second method is called “mean decrease accuracy”, the idea of this method is to disrupt the order of the values of each miRNA and then calculate the impact on the accuracy of the model. Obviously,for the more important miRNAs, this impact should be bigger than those less important miRNAs. The miRNA with higher score in this method indicates that it can separate two types of samples more accurately.
The common SDE miRNAs selected in the previous part were evaluated using the two methods for KIRC and KIRP data sets separately, the intersection of top 15 miRNAs of each method were selected as the important SDE miRNAs in each data set. Then, the intersection of the important miRNAs of both KIRC and KIRP data sets were selected as common important SDE miRNAs. These common important SDE miRNAs were defined as candidate miRNA biomarkers in this study.
This part of the study was performed using Python.
1.4 Validation of candidate miRNA biomarkers
Three different methods were used to verify the rationality and reliability of the candidate miRNA biomarkers, including receiver operating characteristic (ROC) curve method, machine learning model predictive method and literature verification method.
1.4.1 ROC curve method
The ROC curves of candidate miRNA biomarkers were plotted in the KIRC and KIRP dataset respectively in order to preliminarily verify their clinical diagnostic ability. The area under curve(AUC) value is positively related to the diagnostic ability of the miRNA, the miRNA with AUC value higher than 0.8 were considered as high diagnostic ability biomarkers.
1.4.2 Machine learning model predictive method
The candidate miRNA biomarkers were used as features for random forest model, and the model was trained in the KIRC and KIRP data sets respectively.
Meanwhile, in order to evaluate the generalizability of candidate miRNA biomarkers in the diagnosis of renal cancer and avoid possible overfitting, the expression profile data of chRCC, namely KICH data set (Table 1), was downloaded and used for third-party independent verification in this study.The process of download and preprocessing of KICH data set was the same as other two data sets. The diagnostic ability of these candidate miRNA biomarkers as combination markers was evaluated by the prediction accuracy of the model.
1.4.3 Literature verification method
Candidate miRNA biomarkers were used as key words in the search process of the Web of Science in order to find out the research literature in renal cancer related field, for the miRNA biomarkers with no current related literature in renal cancer field, they were further searched in the field of cancer. These results were obtained in December 2020.
1.5 Bioinformatic analysis
1.5.1 Target gene prediction of common important SDE miRNAs
In order to further study the relationship between these common important SDE miRNAs and kidney cancer, two databases, the Target-Scan database[12-16]and the miRDB database[17-18], were used to predict the target genes of these miRNAs.To make the results more credible, only those target genes which were predicted by both databases were accepted.
1.5.2 Pathway enrichment analysis and gene ontology enrichment analysis
This part of the study was performed using DAVID and its online analysis tools, the purpose was to find the target genes’ related pathways. First, a tissue enrichment analysis was performed in order to screen out the target genes which were located in kidney tissues. Second, pathway enrichment analysis and gene ontology analysis were performed using these kidney-enriched target genes, the results of this analysis were used for the rationality analysis of selected miRNAs and further explain the mechanism of how miRNAs participate in ccRCC and pRCC.
1.6 Expression profile validation of miRNAs and its target genes
MiRNA can control the expression of downstream gene targets.In order to further verify the reliability of selected miRNAs and the target genes of 2 novel miRNA biomarkers, the expression profiles were downloaded from the TCGA database and used to check the gaps of expression levels of miRNAs and genes between RCC and normal tissues.
1.7 External verification
External datasets GSE16441 from GEO was used to validate the reliability of the 2 novel miRNA markers. Microarray dataset GSE16441 (platform is GPL8659) contains 17 RCC tumors (do not distinguish between subtypes) and 17 corresponding non-tumor samples. And external datasets GSE15641 from the GEO database was used to validate the reliability of the 5 target genes. GPL96 [HG-U133A]Affymetrix Human Genome U133A Array was used to extract the gene transcriptional expression profile information of the GSE15641 dataset. The GSE15641 dataset contains 23 normal tissue samples, 32 ccRCC tissue samples, 11 pRCC tissue samples, 6 chromophobe RCC tissue samples (chrRCC), 12 oncocytoma tissue samples (OC), and 8 transitional cell carcinoma tissue samples (TCC). We selected all normal tissue samples, ccRCC tissue samples and pRCC tissue samples from the GSE15641 to verify the reliability of the 5 target genes.
2 Results
2.1 Data processing
The original data sets were downloaded from the TCGA official website. There were 615 samples and 1 881 miRNAs in the data set of KIRC, and 325 samples and 1 881 miRNAs in the data set of KIRP.After removing miRNAs that have more than 20%missing values, there were 344 miRNAs left in the data set of KIRC and 388 miRNAs left in the data set of KIRP(Figure 1).

Fig.1 The amounts of samples and miRNAs in two data sets
2.2 Screening important SDE miRNAs
The volcano plots method showed 70 upregulated and 38 down-regulated SDE miRNAs in KIRC data set(Table S1a,Figure 2a),50 up-regulated and 74 down-regulated SDE miRNAs in KIRP data set(Table S1b,Figure 2b).
The intersection of the above two volcano plots results were 42 common SDE miRNAs (Figure 3,Table S1c).
2.3 Identification of common important SDE miRNAs
Two machine learning methods, mean decrease impurity and mean decrease accuracy, identified 14 important SDE miRNAs in the KIRC dataset (Table S2a)and 13 important SDE miRNAs in the KIRP data set (Table S2b). The common important SDE miRNAs were the intersection of important SDE miRNAs for KIRC and KIRP (Figure 4), the 6 common important SDE miRNAs, yellow dots with outlined red or green circle, including 3 up-regulated miRNA (mir-185, mir-21 and mir-210) and 3 downregulated miRNA(mir-188, mir-199a-2 and mir-362).These 6 miRNAs were defined as candidate miRNA biomarkers for ccRCC and pRCC in this study.
2.4 Verification of common important SDE miRNAs
2.4.1 The result of ROC curve method
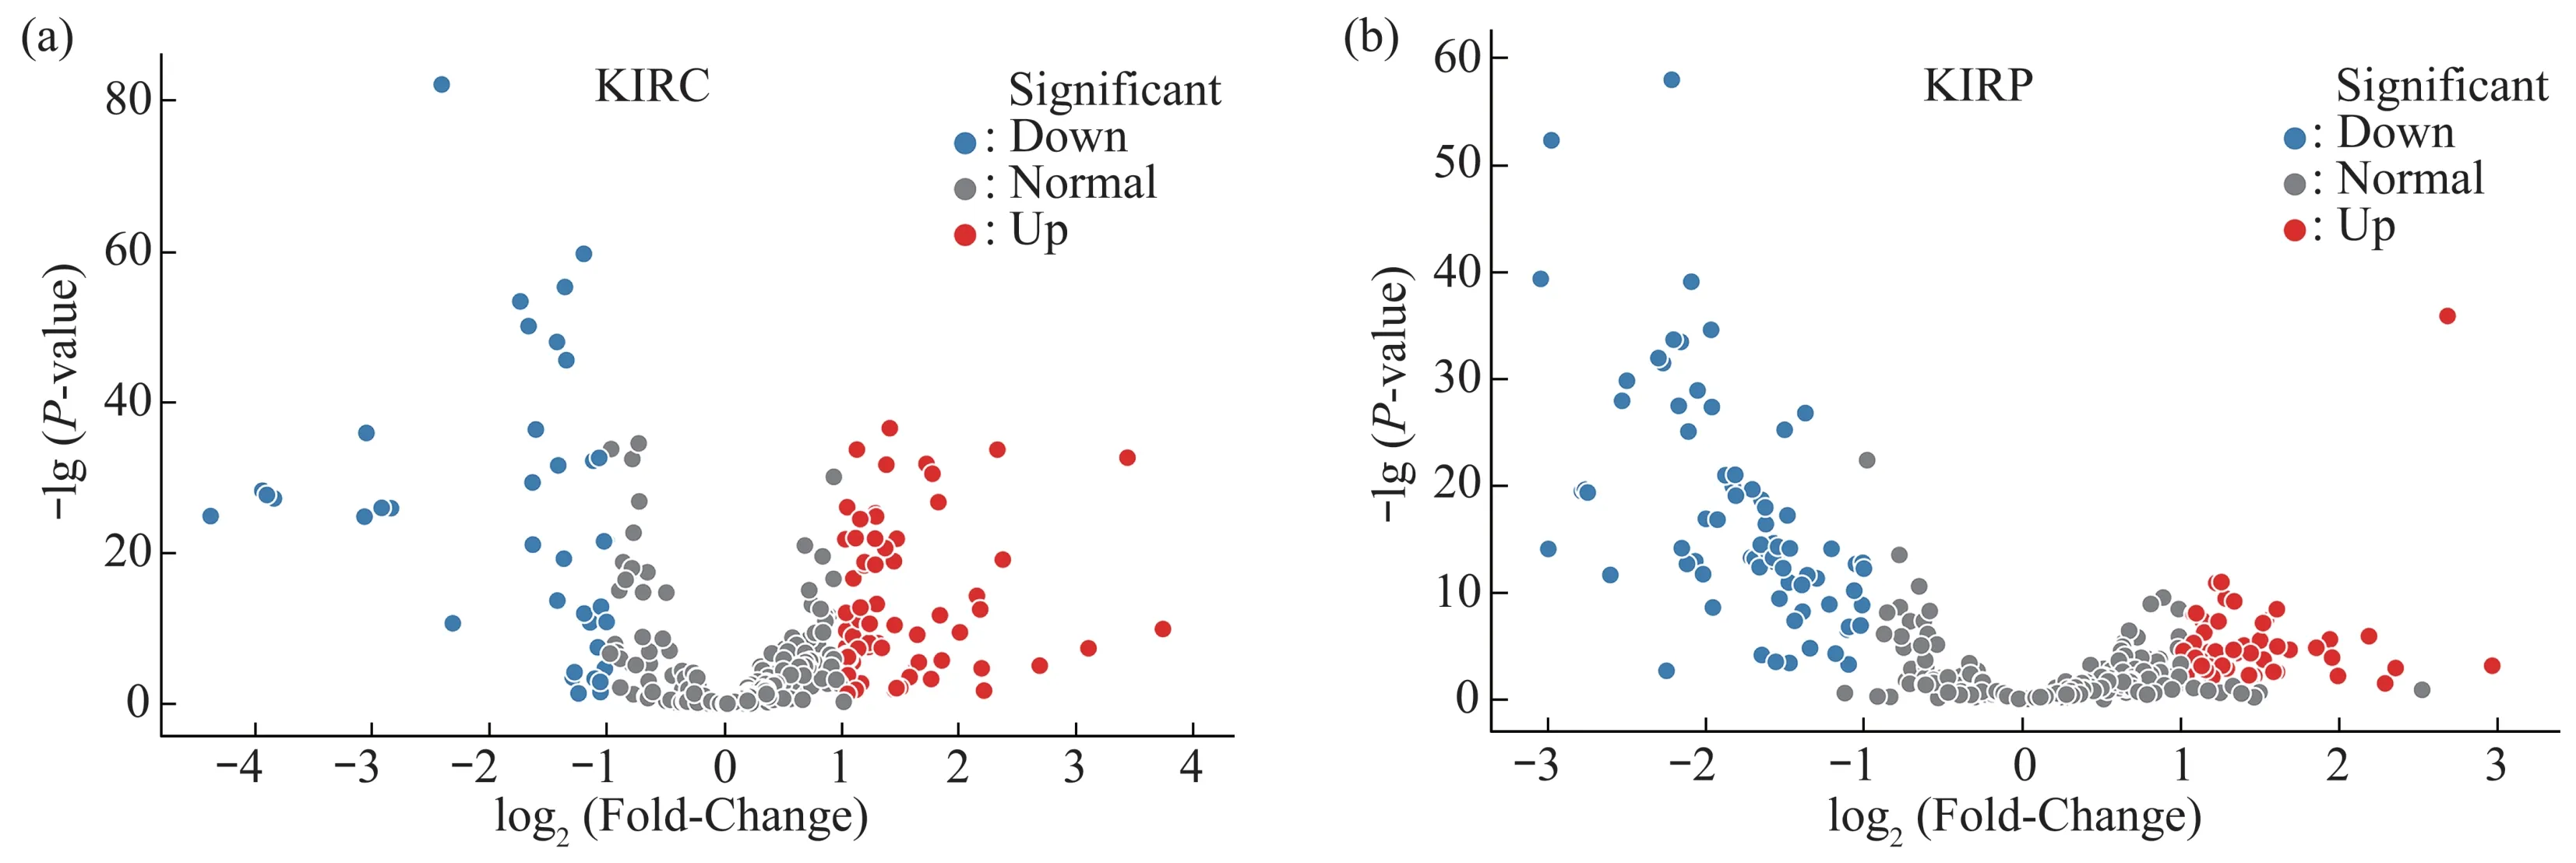
Fig.2 The volcano plots for KIRC and KIRP data sets

Fig.3 The intersection of the above two volcano plots results

Fig.4 The intersection of important SDE miRNAs for KIRC and KIRP

Fig.5 ROC curve of candidate miRNAs for KIRC and KIRP dataset
As can be seen from Figure 5,the AUC values of the 6 candidate miRNA biomarkers were all greater than 0.8 in both KIRC and KIRP data set, indicating that each individual candidate miRNA biomarker has a good diagnostic ability and has the potential to become a diagnostic biomarker of two subtypes of renal cancer.
2.4.2 The result of machine learning model predictive method
The accuracy score for KIRC, KIRP and KICH data sets were 0.978, 0.979 and 0.964, respectively.The AUC score for KIRC, KIRP and KICH data sets were 0.998, 0.999 and 0.989, respectively (Table 2).The results showed that these 6 candidate miRNA biomarkers have strong diagnostic ability as a combination feature, both in terms of accuracy score and AUC score. Moreover, in the data set of the independent third subtype of RCC, KICH, they also showed good performance, which indicates that these miRNA biomarkers have strong diagnostic ability for other subtypes of RCC besides the subtypes KIRC and KIRP.

Table 2 Random forest verify results of candidate biomarkers
2.4.3 The result of literature verification method
The result showed that in the kidney cancerrelated field, there was 32 literature related to mir-21,5 literature related to mir-185, 19 literature related to mir-210 and 1 literature related to mir-362 (Table 3).For mir-188 and mir-199a-2, there was no related literature in the kidney cancer-related field, but they did have related literature in the cancer-related field.Carlssonet al.[19]found that mir-21 were differentially expressed in RCC tissues using RT-qPCR.Experimental literature using RT-qPCR found that the expression levels of mir-185 were significantly differentially expressed in RCC tissues[20].Experimental research of Zhanget al.[21]found that the expression levels of mir-210 were significantly higher in the serum samples of ccRCC. Using RTqPCR, Zouet al.[22]found that mir-362 was downregulated in RCC tissues samples. The results of the above experimental literature also support the reliability of the markers we found.

Table 3 The literature search result of candidate miRNA biomarkers
2.5 Bioinformatic analysis
To make the predicted results more credible and further discover the mechanism, bioinformatic analysis was performed on the target genes of the 6 candidate miRNAs biomarkers.
Firstly, two databases were used to predict target genes of the 6 miRNAs, then intersection was taken.A total of 2 864 target genes were obtained.
Secondly, a tissue enrichment analysis was performed on the 2 864 target genes. there were 303 genes enriched in kidney tissues, all the further bioinformatic analyses were based on these 303 genes.
Lastly, pathway enrichment was performed, 56 genes were identified to be related to multiple biological pathways including several cancer-related pathways(Figure 6).
Among these enriched pathways withP-value≤0.05, three of them, namely the MAPK signaling pathway, TGF-β signaling pathway and thyroid hormone signaling pathway,were proved to be related to RCC[23-26].As for the 2 candidate miRNAs,mir-188 and mir-199a-2,which have no related literature in the kidney cancer-related field, we found that both mir-188 and mir-199a-2 participate in the MAPK pathway, besides, mir-199a-2 participates in the TGF-β pathway. These 2 miRNAs may be the new diagnostic biomarkers for ccRCC and pRCC.Additionally,it was found that there are 9 downstream target genes of mir-185 which were all members of the UGT1A gene family and involved in the formation of UDP-glucuronidase. mir-185 has been reported to be associated with kidney cancer through DNMT1/MEG3 pathway[27], however, these 9 genes have not yet been reported to be associated with renal cancer.
Further analysis and discussion will be concentrated on those 9 UGT1A genes and the two pathways related to the newly found miRNAs.

Fig.6 Pathway enrichment results of target genes
2.6 Expression profile validation of miRNAs and its target genes
The expression levels of 6 miRNA biomarkers were shown in Figure 7.
As can be seen from the figure above, in both ccRCC and pRCC, all the 6 miRNA biomarkers were significantly differentially expressed between cancer and normal samples.

Fig.7 Expression levels of miRNA biomarkers in two subtypes of RCC and normal samples
The expression levels of the two novel miRNA biomarkers’ target genes (TAB2, MAPK13,ACVR1B,CD40,NR3C2)is shown in Figure 8.
As can be seen from the figure above, the target genes of two novel miRNA biomarkers were also significantly differentially expressed between cancer and normal samples in the TCGA dataset, except MAPK13 (P=0.06). However, Yasudaet al.[28]found that the expression levels of MAPK13 is significantly up-regulated in RCC tissues,this result was proved by RT-qPCR.Thus, the reliability of MAPK13 still needs further verification. It is known that differential expression of miRNA will inevitably lead to differential expression of target genes regulated by miRNA.The above results showed that the expression levels of the two novel miRNA biomarkers, mir-188 and mir-199a-2, and their target genes were significantly differentially expressed in both types of RCC tissues. This further demonstrates the reliability of these biomarkers and their target genes.
2.7 External verification
In the external validation dataset GSE16441, 2 novel miRNA biomarkers, mir-188 and mir-199a-2,were significantly differentially expressed in tumor samples and normal samples, and the expression levels of them were lower in tumors samples than in normal tissues(Figure 9a).
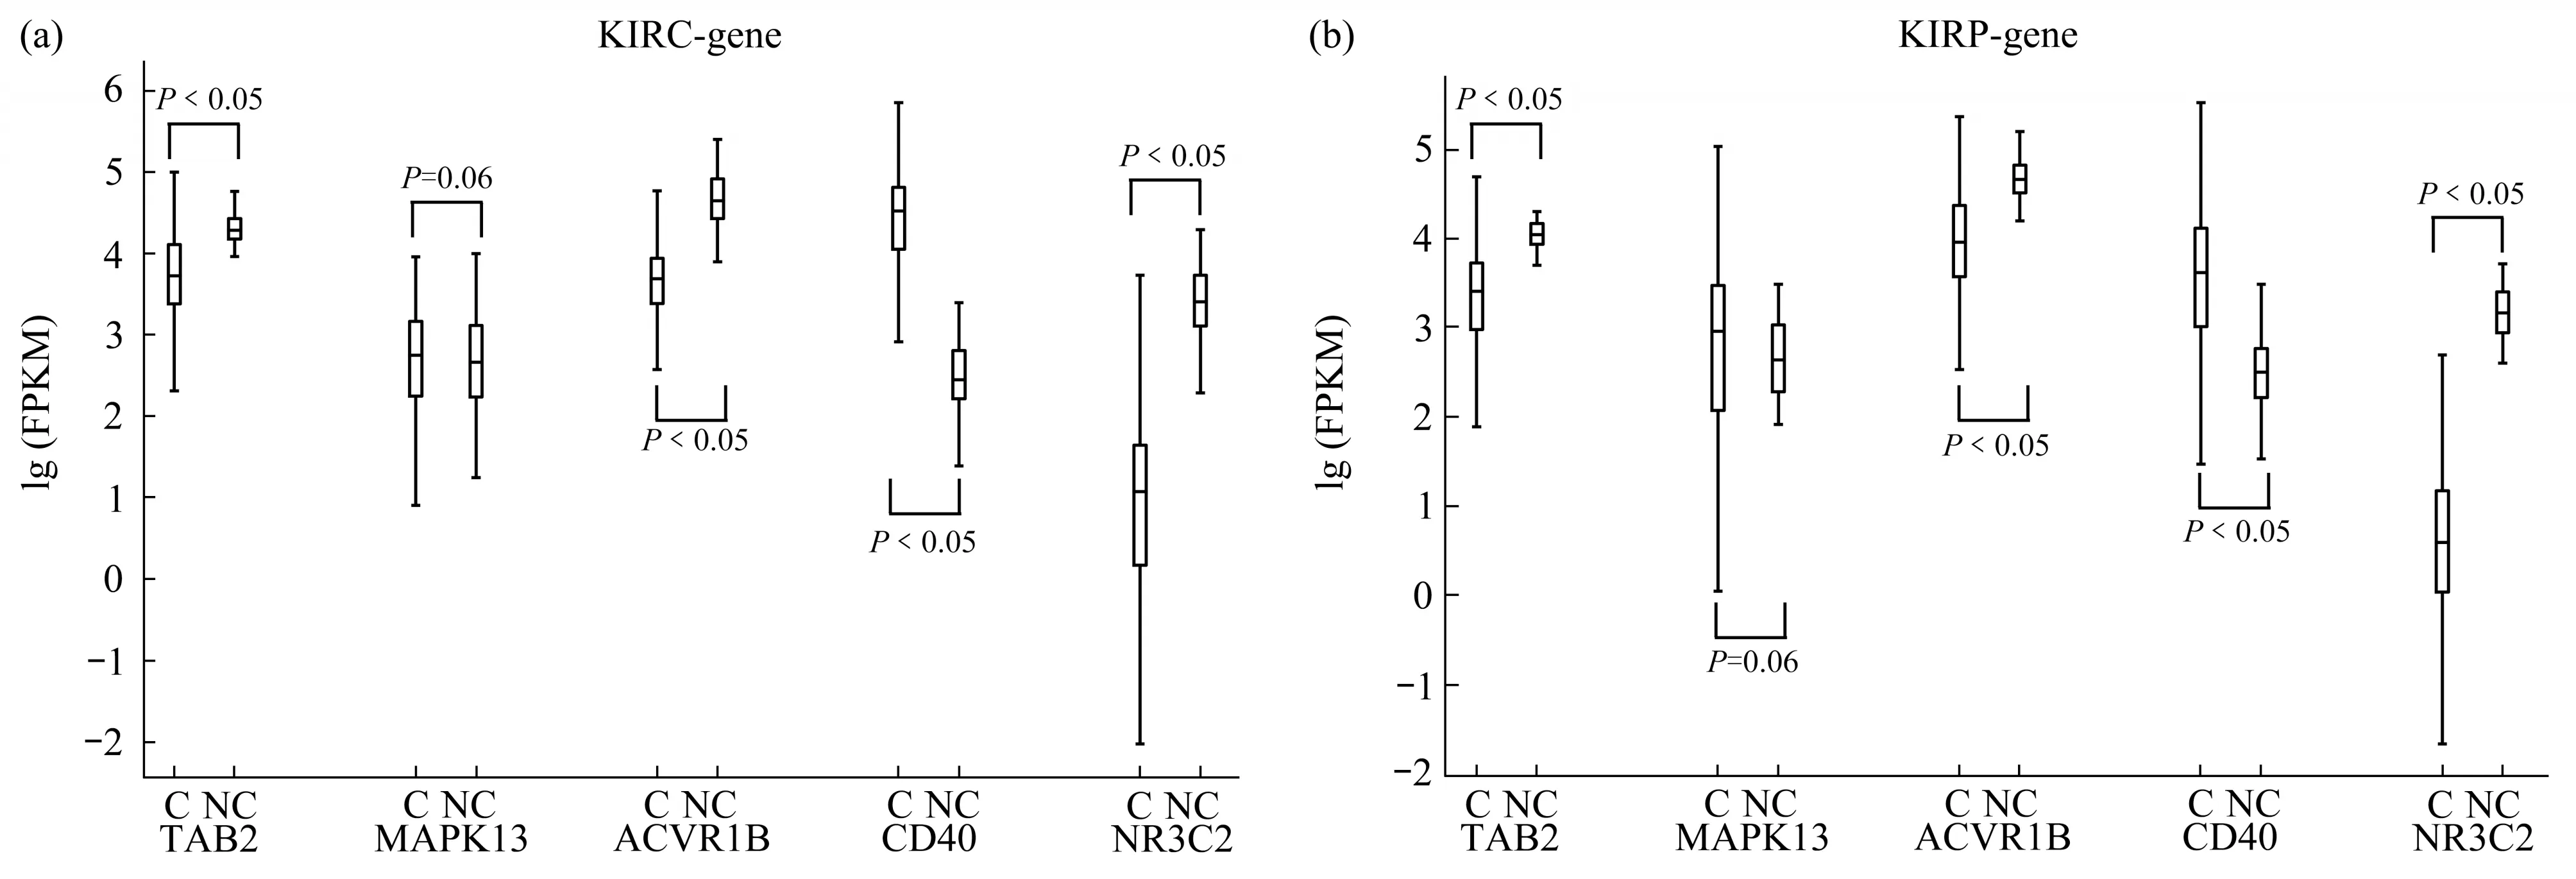
Fig.8 Expression levels of novel miRNA biomarkers’target genes in RCC and normal samples in the TCGA dataset and the GEO dataset
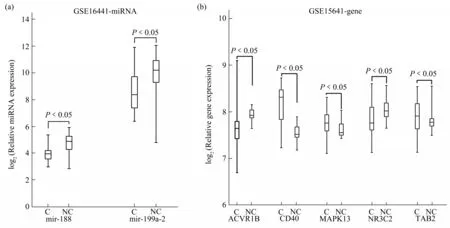
Fig.9 External verification of the 2 novel miRNA biomarkers and the 5 target genes of them
In the external dataset GSE15641, the target genes of the 2 novel miRNA biomarkers were all significantly differentially expressed between tumor and normal samples(Figure 9b).
3 Discussion
As mentioned before, two miRNAs were found to be candidate novel biomarkers for ccRCC and pRCC, their downstream target genes were involved in two RCC-related pathways, namely MAPK signaling pathway and TGF- β signaling pathway.Mir-185, another miRNA biomarker found in the study, has been reported to be associated with RCC,and 9 target genes of it were found to be involved in the formation of UDP-glucuronidase, but UDPglucuronidase did not has any RCC-related literature,thus the relationship between these 9 genes, UDPglucuronidase and RCC will be further discussed in this section.
3.1 MAPK signaling pathway
Six miRNAs were eventually screened out as common important SDE miRNAs for ccRCC and pRCC. Among them, there were totally 5 miRNAs,mir-199a-2, mir-185, miR-21, mir-210 and mir-188,involved in the MAPK signaling pathway, including two newly discovered miRNA biomarkers,mir-199a-2,and mir-188. The MAPK signaling pathway controls many biological processes, some of which are longterm and complex processes, such as embryogenic cell differentiation, cell proliferation and cell death,and some of which are short-term processes, such as homeostasis regulation and rapid hormonal responses[29]. The association between the MAPK signaling pathway and the development of RCC has been widely demonstrated[25,30-31]. MAPK13 gene(target gene of mir-188)encodes p38 protein,which is a MAP kinase and one of the key nodes in the MAPK pathway, it is extensively involved in the inflammatory response of cell proliferation,differentiation and cell circulation. Previous studies have shown that the overexpression of p38 can promote the proliferation, differentiation and invasion of renal cancer cells[32]. TAK1-binding protein 2(TAB2) is encoded by the TAB2 gene (target gene of mir-199a-2) can mediate the activation process between TAK1 and TRAF6, and the overexpressed TAK1 can effectively activate the p38 pathway; the p53 protein encoded by TP53 gene (target gene of mir-21) is one of the downstream substrates of p38,and p38 can phosphorylate p53 and participate in the regulation of cell apoptosis.The schematic diagram of the MAPK signaling pathway consists of miRNA biomarkers’ target genes is presented in Figure 10.

Fig.10 Schematic diagram of MAPK signaling pathway consists of miRNA biomarkers’target genes
3.2 TGF-β signaling pathway
There were 3 miRNAs involved in the TGF-β signaling pathway, mir-362, mir-21 and mir-199a-2,including one newly discovered miRNA biomarker,mir-199a-2. TGF-β signaling pathway also controls many cellular processes, such as cell proliferation,recognition, differentiation and apoptosis,etc. TGF-β signaling pathway related regulatory processes widely exist in tissues from the embryonic stage to the mature body[33]. Recent literature has demonstrated the association between the TGF-β signaling pathway and RCC[23-24,34]. The protein encoded by the ACVR1B gene (target gene of mir-199a-2) is activin receptor I (ActivinRI), and its ligand molecule is activin, which is also a member of the TGF-β family.Once ActivinRI bind to bone morphogenetic protein(BMP), it will be activated and cascade to activate downstream receptor-regulated Smad (R-Smad),namely Smad2/3, and the activated R-Smad will transfer to the nucleus and combine with other molecules such as co-Smad, co-activators and DNAbinding factors to form Smad complex, the complex will eventually bind to DNA and play a regulatory role.Smad2/3 signaling pathway is associated with the differentiation and migration of renal cancer cells,and when this signaling pathway is inhibited, the differentiation and migration of renal cancer cells are also inhibited[24].The schematic diagram of the TGF-β signaling pathway consists of miRNA biomarkers’target genes is presented in Figure 11.
3.3 UDP-glucuronosyl transferase

Fig.11 Schematic diagram of TGF-β signaling pathway consists of miRNA biomarkers’target genes
The downstream target genes of mir-185 included 9 genes that belong to the UGT1A gene family (UGT1A1, UGT1A3, UGT1A4, UGT1A5,UGT1A6, UGT1A7, UGT1A8, UGT1A9 and UGT1A10), the proteins encoded by them jointly participate in the formation of UDP-glucuronosyl transferase(UGT).Studies of UGT mainly focused on its detoxification effect on exogenous compounds(especially drugs), and some experimental studies have also proved the association between UGT1A and the occurrence and development of cancer, including ovarian cancer[35], liver cancer[36], stomach cancer[37],pancreatic cancer[38]and bladder cancer[39]. No literature was found on the correlation between the UGT1A gene family and the occurrence and development of renal cancer, but some studies have shown that the UGT1A gene family is related to the drug resistance of renal cancer patients[40-41]. UGT is a cell membrane binding enzyme that catalyzes the transfer of uridine diphosphoglucuronic acid(UDPGlcA) to the functional groups of specific substrates (such as hydroxyl, carboxyl and amino),this glucuronidation can polarize exogenous substances, drugs or endogenous compounds, making them more easily to be excreted from the body.Although the liver is considered to be the main site where the process of gluconaldeation occurs, UGT is widely found in the brain, prostate, kidney and other tissues, indicates that these organs can also affect the whole body’s gluconaldeate ability. UGT plays a role in a variety of metabolic pathways, and studies have shown that when the expression of UGT is abnormal,it may alter an individual’s susceptibility to diseases such as cancer[42]. A study of colorectal cancer elucidated the mechanism by which UGT1A subtype molecule UGT1A_i2s participates in several metabolic pathways through a complex network of protein interactions and ultimately affects the metabolism of cancer cells[43]. One molecule that plays an important role in this mechanism is pyruvate kinase M2 (PKM2), a glycolytic enzyme that is also a key metabolic regulator in the body. PKM2 can prioritize the decomposition of glucose into lactic acid, this process can provide necessary energy and precursor substances for the synthesis of nucleic, acid amino acids and lipids by cancer cells,thus promoting the division of cancer cells. Also in this study, it was found that cancer cells lacking UGT1A_i2s showed stronger migration and invasion ability, and the metabolic process of cancer cells shifted from oxidative metabolism to glycolysis. This study also showed that this change was related to the increased PKM2 activity, suggesting that UGT1A_i2s may be a regulatory factor of PKM2.
At present, the specific mechanism of the UGT1A gene family involved in renal cancer has not been reported by the literature, however, because UGT1A and UGT1A_i2s also exist in kidney tissues,and studies have shown that PKM2 expression levels are significantly different between renal cancer tissues and normal tissues[44]. Therefore, our study speculated that this mechanism may also exist in renal cancer,but this hypothesis still needs further verification.
Finally, an integrated miRNA-gene-pathway map was constructed using Cytoscape (Figure 12), this figure can visually show the relationship between miRNAs,genes and pathways they enriched.
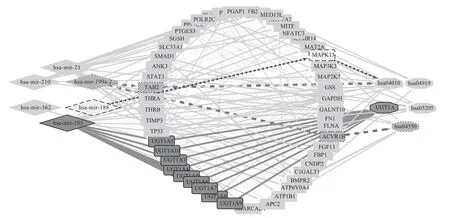
Fig.12 Integrate miRNA-gene-pathway map
4 Conclusion
By using statistical and machine learning methods, 6 common important SDE miRNAs of ccRCC and pRCC were found, including 2 miRNAs that were not yet reported to be associated with RCC.These miRNAs and their target genes participate in two cancer-related pathways, namely MAPK signaling pathway and TGF-β signaling pathway, and can provide new ideas for further RCC studies. They may also be used as new diagnostic biomarkers or therapeutic targets for RCC. Additionally, a hypothesis that the UGT1A gene family participates in RCC through UGT1A_i2s and PKM2 was also given out in this study.
SupplementaryPIBB_20210170_Table_S1-S2.xlsx are available online (http://www.pibb.ac.cn or http://www.cnki.net)
