融合多尺度特征的冬小麦空间分布提取方法
陈芳芳,宋姿睿,张景涵,王梦楠,吴门新,张承明,3,李 峰,柳平增,5,6,杨 娜
·研究速报·
融合多尺度特征的冬小麦空间分布提取方法
陈芳芳1,宋姿睿1,张景涵1,王梦楠1,吴门新2,张承明1,3※,李 峰4,柳平增1,5,6,杨 娜7
(1. 山东农业大学信息科学与工程学院,泰安 271018;2. 国家气象中心,北京 100081;3. 山东省数字农业工程技术研究中心,泰安 271018;4. 山东省气候中心,济南 250031;5. 山东农业大学农业大数据研究中心,泰安 271018;6. 农业农村部黄淮海智慧农业技术重点实验室,泰安 271018;7. 航天宏图信息技术股份有限公司,北京 100093)
获取到高质量的特征是从遥感影像中提取高精度的农作物空间分布的关键,该研究针对利用哨兵2A(Sentinel-2A)影像提取高精度的冬小麦空间分布开展研究。针对影像中存在的数据空间尺度不一致的问题,以生成式对抗网络为基础建立了降尺度模型REDS(Red Edge Down Scale),用于将B5、B6、B7、B11 4个通道的空间分辨率从20 m降为10 m;然后利用卷积神经网络构建了逐像素分割模型REVINet(Red Edge and Vegetation Index Feature Network),REVINet以10m分辨率的B2、B3、B4、B5、B6、B7、B8、B11,以及提取出的增强植被指数、归一化植被指数和归一化差值红边指数组合作为输入,进行逐像素分类。选择ERFNet、U-Net和RefineNet作为对比模型同REVINet开展对比试验,试验结果表明,该研究提出的方法在召回率(92.15%)、查准率(93.74%)、准确率(93.09%)和F1分数(92.94%)上均优于对比方法,表明了该研究在从Sentinel-2A中提取冬小麦空间分布方面具有明显的优势。
卷积神经网络;降尺度;Sentinel-2A;冬小麦空间分布;EVI;NDVI;NDRE1;红边波段
0 引 言
目前,中等分辨遥感影像已经成为提取大范围农作物空间分布的主要数据源[1],但由于中等分辨率遥感影像上农作物的特征不明显,特征提取难度较大,如何合理组织数据并设计一种有效的特征提取方法,以提取出高质量的特征,是从中等分辨率遥感影像中准确提取农作物空间分布的关键。
在遥感影像中,不同作物在可见光波段范围内,表现出的特征比较相近,但在红边波段上却存在明显的差异[2],综合使用可见光波段和红边波段等数据,能够有效提高结果精度[3]。由于Sentinel-2A图像中红边波段与可见光波段分辨率不同,通常需要对红边波段进行降尺度处理。传统的降尺度方法包含基于重建、基于学习和基于插值等,其中基于插值的方法较为常用[4],结果图像的边缘容易出现模糊现象[5]。与传统方法相比,基于深度学习的降尺度方法具有明显优势[6],较典型的方法包括SRCNN(Super-Resolution Convolutional Neural Network)[7],GANs(Generative Adversarial Networks)[8]等。
在特征提取方面,研究者曾提出多种技术和方法,传统的包括决策树[9]、随机森林[10]、支持向量机[11]等特征提取方法,但这些方法仅考虑了像元自身的信息,获取到的特征区分度往往不够理想。卷积神经网络(Convolutional Neural Network,CNN)[12-13]以图像块为单位进行特征提取,能够综合考虑像元自身的信息以及像元间的空间关系,所提取出的特征具有更高的类内一致性和更高的类间区分度。以卷积神经网络为基础,人们成功地从高分辨率遥感影像中提取了水稻、枸杞、小麦[14]等多种农作物信息,但由于中等分辨率遥感影像上细节信息明显变少,利用卷积神经网络提取出高质量特征的难度依然很大,需要根据中等分辨率遥感影像的特点,合理组织输入并设计模型结构。
本文在充分吸收前人研究成果的基础上,重点针对如何从Sentinel-2A数据中提取高精度的冬小麦空间分布开展研究。针对通道数据空间尺度不一致的问题,以GAN为基础建立了一种降尺度模型REDS(Red Edge Down Scale),用于对B5、B6、B7、B11等波段进行降尺度处理;针对获取高质量特征的问题,以CNN为基础构建了一种逐像素分割模型REVINet(Red Edge and Vegetation Index Feature Network),用于提取特征并进行逐像素分类。以期为利用Sentinel-2A数据提取其他作物的空间分布提供借鉴。
1 研究区和数据
1.1 研究区概况
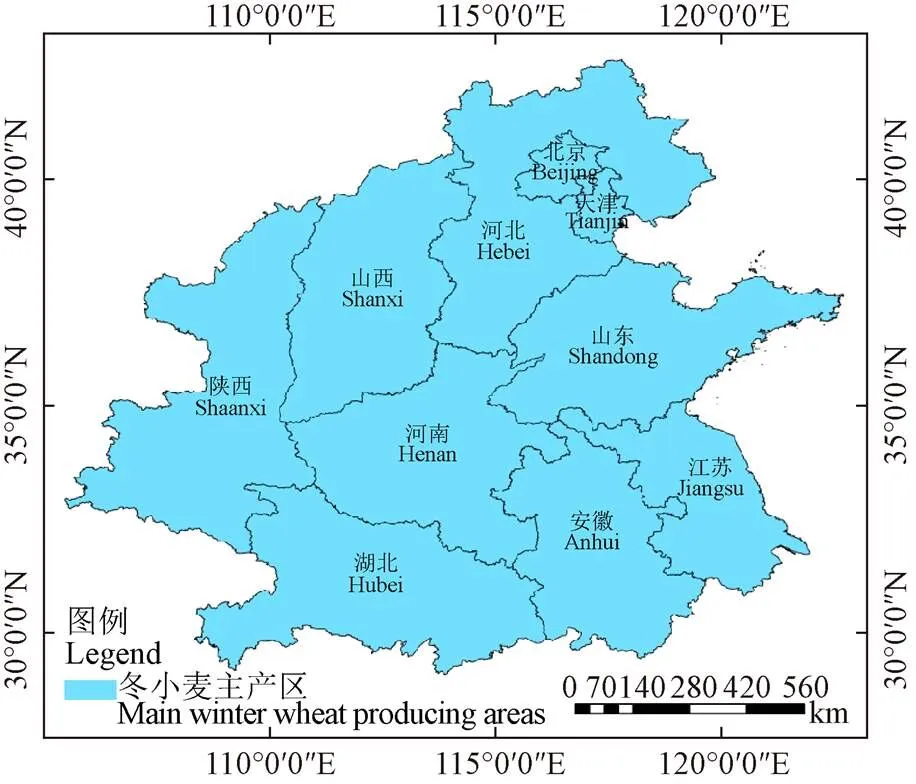
本文选择中国的冬小麦主产区(山东、河北、河南、湖北、江苏、安徽、山西、陕西、北京、天津)作为研究区,总面积共计133.76万km2。研究区位于北纬29°05′~42°37'、东经105°29′~122°43′之间(图1)。

图1 冬小麦主产区
1.2 遥感数据及其预处理
本文以Sentinel-2A[15]作为主要数据源,收集了研究区2022年3—4月期间的238幅Sentinel-2A数据,这些数据覆盖了整个研究区。利用航天宏图信息技术股份有限公司自主研发的PIE(Pixel Information Expert-Basic)遥感图像处理软件对所有波段图像进行辐射定标、大气校正、正射校正等预处理步骤。
1.3 制作逐像素标记文件
3—4月份的Sentinel-2A图像中,与冬小麦同期的作物主要是大蒜和冬油菜。根据地面调查资料和遥感影像进行对比,可以发现,冬小麦呈深绿色,大蒜呈浅绿色,冬油菜颜色介于两者之间;三者的纹理具有明显区别。根据以上特征,以PIE软件为基础进行目视解译[16],然后将原始图像及对应的标注图像裁剪为512×512像素尺寸,最终共得到6 210组图像块,以此为基础组成训练数据集和测试数据集,用于对本文模型进行训练和测试。
2 研究方法
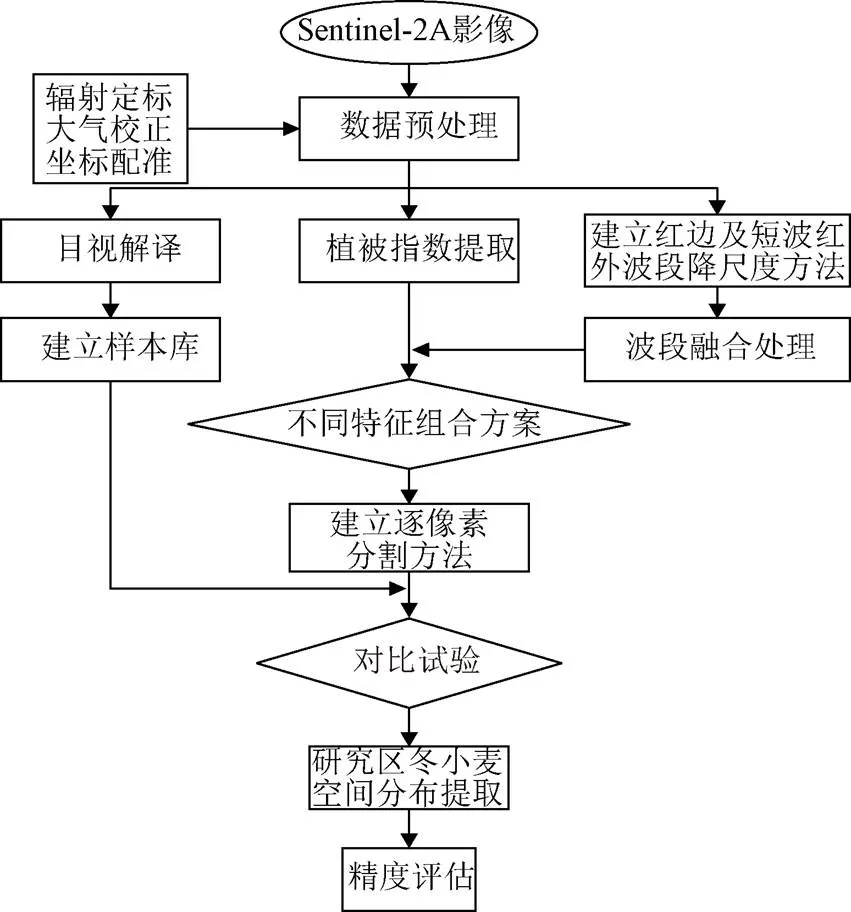
本研究的技术路线如图2所示。
2.1 红边及短波红外波段的降尺度
根据Sentinel-2A影像的特点,选择RSFuseNet模型[17]为基础,重点对其上采样部分和损失函数进行了改进,形成了降尺度模型REDS(Red Edge Down Scale),用于对B5(Red edge 1)、B6(Red edge 2)、B7(Red edge 3)、B11(SWIR 1)波段进行降尺度处理,得到空间分辨率为10 m的数据。

图2 冬小麦空间分布提取技术流程图
2.1.1 模型结构
REDS模型的输入包括低分辨率通道和高分辨率通道两部分,低分辨率通道提供光谱信息,高分辨率通道提供纹理信息。REDS通过将从高分辨率通道提取出的空间结构信息注入到低分辨率通道中,达到对低分率通道降尺度的目的(图3)。
REDS首先利用线性插值进行上采样,然后利用1组1×1的卷积层对上采样结果进行调整,用于提取低分辨率通道的光谱特征;从高分辨率通道中提取空间结构信息,并逐级对光谱信息和空间结构信息进行融合,生成结果图像。
2.1.2 损失函数
损失函数计算公式如(1)所示,包括空间结构损失和光谱损失两部分,

式中L代表空间结构损失,L代表光谱损失,、为权重。
空间结构损失计算方法如公式(2)所示,

式中代表降尺度后的数据,代表原始数据,代表像素数,代表纹理损失,的计算公式如(3)所示,

式中代表的均值,代表的均值,2为的方差,2为的方差,为和的协方差,1、2为经验常量。
光谱损失计算方法如公式(4)所示,

式中l为原始图像插值上采样得到的与h尺寸相同的图像,m代表图像块的高度,w代表图像的宽度。
2.2 提取植被指数
使用经过降尺度的数据提取植被指数。根据前人文献[18-19],提取增强植被指数(Enhanced Vegetation Index,EVI)、归一化植被指数(Normalized Difference Vegetation Index,NDVI)和归一化差值红边指数(Normalized Difference Red-Edge1,NDRE1)3个植被指数。
2.3 进行逐像素分割
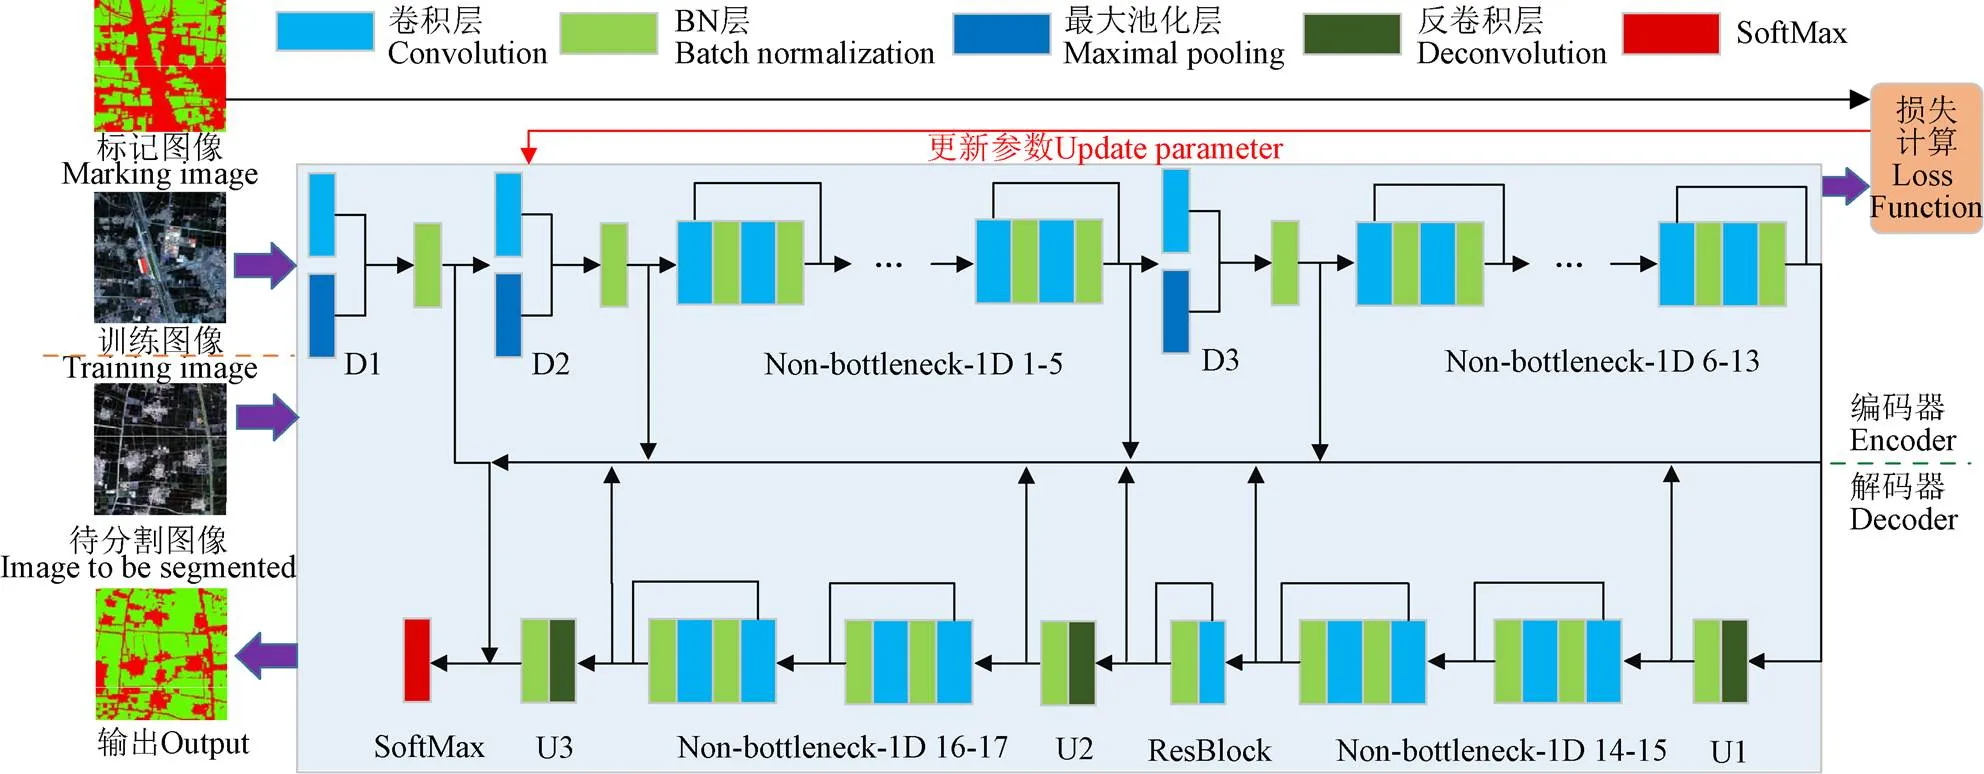
选择ERFNet[20]为基础模型,根据基础数据的特点重新设计了特征融合部分,形成了REVINet模型(图4),用于实现逐像素分割。

图4 REVINet网络结构图
2.3.1 模型输入
在训练阶段,模型的输入为图像块对,每个图像块对包含1个数据块和1个标记块,尺寸均为512×512像素。在分割阶段,图像的输入仅包含数据块。
2.3.2 编码器
编码器由5个串联的特征提取单元组成,能够为每个像素提取5个级别语义特征信息。D1、D2、D3使用3×3型卷积核;Non-bottleneck-1D 1-5和Non-bottleneck-1D 6-13使用1×1型卷积核,这种结构设计的优势在于充分考虑了哨兵2号遥感图像的空间分辨率与地物覆盖面积的比例关系对于卷积计算的影响,在保证能够提取到足够的语义特征的基础上,避免了使用过深的卷积结构可能导致特征值出现噪声较大的问题,有利于分类器进行逐像素分类计算。
2.3.3 解码器
解码器由U1、Non-bottleneck-1D 14-15、U2、Non-bottleneck-1D 16-17、U3等5个解码单元和ResBlock 1个残差单元构成。模型上采样时采用了逐步恢复的策略,每次调整时行数和列数分别扩大1倍,最终将特征图的行列数恢复到与原图像一致。卷积层的作用是对上采样后的特征值进行调整。分类器和损失函数依然采用模型原有结构。
2.4 试验设计
为了验证红边通道在识别农作物时的作用,设计了3种数据组织方案[21],如表1所示,其中,REDS红边组合(方案1)使用REDS模型对红边及短波红外波段进行降尺度,插值法红边组合(方案2)使用最近邻域插值法[22]对红边及短波红外波段进行降尺度。在前两种组合方案中,所使用的红边通道和SWIR通道均为经过降尺度处理的数据。

表1 数据组织方案
注:B2~B11为蓝、绿、红波段,红边波段1、2、3,近红外波段,短波红外波段1;EVI、NDVI、NDRE1分别为增强植被指数、归一化植被指数和归一化差值红边指数。
Note: B2-B11 represent blue, green and red bands, red edge 1, 2 and 3, near infrared band, short-wave infrared band 1; EVI, NDVI and NDRE1 represent Enhanced Vegetation Index, Normalized Difference Vegetation Index and Normalized Difference Red-Edge1.
考虑到ERFNet、RefineNet和U-Net的模型结构与REVINet工作原理相似,选择其作为对比模型,以便反映REVINet的性能。其中,ERFNet同REVINet一样选择使用多个Non-bottleneck-1D结构来提高模型精度,但其为一种端到端的编码器—解码器语义分割结构;RefineNet同REVINet一样使用了参数固定的线性模型进行特征融合,但参数值不同;U-Net同REVINet一样采用了多尺度特征融合技术,但其为一种U型网络结构。
2.5 评价指标
用准确率(Accuracy)、查准率(Precision)、召回率(Recall)和 F1分数来评估结果的分类精度[23],反映的是研究区各类地物的位置精度指标。用面积精度(Area accuracy)评估研究区内作物面积提取结果的精度,计算公式见文献[24]。
3 结果与分析
3.1 REDS降尺度方法与插值法试验结果
图5给出了分别使用REDS模型和插值法对红边降尺度的结果。通过对比图5可以直观地看出,使用插值法处理后的图像轮廓和纹理细节都较为模糊,从而在一定程度上影响提取结果的精度,而使用REDS方法得到的结果结构更为清晰。

图5 REDS降尺度方法与插值法的对比试验结果
3.2 不同方案的对比分析
图6给出了对比模型利用不同方案生成的结果。从图6c中可以看出,REVINet的所有结果均比较理想,U-Net的结果中漏识现象较多,ERFNet和RefineNet的结果比较接近,但精度与REVINet有一定差距。从图6d中可以看出,REVINet的结果中冬小麦区域的轮廓边缘更为平滑且错分情况较少,U-Net的结果中错分现象较多,ERFNet和RefineNet的结果比较接近,但在不同类别的边界区域识别错误增加。从图6e中可以看出,REVINet提取的冬小麦结果较为理想,U-Net的结果中粘连地块边缘提取不清晰,ERFNet和RefineNet的结果中对小尺度图斑的提取有所改善,但仍存在漏分的情况。

图6 3个方案的对比试验结果
3.3 REVINet模型精度验证
表2给出了对比模型的评价指标。从表2可以看出,在3个方案中,REVINet的各项指标均达到了最高,优于对比模型,同时方案2对应的各项指标均差于方案1,方案3对应的各项指标均差于方案1和方案2。

表2 3个方案的试验结果精度评价
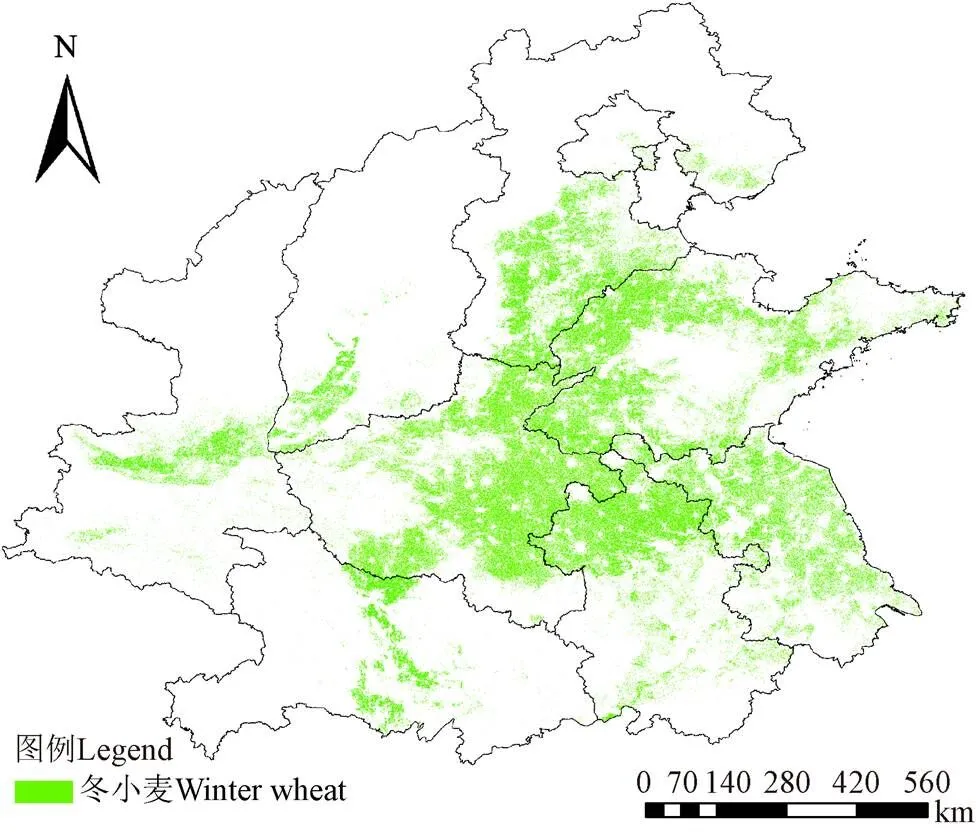
图7给出了使用本文方法提取的中国冬小麦主产省在2022年3—4月内的冬小麦空间分布情况。从图7可以看出,中国冬小麦主要分布在长城以南地区,与2021年国家统计部门公布的面积值进行对比[25],计算出面积精度(表3),可以看出本文方法所提取结果的面积精度相对较高,符合度较好,从宏观的角度验证了REVINet模型的精度和有效性。

图7 研究区的冬小麦空间分布

表3 研究区冬小麦的种植面积
4 结 论
本文以中国冬小麦主产省为研究区,研究的时间尺度为2022年3—4月。针对如何利用Sentinel-2A遥感影像提取高精度的冬小麦空间分布开展研究,提出了一种基于生成式对抗网络的降尺度方法和基于卷积神经网络的逐像素分割方法,重点解决了数据降尺度问题和提取精度问题。研究结果表明,本文提出的方法在召回率、查准率、准确率和F1分数分别达到了92.15%、93.74%、93.09%、92.94%,均优于对比方法,所提取的各主产省的冬小麦面积的精度多数均为90%以上,与国家统计部门公布的数据相符。
在下一步的研究中,将考虑加入非监督训练方法,降低模型对标记工作的要求,以便将模型应用于生产实践。
[1] Belgiu M, Csillik O. Sentinel-2 cropland mapping using pixel-based and object-based time-weighted dynamic time warping analysis[J]. Remote Sensing of Environment, 2018, 204: 509-523.
[2] 孙敏轩,刘明,孙强强,等. 利用光谱混合分解模型分析GF-6新增波段对土地利用/覆被的响应[J]. 农业工程学报,2020,36(3):244-253.
Sun Minxuan, Liu Ming, Sun Qiangqiang, et al. Response of new bands in GF-6 to land use/cover based on linear spectral mixture analysis model[J]. Transactions of the Chinese Society of Agricultural Engineering (Transactions of the CSAE), 2020, 36(3): 244-253. (in Chinese with English abstract)
[3] 张东彦,杨玉莹,黄林生,等. 结合Sentinel-2影像和特征优选模型提取大豆种植区[J]. 农业工程学报,2021,37(9):110-119.
Zhang Dongyan, Yang Yuying, Huang Linsheng, et al. Extraction of soybean planting areas combining Sentinel-2 images and optimized feature model[J]. Transactions of the Chinese Society of Agricultural Engineering (Transactions of the CSAE), 2021, 37(9): 110-119. (in Chinese with English abstract)
[4] 张晓阳,李广泽,彭畅,等. 基于深度卷积网络的红外遥感图像超分辨率重建[J]. 黑龙江大学自然科学学报,2018,35(4):473-477.
Zhang Xiaoyang, Li Guangze, Peng Chang, et al. Super-resolution reconstruction of infrared remote sensing image based on deep convolution network[J]. Journal of Natural Science of Heilongjiang University, 2018, 35(4): 473-477. (in Chinese with English abstract)
[5] 姚钰桐,谭荃戈,姬广凯. 基于SRGAN网络的低分辨率图像重建方法[J]. 电子技术与软件工程,2022(2):165-168.
Yao Yutong, Tan Quange, Ji Guangkai. Low resolution image reconstruction method based on SRGAN network[J]. Electronic Technology & Software Engineering, 2022(2): 165-168. (in Chinese with English abstract)
[6] Shao Z, Cai J, Fu P, et al. Deep learning-based fusion of Landsat-8 and Sentinel-2 images for a harmonized surface reflectance product[J]. Remote Sensing of Environment, 2019, 235: 111425.
[7] 杨云,张海宇,朱宇,等. 类别信息生成式对抗网络的单图超分辨重建[J]. 中国图象图形学报,2018,23(12):1777-1788.
Yang Yun, Zhang Haiyu, Zhu Yu, et al. Class-information generative adversarial network for single image super-resolution[J]. Journal of Image and Graphics, 2018, 23(12): 1777-1788. (in Chinese with English abstract)
[8] 韩巧玲,周希博,宋润泽,等. 基于序列信息的土壤CT图像超分辨率重建[J]. 农业工程学报,2021,37(17):90-96.
Han Qiaoling, Zhou Xibo, Song Runze, et al. Super-resolution reconstruction of soil CT images using sequence information[J]. Transactions of the Chinese Society of Agricultural Engineering (Transactions of the CSAE), 2021, 37(17): 90-96. (in Chinese with English abstract)
[9] 孙亚楠,李仙岳,史海滨,等. 基于特征优选决策树模型的河套灌区土地利用分类[J]. 农业工程学报,2021,37(13):242-251.
Sun Yanan, Li Xianyue, Shi Haibin, et al. Classification of land use in Hetao Irrigation District of Inner Mongolia using feature optimal decision trees[J]. Transactions of the Chinese Society of Agricultural Engineering (Transactions of the CSAE), 2021, 37(13): 242-251. (in Chinese with English abstract)
[10] 赵红伟,陈仲新,姜浩,等. 基于Sentinel-1A影像和一维CNN的中国南方生长季早期作物种类识别[J]. 农业工程学报,2020,36(3):169-177.
Zhao Hongwei, Chen Zhongxin, Jiang Hao, et al. Early growing stage crop species identification in southern China based on sentinel-1A time series imagery and one-dimensional CNN[J]. Transactions of the Chinese Society of Agricultural Engineering (Transactions of the CSAE), 2020, 36(3): 169-177. (in Chinese with English abstract)
[11] Wu X, Zuo W, Lin L, et al. F-SVM: Combination of feature transformation and SVM learning via convex relaxation[J]. IEEE Transactions on Neural Networks and Learning Systems, 2018, 29(11): 5185-5199.
[12] 解毅,张永清,荀兰,等. 基于多源遥感数据融合和LSTM算法的作物分类研究[J]. 农业工程学报,2019,35(15):129-137.
Xie Yi, Zhang Yongqing, Xun Lan, et al. Crop classification based on multi-source remote sensing data fusion and LSTM algorithm[J]. Transactions of the Chinese Society of Agricultural Engineering (Transactions of the CSAE), 2019, 35(15): 129-137. (in Chinese with English abstract)
[13] Zhang C, Sargent I, Pan X, et al. Joint deep learning for land cover and land use classification[J]. Remote Sensing of Environment, 2019, 221: 173-187.
[14] Zhang C, Han Y, Li F, et al. A New CNN-Bayesian Model for Extracting Improved Winter Wheat Spatial Distribution from GF-2 imagery[J]. Remote Sensing, 2019, 11(6): 619.
[15] 王汇涵,张泽,康孝岩,等. 基于Sentinel-2A的棉花种植面积提取及产量预测[J]. 农业工程学报,2022,38(9):205-214.
Wang Huihan, Zhang Ze, Kang Xiaoyan, et al. Cotton planting area extraction and yield prediction based on Sentinel-2A[J]. Transactions of the Chinese Society of Agricultural Engineering (Transactions of the CSAE), 2022, 38(9): 205-214. (in Chinese with English abstract)
[16] 李方杰,任建强,吴尚蓉,等. NDVI时序相似性对冬小麦种植面积总量控制的制图精度影响[J]. 农业工程学报,2021,37(9):127-139.
Li Fangjie, Ren Jianqiang, Wu Shangrong, et al. Effects of NDVI time series similarity on the mapping accuracy controlled by the total planting area of winter wheat[J]. Transactions of the Chinese Society of Agricultural Engineering (Transactions of the CSAE), 2021, 37(9): 127-139. (in Chinese with English abstract)
[17] 孔爱玲,张承明,李峰,等. 基于知识引导的遥感影像融合方法[J]. 自然资源遥感,2022,34(2):47-55.
Kong Ailing, Zhang Chengming, Li Feng, et al. Knowledge-based remote sensing image fusion method[J]. Remote Sensing for Natural Resources, 2022, 34(2): 47-55. (in Chinese with English abstract)
[18] 张悦琦,李荣平,穆西晗,等. 基于多时相GF-6遥感影像的水稻种植面积提取[J]. 农业工程学报,2021,37(17):189-196.
Zhang Yueqi, Li Rongping, Mu Xihan, et al. Extraction of paddy rice planting areas based on multi-temporal GF-6 remote sensing images[J]. Transactions of the Chinese Society of Agricultural Engineering (Transactions of the CSAE), 2021, 37(17): 189-196. (in Chinese with English abstract)
[19] Jiang X, Fang S, Huang X, et al. Rice mapping and growth monitoring based on time series GF-6 images and red-edge bands[J]. Remote Sensing, 2021, 13(4): 579.
[20] 谭镭,孙怀江. SKASNet:用于语义分割的轻量级卷积神经网络[J]. 计算机工程,2020,46(9):261-267.
Tan Lei, Sun Huaijiang. SKASNet: Lightweight convolutional neural network for semantic segmentation[J]. Computer Engineering, 2020, 46(9): 261-267. (in Chinese with English abstract)
[21] 黄建文,李增元,陈尔学,等. 高分六号宽幅多光谱数据人工林类型分类[J]. 遥感学报,2021,25(2):539-548.
Huang Jianwen, Li Zengyuan, Chen Erxue, et al. Classification of plantation types based on WFV multispectral imagery of the GF-6 satellite[J]. National Remote Sensing Bulletin, 2021, 25(2): 539-548. (in Chinese with English abstract)
[22] 刘颖,朱丽,林庆帆,等. 图像超分辨率技术的回顾与展望[J]. 计算机科学与探索,2020,14(2):181-199.
Liu Ying, Zhu Li, Lin Qingfan, et al. Review and prospect of image super-resolution technology[J]. Journal of Frontiers of Computer Science and Technology, 2020, 14(2): 181-199. (in Chinese with English abstract)
[23] 汤涌,项铮,蒋腾平. 基于三维激光点云的复杂道路场景杆状交通设施语义分类[J]. 热带地理,2020,40(5):893-902.
Tang Yong, Xiang Zheng, Jiang Tengping. Semantic classification of Pole-Like traffic facilities in complex road scenes based on LiDAR point cloud[J]. Tropical Geography, 2020, 40(5): 893-902. (in Chinese with English abstract)
[24] 钱丽沙,姜浩,陈水森,等. 基于时空滤波Sentinel-1时序数据的田块尺度岭南作物分布提取[J]. 农业工程学报,2022,38(5):158-166.
Qian Lisha, Jiang Hao, Chen Shuisen, et al. Extracting field-scale crop distribution in Lingnan using spatiotemporal filtering of Sentinel-1 time-series data[J]. Transactions of the Chinese Society of Agricultural Engineering (Transactions of the CSAE), 2022, 38(5): 158-166. (in Chinese with English abstract)
[25] 牛乾坤,刘浏,黄冠华,等. 基于GEE和机器学习的河套灌区复杂种植结构识别[J]. 农业工程学报,2022,38(6):165-174.
Niu Qiankun, Liu Liu, Huang Guanhua, et al. Extraction of complex crop structure in the Hetao Irrigation District of Inner Mongolia using GEE and machine learning[J]. Transactions of the Chinese Society of Agricultural Engineering (Transactions of the CSAE), 2022, 38(6): 165-174. (in Chinese with English abstract)
Extraction method for the spatial distribution of winter wheat using multi-scale features
Chen Fangfang1, Song Zirui1, Zhang Jinghan1, Wang Mengnan1, Wu Menxin2, Zhang Chengming1,3※, Li Feng4, Liu Pingzeng1,5,6, Yang Na7
(1.,,271018,; 2.,100081,; 3.,271018,; 4.,250031,; 5.,271018,; 6.,,271018,; 7..,,100093,)
An accurate extraction of the crop spatial distribution is of great significance for the decision-making on management measures in modern agriculture. Fortunately, the remote sensing images can be widely used as the important data sources for the spatial distribution of crops at present. It is a high demand to extract the high-quality features from the spatial distribution of crops using the remote sensing images. In this study, the Sentinel-2A images were selected to extract the high-precision spatial distribution of winter wheat, in order to avoid the data scale reduction and feature fusion. Firstly, the red edge resource was utilized to classify the important features of winter wheat. The visible light and red edge bands were also combined to effectively reduce the misclassification of pixels for the high accuracy. A downscale model Red Edge Down Scale (REDS) was then established to balance the spatial scale of the data in the Sentinel-2A images, due to the different band resolution between the red edge (20m) and the visible light (10m). The generative countermeasure network was constructed using the three red edge bands of B5, B6 and B7. More importantly, the spatial resolution of B11 shortwave infrared band was reduced from 20 to 10 m, in order to obtain the better consistence in the spatial resolution of visible light and red edge band. The edge blur of image was also prevented from the interpolation (nearest neighbor interpolation). Secondly, the inputs of REDS consisted of the low- and high-resolution channel, correspondingly to the spectral and texture information, respectively. The spatial structure information was then input from the high- into the low-resolution channel. As such, the improved model was achieved in the image data from the high-resolution red edge and short-wave infrared (SWIR) channel. Secondly, the original data was extracted, and then combined into the basic input data, including the three red edge bands after scaling down, the visible light band with a resolution of 10m, and three remote-sensing index products, namely Enhanced Vegetation Index (EVI), Normalized Difference Vegetation Index (NDVI), and Normalized Difference Red-Edge1 (NDRE1). Thirdly, the semantic feature extraction model was constructed as the Red Edge and Vegetation Index Feature Network (REVINet) using convolutional neural network. The coding and decoding units were constructed in the REVINet model using residual network. The linear model was used to fuse the multi-scale features for the output by the decoding units. SoftMax function was used as a classifier for the pixel-by-pixel classification. Finally, the segmentation, and the spatial distribution of winter wheat were generated to verify the REVINet model, compared with the ERFNet, U-Net, and RefineNet models. The experimental results show that the smoother contour edge was extracted from the planting area of winter wheat, particularly with the less misclassification. Meanwhile, the recall (92.15%), precision (93.74%), accuracy (93.09%), and F1 score (92.94%) were better than the rest models, indicating the ideal performance. The spatial distribution of the whole research area demonstrated that the winter wheat in China was mainly distributed in the south of the Great Wall in 2022. The relatively high accuracy of extracted areas was achieved with the better coincidence degree, compared with the standard released by the National Statistical Department in 2021. Therefore, the data organization and feature extraction can be expected to serve as the spatial distribution of winter wheat using the Sentinel-2A. The finding can also provide the technical reference for the Sentinel-2A data in the agricultural field.
convolutional neural network; downscaling; Sentinel-2A; spatial distribution of winter wheat; EVI; NDVI; NDRE1; red edge band
10.11975/j.issn.1002-6819.2022.24.029
TP751
A
1002-6819(2022)-24-0268-07
陈芳芳,宋姿睿,张景涵,等. 融合多尺度特征的冬小麦空间分布提取方法[J]. 农业工程学报,2022,38(24):268-274.doi:10.11975/j.issn.1002-6819.2022.24.029 http://www.tcsae.org
Chen Fangfang, Song Zirui, Zhang Jinghan, et al. Extraction method for the spatial distribution of winter wheat using multi-scale features[J]. Transactions of the Chinese Society of Agricultural Engineering (Transactions of the CSAE), 2022, 38(24): 268-274. (in Chinese with English abstract) doi:10.11975/j.issn.1002-6819.2022.24.029 http://www.tcsae.org
2022-09-27
2022-12-10
山东省自然科学基金项目(ZR2021MD097,ZR2020MF130);中国气象局旱区特色农业气象灾害监测预警与风险管理重点实验室开放基金项目(CAMF-202001);国家重点研发计划项目(2018YFC1506500);风云卫星应用先行计划项目(FY-APP-2021.0305)
陈芳芳,研究方向为遥感信息提取。Email:2020110664@sdau.edu.cn
张承明,博士,教授,研究方向为遥感信息提取。Email:chming@sdau.edu.cn

