Temporal alterations in pericytes at the acute phase of ischemia/reperfusion in the mouse brain
Shuang Zhang, Xue-Jing Liao, Jia Wang, Yi Shen, Han-Fen Shi, Yan Zou,Chong-Yang Ma, Xue-Qian Wang, Qing-Guo Wang, Xu Wang, Ming-Yang Xu,Fa-Feng Cheng, Wan-Zhu Bai,*
Abstract Pericytes, as the mural cells surrounding the microvasculature, play a critical role in the regulation of microcirculation; however, how these cells respond to ischemic stroke remains unclear. To determine the temporal alterations in pericytes after ischemia/reperfusion, we used the 1-hour middle cerebral artery occlusion model, which was examined at 2, 12, and 24 hours after reperfusion. Our results showed that in the reperfused regions, the cerebral blood flow decreased and the infarct volume increased with time. Furthermore, the pericytes in the infarct regions contracted and acted on the vascular endothelial cells within 24 hours after reperfusion. These effects may result in incomplete microcirculation reperfusion and a gradual worsening trend with time in the acute phase. These findings provide strong evidence for explaining the “no-reflow” phenomenon that occurs after recanalization in clinical practice.
Key Words: acute ischemic stroke; alpha-smooth muscle; cerebral blood flow; microcirculation; no-reflow phenomenon; pericytes; platelet endothelial cell adhesion molecule-1; platelet-derived growth factor receptor beta; vascular endothelial cells
Introduction
Ischemic stroke is a serious disease of the central nervous system (CNS)causing high morbidity and mortality (Benjamin et al., 2017). Although our understanding of the pathological alterations in ischemic stroke, such as neuronal degeneration and glial activation, has progressed, the pathological impact of ischemic stroke remains poorly understood. Recent stroke research has shifted the focus from the neuron centered view to the microvascular system. Increasing evidence suggests that successful neuroprotection depends on microvascular protection. In addition to the recognized role of astrocytes and microglia in the pathogenesis of stroke, pericytes play an important role in the progression and recovery after stroke (Gautam and Yao,2018; Wen et al., 2021). It is increasingly recognized that neuroprotection cannot be achieved without the protection of microvessels.
In the CNS, pericytes account for the highest proportion of cells (ElAli et al., 2014; Courtney and Sutherland, 2020). However, a recent indepth exploration of pericytes provided further insights into the study of microcirculation regulation (Dalkara et al., 2019). “No-reflow”, a typical phenomenon that occurs with ischemic stroke, which has been observed for more than half a century, indicates that the ischemic area cannot receive adequate blood perfusion when the blocked blood vessel is opened again. However, the explanation of this phenomenon is still a perplexing issue with ischemic stroke. Reflow of occluded vessels is crucial for tissue preservation and restoration (Kloner et al., 2018). After stroke, pericytes contract brain capillaries, resulting in the no-reflow phenomenon. When Rouget (1873) discovered pericytes, because of their position and shape on the microvessels, he suggested that they may have the ability to contract and regulate the blood flow in the microcirculation. Several studies (Peppiatt et al., 2006; Yemisci et al., 2009) made outstanding contributions to the study of the capillary contracting effect of pericytes on the phenomenon of no-reflow.Their contractibility is mediated by a unique cytoskeletal organization formed by filaments of actin that allows pericyte deformability with the consequent mechanical force transferred to the extracellular matrix to change the diameter of the vessel (Yemisci et al., 2009; Hall et al., 2014; Alarcon-Martinez et al., 2019; Kureli et al., 2020).
Pericytes are parietal cells that are mainly located on the microvessels, which are distributed on the precapillary arterioles, capillaries, and postcapillary venules (van Dijk et al., 2015). They are generally considered to be related to vascular smooth muscle cells and belong to the same cell lineage, but their position in the endothelium, their morphology, and their markers’ expression are different from vascular smooth muscle cells (Armulik et al., 2005, 2011).As observed in the CNS phenotype (Armulik et al., 2005; Caporarello et al.,2019), pericytes extend around the capillaries, mostly in the circumferential direction on the arteriole side and branch points of the capillary bed, and more longitudinally in the middle of the capillary bed, and they have a stellate shape on the venule side (Hartmann et al., 2015).Identification of pericyte biochemical markers is of great significance to the field of cerebrovascular biology. It is difficult to identify pericytes with molecular markers because of the lack of specific pericyte markers. In general,the relatively accurate identification of brain pericytes relies on a combination of at least two markers (Yang et al., 2017). One of the classic markers used for pericyte identification is alpha-smooth muscle actin (α-SMA), whose expression is related to the pericyte regulatory function of capillary blood flow(van Dijk et al., 2015). Platelet-derived growth factor receptor beta (PDGFR-β)is another common marker of pericytes. It is widely expressed on pericyte surfaces and is necessary for pericyte proliferation and survival (Armulik et al., 2011). After ligand binding and receptor dimerization, phosphorylated tyrosine in the intracellular domain of PDGFR-β recruits scaffold proteins to induce multiple signaling pathways (Dubrac et al., 2018).
In view of these findings, 2,3,5-triphenyltetrazolium chloride (TTC) staining and laser speckle measurement of cerebral blood flow (CBF) were conducted in this study to evaluate the changes in cerebral infarction volume and CBF,respectively, at different time points after cerebral ischemia/reperfusion (I/R)(Liu et al., 2018; Trotman-Lucas et al., 2020; Zhang et al., 2020). Fluorescence histochemistry and immunohistochemistry were used to analyze the expression changes in pericytes and endothelial cells after cerebral I/R. Here,PDGFR-β, α-SMA, and CD31 were selected to label pericytes and endothelial cells in the microvasculature (Sweeney et al., 2016; Grant et al., 2019).Through this study, we hope to characterize the expression changes in the relationship between pericyte contraction of microvessels and reperfusion time after early stroke from the perspective of histochemistry, which may contribute to a better understanding of the role of pericytes in blocking ischemic tissue reperfusion. Furthermore, we attempted to classify the diversity of mural cell phenotypes. By staining α-SMA and PDGFR-β, distinct pericyte morphologies were observed and classified in the mouse brain.
Materials and Methods
Ethics statement
This study was approved by the Animal Care Committee, Beijing University of Traditional Chinese Medicine, China (approval No. BUCM-4 20191015074007)on October 15, 2019. All experiments related to the operation were performed in accordance with the National Institutes of Health Laboratory Animal Care Methods and Use Guidelines.
Animals
Generally, male mice have better physical health indicators than female mice(Gibson et al., 2006), thus 48 male C57BL/6 mice (6-8 weeks old, weighing 22-25 g, specific pathogen free level) were purchased from Sibeifu (Beijing)Laboratory Animal Technology Co., Ltd. (Beijing, China). All experimental operations were performed under the same conditions between 9:00 am and 6:00 pm. All mice were kept under a 12-hour light/dark cycle with controlled temperature and humidity and had free access to food and water.Experimental mice were divided into sham operation group, cerebral I/R 2 hours group (I/R 2 h), cerebral I/R 12 hours group (I/R 12 h), and cerebral I/R 24 hours group (I/R 24 h) by a random number method.
Stroke model
Mice were deeply anaesthetized with 3% isoflurane (Shenzhen Reward Life Technology Co., Ltd., Guangzhou, China), and then maintained under anesthesia with 1.5% isoflurane using a mask (Li et al., 2020). Briefly, the right common carotid artery (Chiaverina et al., 2019) and ipsilateral external carotid artery were exposed, and then the external carotid artery was ligated.Using ophthalmic forceps, the internal carotid artery was carefully separated and clamped with microvascular arterial clamps. A sensory monofilament was advanced through the external carotid artery, followed by the carotid artery bifurcation; it was then entered into the internal carotid artery and gently inserted until it reached the starting point of the middle cerebral artery, where it was fixed with the blood vessel with sutures. Middle cerebral artery occlusion (MCAO) in the right side of the brain was completed at thistime. After 1 hour of occlusion, we achieved reperfusion by drawing out the monofilament. The sham operation group underwent the same operation except for the occlusion of the middle cerebral artery. After the operation, the mice were placed on an electric blanket to maintain their body temperature to improve the survival rate.
Laser speckle contrast imaging procedures and analysis
At 2 (hyperacute phase), 12, and 24 hours (acute phase) after I/R,the mice were anesthetized by an animal anesthesia ventilator system(R520, Shenzhen Reward Life Technology Co., Ltd.), which was fixed on the stereotaxic apparatus. The mice were in the prone position, the hair at the top of the head was removed, and the scalp was gently excised to expose the brain under the parietal bone. The laser speckle blood flow imaging system(Moor Instruments Ltd., Axminster, UK) was placed on the skull to measure CBF. The cerebral laser speckle blood flow contrast map of each mouse was collected, and the changes in CBF in the cerebral cortex during the monitoring period and the imaging characteristics were analyzed. To improve the signalto-noise ratio, one speckle contrast image was calculated for every 100 consecutive original speckle images; the measurement time was 1 minute We selected the region of interest (ROI) with the most middle cerebral arterysupplied areas on both sides of the brain as the measurement area (ROI1 and ROI2). The ROI was defined as two rectangular areas of 4.5 mm × 2.5 mm(2 mm lateral and 1 mm anterior). From the measurements obtained, the relative ipsilateral/contralateral CBF ratio was calculated.
Tissue preparation
At 2, 12, and 24 hours post operation, all mice were anesthetized by intraperitoneal injection of pentobarbital sodium (50 mg/kg, Cat# 020402,Beijing Chemical Reagent Research Institute Co., Ltd., Beijing, China), followed by cardiac perfusion with normal saline and 4% paraformaldehyde. The intact brain was carefully dissected after perfusion, fixed with 4% paraformaldehyde for 2 hours, and stored overnight in a 25% sucrose solution at 4°C. After removing the brain tissue from the sucrose solution, it was placed on a cryostat (Thermo, Microm International GmbH, Walldorf, Germany) for continuous cross-sectional sectioning, with a thickness of 40 μm. The sections were placed in a six-well plate containing 0.1 M phosphate buffer (pH 7.4).
TTC staining
TTC staining of brain tissues was performed to verify the establishment of the model preparation. Briefly, the brain tissues from the sham group and the model group were collected and frozen at -20°C for 20 minutes to facilitate sectioning. Then, the brain tissue was placed on ice for sectioning at a thickness of 2 mm. The slices were incubated with 2% TTC solution(MilliporeSigma, St. Louis, MO, USA) at 37°C for 20-30 minutes. Subsequently,the brain slices of each group were imaged and the photos were analyzed with Image-Pro Plus 6.0 software (Media Cybernetics, Inc., Bethesda, MD,USA). The infarct volume is expressed as a percentage of total infarct volume/total brain volume.
Fluorescence immunohistochemistry
Fluorescence immunohistochemistry was used to examine colocalization of PDGFR-β and α-SMA, PDGFR-β and CD31 (a marker for endothelial cells in the microvasculature), and α-SMA and CD31 in brain sections. All sections were blocked in 0.1 M phosphate buffer (pH 7.4) solution containing 3%donkey serum (MilliporeSigma) and 0.5% Triton X-100 for 30 minutes at room temperature. Next, each group of sections was incubated on a slow shaker at 4°C overnight with the following primary antibodies: rabbit anti-PDGFR-β(1:1000; Abcam, Cambridge, UK, Cat# ab32570, RRID: AB_777165), mouse anti-α-SMA (1:1500; Abcam, Cat# ab7817, RRID: AB_262054), and goat anti-CD31 (1:1000; RD, St. Louis, MO, USA, Cat# AF3628, RRID: AB_2161028).On the following day, the sections were washed 3 × 5 minutes with 0.1 M phosphate buffer (pH 7.4), and then incubated with the corresponding secondary antibodies and 4′,6-diamidino-2-phenylindole (1:50,000; Molecular Probes, Eugene, OR, USA) solution for 1.5 hours at room temperature.The secondary antibodies were: donkey anti-mouse Alexa Fluor 594(1:500; Thermo Fisher Scientific, Waltham, MA, USA, Cat# R37115, RRID:AB_2556543), donkey anti-rabbit Alexa Fluor 488 (1:500; Thermo Fisher Scientific, Cat# R37118, RRID: AB_2556546), donkey anti-mouse Alexa Fluor 488 (1:500; Thermo Fisher Scientific, Cat# R37114, RRID: AB_2556542),and donkey anti-goat Alexa Fluor 594 (1:500; Thermo Fisher Scientific, Cat#A-11058, RRID: AB_2534105). The brain slices were washed three times with 0.1 M phosphate-buffered saline (pH 7.4). Before observation, the samples were mounted with 50% glycerin.
A confocal imaging system (FV1200, Olympus, Tokyo, Japan) was used to observe and record the stained sections. Imaris 7.7.1 software (www.bitplane.com) was used to reconstruct the co-expression structure of braintissue capillaries and pericytes in three dimensions. Finally, all images were organized using Adobe Photoshop/Illustration CS6 (Adobe Systems, San Jose,CA, USA), without making any modifications.
Western blot assay
The ischemic hemisphere was homogenized in radioimmunoprecipitation assay lysis buffer (Shanghai BestBio Science Biotechnology, Shanghai,China) and clarified by centrifugation (12,000 ×g, 15 minutes, 4°C).The protein concentration was determined using a bicinchoninic acid protein quantification kit (Cat# CW0014, CWbio, Beijing, China). Equal amounts of protein were then resolved in 10% or 12% sodium dodecyl sulfate polyacrylamide gel electrophoresis gels, and then transferred to polyvinylidene fluoride membranes (Millipore Corporation, Billerica, MA,USA). Next, the membranes were blocked for 1 hour with 5% nonfat dry milk at room temperature followed by incubation overnight with the primary antibodies rabbit anti-PDGFR-β (1:1000; Abcam, Cat# ab32570, RRID:AB_777165) and mouse anti-α-SMA (1:1500; Abcam, Cat# ab7817, RRID:AB_262054) at 4°C. After three washes, the membranes were incubated for 1 hour at room temperature with the secondary antibodies horseradish peroxidase conjugated Affinipure goat anti-mouse IgG (H+L) (1:10,000;Proteintech, Cat# SA00001-1, RRID: AB_2722565) and goat anti-rabbit IgG(H+L) (1:5000; Proteintech, Cat# SA00001-2, RRID: AB_2722564), respectively.The signal was visualized with high-sensitivity enhanced chemiluminescence luminous liquid and the images were captured using an Azure Bioimaging system (Azure C500, Azure Biosystems, Dublin, Ireland). The protein bands’intensity was quantified using Image-Pro Plus 6.0 software and normalized to the value of the corresponding tubulin (mouse, 1:5000; Abcam, Cat# ab8226,RRID: AB_306371) as an internal control.
Statistical analysis
Data are expressed as mean ± standard error of the mean (SEM). Statistical analysis was performed using SPSS 22.0 software (IBM Corp., Armonk, NY,USA). One-way analysis of variance followed by least significant difference test was used to determine the significance of differences among multiple independent samples. Differences were considered statistically significant atP< 0.05.
Results
Temporal alterations in CBF and infarct volume after cerebral I/R
The changes in the CBF before and after the operation were determined in all mice by laser speckle contrast imaging, which showed that the MCAO induced a significant CBF decline (28.63 ± 2.07% of the baseline, Figure 1A-F). The CBF after 2 hours of I/R (I/R 2 h) was significantly increased compared with that during the MCAO (65.09 ± 2.38% of the baseline, Figure 1F), however, it gradually decreased after 12 and 24 hours, returning to the level during the MCAO (Figure 1A-H). Furthermore, the brain infarct volume was significantly increased in the I/R groups relative to the sham group (I/R 2 h and 12 h:P<0.01; I/R 24 h:P< 0.001), and the severity of ischemia positively correlated with the reperfusion time, with the highest severity observed after 24 hours of reperfusion (r= 0.9852,P< 0.0001; Figure 1I, J and J1).
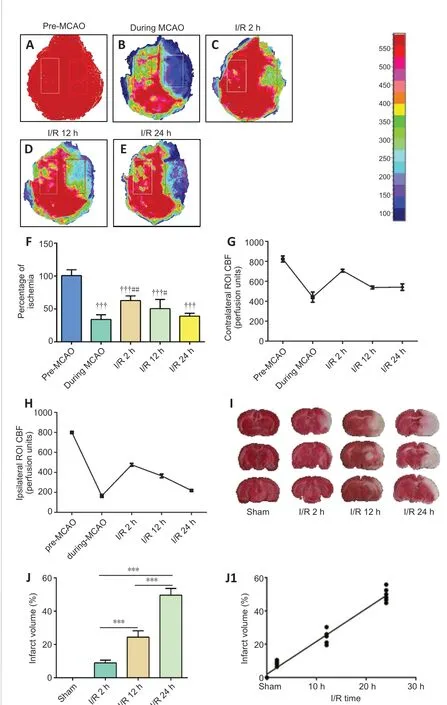
Figure 1 |The level of perfusion deficits increases with time after ischemia/reperfusion.(A-E) Representative CBF pseudocolor images in the ischemic cortex before and during the MCAO, and 2, 12, and 24 hours after ischemia/reperfusion. The color bar represents the CBF capacity (in perfusion units). As the reperfusion time increased,the CBF decreased. (F) Quantification of the relative CBF in the region of interest (ROI;% of the baseline of each animal group). (G, H) CBFs in contralateral and ipsilateral ROI before and during MCAO, and 2, 12, and 24 hours after ischemia/reperfusion.(I) Representative images of 2,3,5-triphenyltetrazolium chloride (TTC)-stained brain slices. The volume of cerebral infarction (white) increased with the prolongation of reperfusion time. (J) Quantitative analysis of cerebral infarct volume. Data are reported as mean ± SEM (n = 6 per group). †††P < 0.001, vs. pre-MCAO; #P < 0.05, ##P <0.01, vs. during MCAO; ***P < 0.001 (one-way analysis of variance followed by least significant difference test). CBF: Cerebral blood flow; MCAO: middle cerebral artery occlusion; ROI: region of interest.
Selection of the observation sites and successful marking of pericytes
Initially, we planned to focus on the cortex-penetrating arterioles and the branches from the epithelial layer to the middle cortex because in our previous study, thein vivotwo-photon imaging study of CBF focused on this area of the brain (Zhang et al., 2020). In view of the locations of cerebral infarction we observed, we decided to examine the cortex and hippocampus(Figure 2A). We selected two markers, α-SMA and PDGFR-β, to identify pericytes. The results showed that α-SMA was barely expressed in normal mouse brain tissues, and that it did not colocalize with PDGFR-β (Figure 2B and C). In the MCAO model mice, the cortex and hippocampus in the ischemic side of the brain tissue generally co-expressed α-SMA and PDGFR-β (Figure 2D and E).
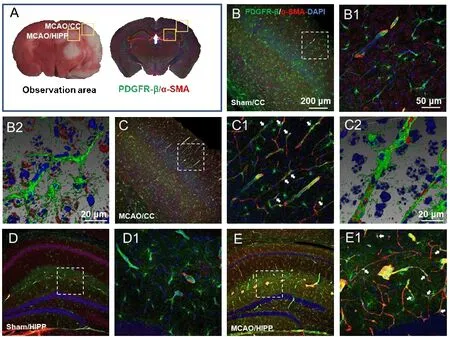
Figure 2 |Determination of the observation area as the cortex and hippocampus and successful labeling of pericytes.(A) According to the 2,3,5-triphenyltetrazolium chloride (TTC) staining, the observation sites of fluorescently stained brain sections were selected as the cerebral cortex (CC) and hippocampus (HIPP). (B-E) Representative photographs of the CC (B and C) and HIPP (D and E) showing alpha-smooth muscle actin (α-SMA; red, Alexa Fluor 594) and plateletderived growth factor receptor beta (PDGFR-β; green, Alexa Fluor 488)-labelled pericytes in the control (B and D) and experimental models (C and E). (B1-E1) Magnified images of the boxed areas in panels A-H showing α-SMA and PDGFR-β labeling in detail. (B2 and C2) Adjusted images of panels B and C with three-dimensional reconstruction in a sloping pattern. In the sham group, α-SMA was barely expressed. In the MCAO group, there were many cells co-labelled with α-SMA and PDGFR-β, which confirmed the success of pericyte labeling. α-SMA and PDGFR-β in all model mice presented similar patterns. The experiments were repeated six times. The co-expression sites of the two markers are shown by white arrows. Scale bars: 200 μm in B-E, 50 μm in B1-E1, 20 μm in B2 and C2.DAPI: 4′,6-Diamidino-2-phenylindole; PDGFR-β: platelet-derived growth factor receptor beta; α-SMA: alpha-smooth muscle actin.
The relationship between the expression of the pericyte marker PDGFR-β and the vascular endothelium
As observed in the CNS, around the capillaries lableled with CD31, the pericytes labelled with PDGFR-β had prominent elliptical cell bodies and elongated protrusions (white arrow, Figure 3A1-H1), which were largely circumferential at the arteriole side of the microvascular bed and at branching points and were distributed more longitudinally in the middle of the capillary bed, compared with the model group. This structure is the typical morphology of pericytes and has been mentioned in most previous studies(Hu et al., 2017; Yang et al., 2017). The number of PDGFR-β-positive cells did not show an increasing trend in relation to the time after reperfusion. We observed that the sham operation group had unconstricted microvessels near the PDGFR-β-positive pericytes and no pathological changes (yellow arrows),such as narrowing of the tube diameter and external force contraction (yellow arrows, Figure 3A, B, A1, and B1). In contrast, in the I/R 2 h, I/R 12 h, and I/R 24 h groups, the microvessels near the PDGFR-β-positive cells were narrowed in many places (Figure 3C-H, and C1-H1) and the microvessels were significantly deformed in the I/R 24 h group.
The relationship between the expression of the pericyte marker α-SMA and the vascular endothelium
Pericytes have been shown to express the contractile proteins needed to regulate blood flow, such as α-SMA. In the sham group, α-SMA expression was barely detected (Figure 4A, B, A1 and B1). In the I/R groups, α-SMAlabelled pericytes demonstrated a mesh-like appearance. The microvessels with α-SMA expression showed narrowing of the vessel diameter in multiple sites. Furthermore, the increased α-SMA expression positively correlated with the I/R time course (Figure 4C-H and C1-H1). Compared with the other groups, in the I/R 24 h group, the α-SMA-positive blood vessels narrowed and deformed the most, and even closed completely.
Changes in the α-SMA and PDGFR-β protein expression at different time points after cerebral I/R
We measured the pericyte location and the diameter of microvessels nearby by fluorescence immunohistochemistry and histochemistry (Figure 5AD). Quantification of the staining intensity revealed that the diameter of microvessels in the I/R group was significantly narrower than that in the sham group (Figure 6A). Furthermore, analysis of α-SMA expression showed that its increased expression positively correlated with the reperfusion time (I/R 2 hvs. sham,P< 0.001; I/R 12 hvs. I/R 2 h,P< 0.001, Figure 6B;r= 0.8552,P< 0.0001, Figure 6B1). Additionally, western blotting confirmed that cerebral I/R significantly upregulated α-SMA in the I/R 2 h, I/R 12 h, and I/R 24 h groups compared with the sham group, and that this upregulation was timedependent (I/R 12 hvs. sham,P< 0.05; I/R 24 hvs. sham,P< 0.001, Figure 6C;r= 0.9277,P< 0.0001, Figure 6C1 and C2). Similarly, the expression level of PDGFR-β in the I/R group was significantly higher than that in the sham group (I/R 2 hvs. sham,P< 0.01; I/R 12 hvs. sham,P< 0.001; I/R 24 hvs. sham,P< 0.05; Figures 6D and D1). However, the PDGFR-β expression increase was transient.
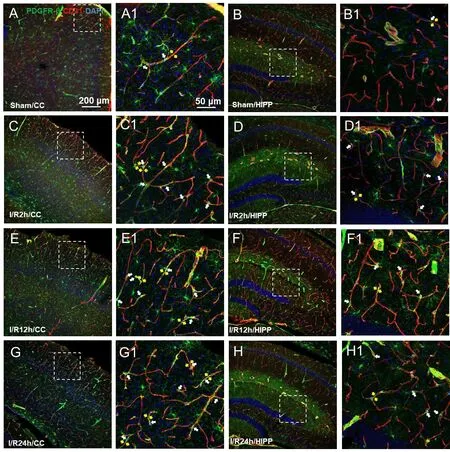
Figure 3 |Changes in the expression of the pericyte marker PDGFR-β at differenttime points after cerebral ischemia/reperfusion.(A-G) Representative photographs of the cerebral cortex (CC; A, C, E, G) and hippocampus (HIPP; B, D, F, H) showing platelet-derived growth factor receptor beta(PDGFR-β; green, Alexa Fluor 488)-labelled pericytes and CD31 (red, Alexa Fluor 594)-labelled blood vessels in the control (A and B), and 2 (C and D), 12 (E, F), and 24 hours after ischemia/reperfusion (G, H). (A1-H1) Magnified photographs of the boxed areas in panel A-H showing PDGFR-β and CD31 labeling in detail. In the sham group,pericytes had a conspicuous protruding ovoid cell body with long thin processes that coursed along the capillary for long distances and were embedded within the basement membrane. After 2, 12, and 24 hours of cerebral ischemia/reperfusion, the morphology of the capillaries near the pericyte cell bodies (shown by white arrows) changed,with distortion and even narrowing of the tube diameter (shown by yellow arrows),which positively correlated with the reperfusion time. The constriction of pericytes on capillaries in all model mice presented a similar pattern. The experiments were repeated six times. Scale bars: 200 μm in A-H, and 50 μm in A1-H1. CC: Cerebral cortex; DAPI:4′,6-diamidino-2-phenylindole; PDGFR-β: platelet-derived growth factor receptor beta;HIPP: hippocampus.
Discussion
In the present study, we demonstrated the pathological changes in mouse brain CBF and cerebral infarction at different time points after cerebral I/R.Taking advantage of this experimental model, we showed the morphology and the changes in different pericyte markers in normal brain tissue and after cerebral I/R (Figure 7). The contraction of pericytes plays an important role in the restoration of CBF. Thus, pericytes have become a promising target for the treatment of ischemic stroke.
Pericytes are closely related to cerebral capillaries
Microvessels of the CNS have the highest pericyte coverage of any organ.Pericytes are vascular mural cells embedded within the vascular basement membrane of blood microvessels (Sweeney et al., 2016; Zheng et al., 2021),where they make specific focal contacts with the endothelium and localize to terminal arterioles, capillaries, and postcapillary venules (Attwell et al.,2016; Caporarello et al., 2019). Pericytes and endothelial cells form numerous direct contacts, including peg-socket contact, adhesion plaques, N-cadherin junctions, and gap junctions (Gautam and Yao, 2018). CNS pericytes exert a large variety of functions, including CBF regulation, maintenance of the blood-brain barrier integrity, and modulation of angiogenesis. These functions depend on appropriate interactions and signaling between pericytes and other cells at the blood-brain barrier, especially endothelial cells (Huang,2020). We used pericyte markers and a microvascular marker and found that a large number of pericytes were expressed in the periphery of the vascular endothelium. In previous studies of neurovascular units, pericytes have been neglected for a long time. Furthermore, in previous studies of stroke, our observations of microvessels have increasingly focused on pericytes (Yang et al., 2017; Dalkara et al., 2019). Therefore, it is of great significance to study the relationship between pericytes and the CNS under physiological and pathological conditions.

Figure 4 |The expression of the pericyte marker α-SMA at different time points after cerebral ischemia/reperfusion.(A-G) Representative images of the CC (A, C, E, G) and HIPP (B, D, F, H) showing α-SMA(green, Alexa Fluor 488)-labelled pericytes and CD31 (red, Alexa Fluor 594)-labelled blood vessels in the control (A and B), and 2 (C and D), 12 (E, F), and 24 hours after ischemia/reperfusion (G, H). (A1-H1) Magnified photographs of the boxed areas in panels AH showing α-SMA and CD31 labeling in detail. In the sham group, α-SMA was often absent but readily detected in the pathological conditions. After 2, 12, and 24 hours of reperfusion, α-SMA-labelled pericytes demonstrated a mesh-like appearance. The α-SMA expression positively correlated with the reperfusion time, and it showed obvious characteristics of narrowing of the microvessel diameter (white arrows). The constriction and activation of pericytes on capillaries in all model mice presented a similar pattern.The experiments were repeated six times. Scale bars: 200 μm in A-H, and 50 μm in A1-H1. CC: Cerebral cortex; DAPI: 4′,6-diamidino-2-phenylindole; α-SMA: alpha-smooth muscle actin; HIPP: hippocampus.
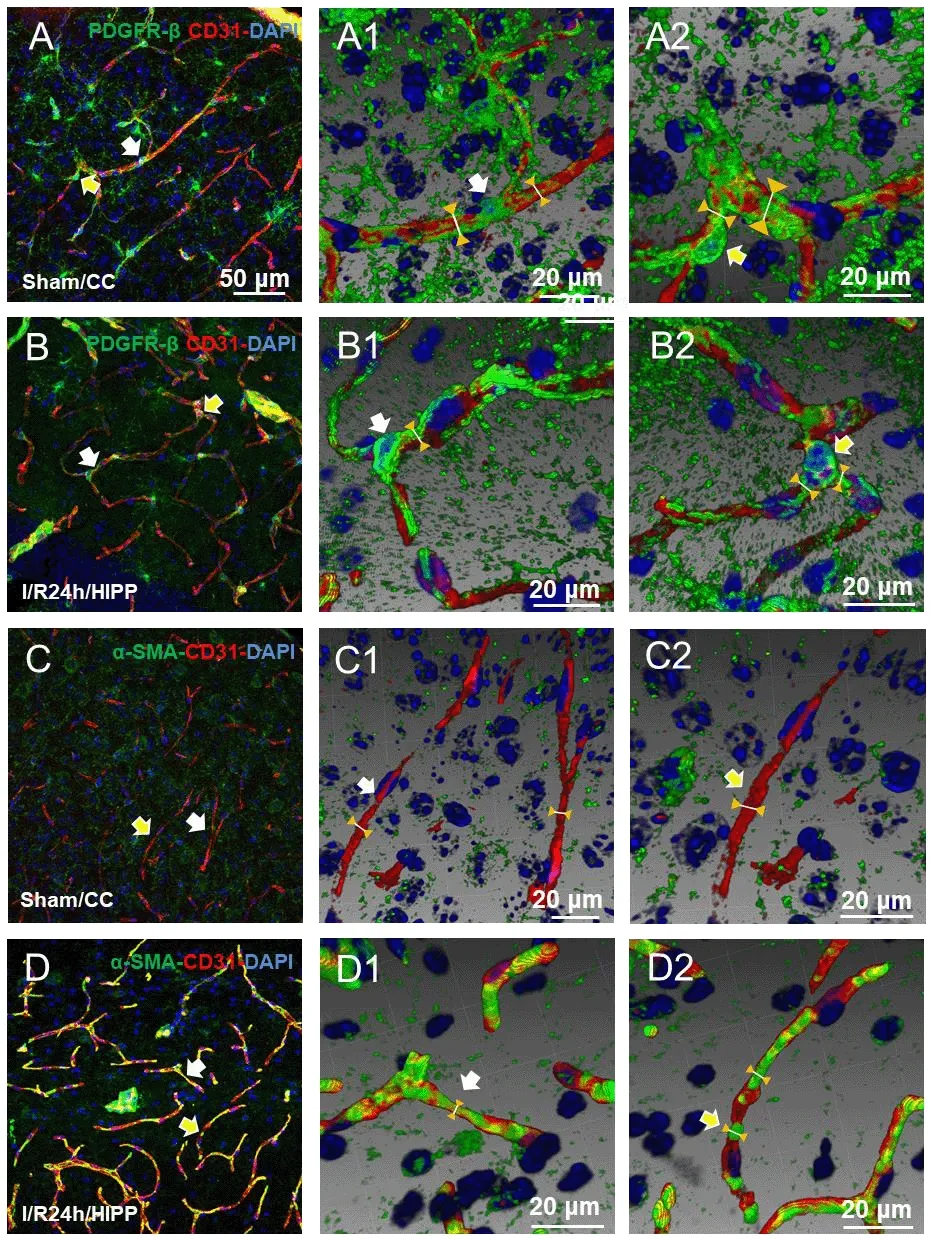
Figure 5 |Three-dimensional reconstruction shows the spatial relationship between PDGFR-β and α-SMA expression and the capillaries.(A1, A2-D1, D2) Adjusted images of panels A-D with three-dimensional reconstruction in a sloping pattern showing the PDGFR-β + CD31 (A1, A2: sham group; B1, B2: I/R 24h group) and α-SMA + CD31 (C1, C2: sham group; D1, D2: cerebral ischemia/reperfusion 24 hours group) labeling. Compared with the sham group, the diameter of the capillaries near the pericytes in the cerebral ischemia/reperfusion 24 hours group was significantly reduced. The arrows in panels B and B2 indicate labeling in the same region. Scale bars:50 μm in A-D, and 20 μm in A1, A2-D1, D2. CC: Cerebral cortex; DAPI: 4′,6-diamidino-2-phenylindole; HIPP: hippocampus; PDGFR-β: platelet-derived growth factor receptor beta; α-SMA: alpha-smooth muscle actin.
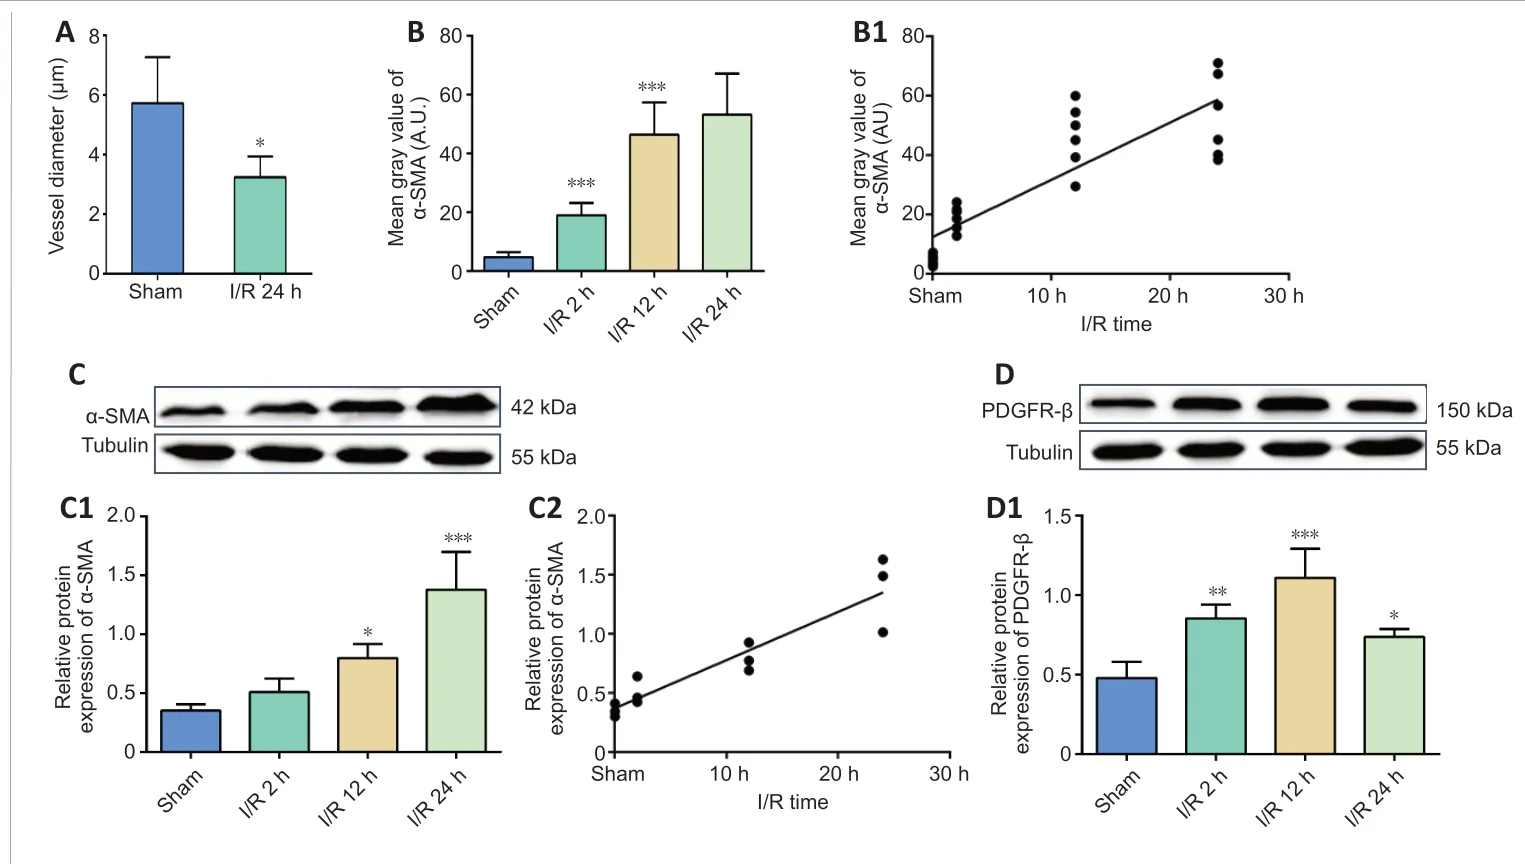
Figure 6 |Cerebral ischemia/reperfusion promotes α-SMA and PDGFR-β expression.(A) Diameter change at pericyte locations. (B, B1)Average fluorescence quantitative analysis of α-SMA.(C, D) α-SMA and PDGFR-β protein expression was analyzed by western blotting. (C1) The relative expression of α-SMA was normalized to tubulin expression. (C2) The correlation analysis between the α-SMA protein expression and the reperfusiontime. (D1) The relative expression of PDGFR-β was normalized to tubulin expression. Data are reported as mean ± SEM (n = 6 per group). *P < 0.05, **P <0.01, ***P < 0.001, vs. sham group (one-way analysis of variance followed by least significant difference test). PDGFR-β: Platelet-derived growth factor receptor beta; α-SMA: alpha-smooth muscle actin.

Figure 7 |A simplified illustration of the different morphology and expression changes in pericytes of brain capillaries.Mesh pericytes were α-SMA-positive, and thin-stranded pericytes were PDGFR-βpositive. In contrast to the normal area, the pericytes in the ischemic area have a contraction effect on the capillaries, which is an important cause of the no-reflow phenomenon. PDGFR-β: Platelet-derived growth factor receptor beta; α-SMA: alphasmooth muscle actin.
Pericyte labeling and its limitations
While pericytes have many important functions in the CNS vasculature, their involvement in the regulation of CBF remains controversial. The morphological and genetic markers of pericytes compared with smooth muscle cells are not exclusive. Several markers have been used to identify pericytes, including α-SMA, desmin, NG-2, PDGFR-β, and CD13 (Smyth et al., 2018; Uemura et al., 2020). Currently, there is no single molecular marker that can be used to unequivocally and exclusively label pericytes (Costa et al., 2018). Pericytes are heterogeneous regarding their distribution, phenotype, marker expression,origin, and function (Sena et al., 2018), and their expression is dynamic. For example, α-SMA is not appreciably expressed by CNS pericytes under normal circumstances (Ozerdem and Stallcup, 2003). Furthermore, the claim that normally there is no detectable α-SMA in pericytes contradicts both early histology studies (Herman and D’Amore, 1985) and the observations that pericytes can constrict capillaries (Hall et al., 2014; Rungta et al., 2018).This may be related to the labeling method (Alarcon-Martinez et al., 2018).Presently, the state-of-the-art identification of pericytes in tissue preparations relies on at least two pericyte molecular markers; therefore, we must keep in mind that unambiguous positive identification of pericytes is still a problem.We used immunofluorescence to stain brain tissue sections to label and observe pericytes. However, pericyte contraction is a dynamic process, hence dynamic observationin vivois a better way to observe pericyte contraction of capillaries. For example, a two-photon microscope was used to compare pericyte transgenic mice before and after modeling (Hall et al., 2014). This is a great inspiration for our future research on the relationship between pericytes and microcirculation.
The no-reflow phenomenon
The no-reflow phenomenon refers to the observation that when an organ is made ischemic by occlusion of a large artery supplying it, restoration of patency in that artery does not restore perfusion to the microvasculature supplying the parenchyma of that organ (Kloner et al., 2018; Hørlyck et al., 2021). We showed that following 2 or more hours of ischemia, parts of the brain did not reperfuse after the proximal flow was restored. The size of perfusion deficits increased with longer periods of ischemia. These nonperfused brain regions were often interspersed within areas of perfusion and sometimes resulted in a mottled appearance. However, the contralateral flow was also decreased. When modeling cerebral ischemia on one side of a mouse brain, it will affect the overall CBF. Additionally, C57BL/6 mice have poor development of the posterior communicating arteries that connect the carotid artery and the vertebrobasilar arterial system in the brain, thus we speculated that this is the cause of the decrease in the contralateral CBF. In our previous research (Ma et al., 2019), the cerebral I/R injury that resulted in blood-brain barrier leakage caused an increase in brain water content and brain edema in the ipsilateral hemisphere. Hence, we think that the edema of the brain tissue on the ischemic side had a squeezing and oppressive effect on the contralateral side, causing different degrees of CBF decline in the contralateral brain tissue. Brain capillary pericytes have been suggested to play a role in the regulation of CBF under physiological and pathophysiological conditions (Peppiatt et al., 2006). Furthermore, pericytes have been shown to cause capillary constriction under ischemic conditions, and thus have been suggested to be involved in the “no-reflow” phenomenon (Yemisci et al., 2009; Hall et al., 2014; Zagrean et al., 2018; Uemura et al., 2020). Other studies suggest that swelling of glial cells, increased blood viscosity, and erythrocyte aggregation are the main culprits in causing no-reflow in the brain (Chiang et al., 1968). Although pericytes are involved in the no-reflow phenomenon, the molecular and cellular mechanisms involved in this process remain to be examined.
The significance of the expression of the two pericyte markers PDGFR-β and α-SMA
We subcategorized the pericytes into two groups based on the appearance of two markers: mesh and thin-stranded pericytes, with the latter being the canonical pericyte type, as all cells examined in microvessels had protruding ovoid cell bodies, a feature historically used to define pericytes in the brain and other organs (Kisler et al., 2017). Mesh pericytes are α-SMA-positive and thin-stranded pericytes are PDGFR-β-positive. Although the two markers showed different pericyte morphologies, our findings indicated that pericytes were involved in abnormal contraction during ischemia. In this study, we chose CD31 as a vascular marker. It has been shown that CD31 is preferably expressed in capillaries (Wang et al., 2020). Therefore, our findings suggest that we observed pericyte constriction through the capillary. Several studies have concluded that ensheathing pericytes should be considered a transitional mural cell form distinct from smooth muscle cells and capillary pericytes (Grant et al., 2019; Grubb et al., 2020; Khennouf et al., 2018). Furthermore, it has been suggested that ensheathing pericytes are α-SMA-positive and occupy proximal branches of penetrating arteriole offshoots. It should be noted that the cells described here as ‘‘ensheathing pericytes’’ have also been referred to as ‘‘precapillary smooth muscle cells’’ (Dalkara, 2019). We observed that the narrowing of the blood vessel diameter was mostly near PDGFR-β-positive pericytes, but the position of α-SMA-positive pericytes was often where the diameter of the blood vessel was narrowed, or even completely occluded.This may be related to the smooth muscle cell properties of α-SMA, which is a contractile protein that plays the role of pericytes in regulating the diameter of microvessels.
Contraction of pericytes is an important factor affecting the recovery of CBF after cerebral I/R
The contractile properties of pericytes have been suggested to contribute to the deterioration of CNS vascular reperfusion following ischemic stroke.Indeed, examining PDGFR-β and α-SMA labeling at the blockage sites revealed that many blockages occurred close to pericytes, in some cases with pericyte processes appearing to visibly constrict the capillary at the blockage location.The western blot results showed that, slightly different from α-SMA, the protein expression of PDGFR-β in the model group was higher than that in the sham operation group, but there was no positive correlation with the reperfusion time. Therefore, we hypothesized that the shrinkage of pericytes positively correlates with the expression of α-SMA. It is uncertain whether over a long period of time, cerebral pericyte death in rigor occurs and contributes to a long-lasting reduction in blood flow (Hall et al., 2014), and whether prevention of pericyte death would produce a greater restoration of flow (O’Farrell et al., 2017). To reduce no-reflow therapeutically by preventing pericyte constriction of capillaries, it is necessary to develop agents that act selectively on pericytes.
Conclusion
Our current results demonstrated that after stroke, ischemia causes pericytes to contract capillaries, and as the reperfusion time increases, the pericytes’contraction increases. Thus, this study provides more neurovascular information for evaluating the clinical no-reflow phenomenon after vascular recanalization, i.e., pericytes regulate CBF by changing the diameter of microvessels. Furthermore, we demonstrated that different pericyte biomarkers have different expression patterns.
Author contributions:Study conception and design: FFC, WZB; model establishment: SZ, XJL, HFS; histochemical staining and sample observation:SZ, JW, YS, CYM, MYX, XW; data analysis: YZ, QGW, XQW; manuscript draft: SZ,FFC, WZB. All authors read and approved the final manuscript.
Conflicts of interest:YZ is an employee of Shineway Pharmaceutical Group Ltd. No other actual or potential conflict of interese is declared.
Open access statement:This is an open access journal, and articles are distributed under the terms of the Creative Commons AttributionNonCommercial-ShareAlike 4.0 License, which allows others to remix, tweak, and build upon the work non-commercially, as long as appropriate credit is given and the new creations are licensed under the identical terms.
Open peer reviewers:Alberto Pérez de Vargas Martinez, Hospital Universitario Puerta del Hierro Majadahonda, Spain; Rodolfo Pinto-Almazán, Hospital Regional de Alta Especialidad Ixtapaluca, Mexico.
- 中国神经再生研究(英文版)的其它文章
- Functional in vivo assessment of stem cell-secreted prooligodendroglial factors
- iGluR expression in the hippocampal formation, entorhinal cortex,and superior temporal gyrus in Alzheimer’s disease
- Exploiting Caenorhabditis elegans to discover human gut microbiotamediated intervention strategies in protein conformational diseases
- N-methyl-D-aspartate receptor functions altered by neuronal PTP1B activation in Alzheimer’s disease and schizophrenia models
- Aminopeptidase A and dipeptidyl peptidase 4: a pathogenic duo in Alzheimer’s disease?
- Ubiquitin homeostasis disruption,a common cause of proteostasis collapse in amyotrophic lateral sclerosis?

