Effects of Different Land Use Patterns on Soil
Heping MA Wenyin ZHAO
Properties in the Lower Reaches of Niyang River of Tibet
Abstract [Objectives] This study was conducted to provide scientific basis for rational utilization and sustainable management of agricultural and forestry land resources in southeast Tibet.
[Methods]Soil samples were stratified by standard sampling method (0-10, 10-20, 20-40, 40-60 and 60-100 cm) in the lower reaches of Niyang River Basin under three different types of land cover of forest, grassland and farmland. The effects of different land use on soil properties were studied.
[Results] Soil temperature and humidity affected soil properties together. The pH value and bulk density increased with the increase of soil depth for farmland, grassland and forest soil. Natural forest had the highest soil nutrient contents, followed by farmland, and grassland had the lowest soil nutrient contents. Soil organic carbon and organic nitrogen contents decreased with the increase of soil depth in the three land use patterns, and the surface aggregation of soil organic carbon and organic nitrogen was more obvious. Compared with natural vegetation, the organic carbon content of farmland was significantly reduced by 8.5%-15.3% and the organic nitrogen content by 11.1%-11.7%.
[Conclusions]The change of land use is a proper way to benefit the development of soil properties and improve soil properties and quality in Niyang River Basin.
Key words Soil nutrient; Soil organic carbon; Land cover; Canonical correspondence analysis; Tibet
Received: August 28, 2021 Accepted: October 30, 2021
Supported by Natural Science Foundation of Tibet Autonomous Region (XZ2019ZRG-60).
Heping MA (1977-), male, P. R. China, professor, PhD, devoted to research about Tibet Plateau ecology and global changes.
*Corresponding author. E-mail: 285477889@qq.com.
As the basic attribute of soil fertility, soil nutrients determine the yield of crops and the productivity of farmland ecosystems. Their distribution characteristics are the premise and foundation of the rational use of soil resources, soil fertility evaluation and soil nutrient management. Soil is a heterogeneous and changing space-time continuum formed by the combined action of local factors such as topography, vegetation, and human activities, so soil nutrients have a high degree of spatial heterogeneity[1].
Soil organic carbon (SOC), as the main component of the soil carbon pool, not only provides a lot of energy for plant growth and the life activities of soil microorganisms, but also represents the core index of soil fertility and basic soil fertility[2]. Land cover, as the main form of human disturbance of surface soil activities, is one of the most important factors affecting the carbon cycle of terrestrial ecosystems[3]. The distribution characteristics and dynamic changes of soil organic carbon are affected by environmental factors such as climate, vegetation and topography, as well as by the nature of the soil itself, land cover, and man-made management measures[4]. Existing studies have shown that land cover is the most important man-made activity that causes the atmospheric CO2 concentration to increase sharply after the burning of fossil fuels[5-6]. Its change process is often accompanied by changes in soil quality and the fixation and release of SOC, and even affects the source/sink properties of terrestrial ecosystems[7]. The change of land cover can regulate the quantity and quality of organic carbon input into the soil[8], affect the physical and chemical properties and processes of the soil[9-10], and change the structure and activity of soil microbial communities[11-12], thereby affecting the decomposition rate and stability of organic carbon[13] and ultimately leading to changes in soil properties.
Due to the unique high-altitude terrain and climatic environment, the organic carbon content of the soil in the Qinghai-Tibet Plateau is very large[14-15], and it is very sensitive to climate change and the interference of human activities, and plays a pivotal role in the management of carbon sources/sinks in China and even the world. Therefore, it is particularly important to clarify the response law of soil organic carbon content and distribution characteristics of the Qinghai-Tibet Plateau to changes in the external environment[16]. The Niyang River Basin is located in the southeast of the Tibet Autonomous Region, on the left bank of the middle and lower reaches of the Yarlung Zangbo River. The Niyang River is a first-level tributary of the international river—the Yarlung Zangbo River. It is located at the intersection of humid and semi-humid climate zones, and the vegetation landscape has obvious horizontal and vertical zoning. From west to east, the vegetation transitions from grassland and shrubs to forests. Specifically, woodland has the widest distribution area, mainly in the northeast, and cultivated land and grassland are mainly distributed along the Niyang River valley. With the development of the urbanization process of Nyingchi City, the intensity of human activities in the watershed has increased year by year, and the degree of disturbance to nature is strong. The transformation of agricultural land use not only brings great challenges to maintaining forest ecosystems, but also has potential impacts on soil properties. However, at present, there are few reports on the impact of different land use methods in this area on soil properties. In this regard, we applied for a study on the effects of different land use patterns on soil properties in the lower reaches of the Niyang River in southeastern Tibet, with an attempt to answer the scientific question "How do soil properties under different land covers change?" The research results will not only help to understand the stability of soil organic carbon in the Qinghai-Tibet Plateau, but also provide a basis for the rational use and sustainable management of agricultural and forestry land resources in southeastern Tibet.
Materials and Methods
General situation of the sampling area
The experiment was carried out in the lower reaches of the Niyang River in Nyingchi area (N 29°44′-29°33′, E 94°0915′-94°28′). The average altitude of this area is about 3 000 m; the annual average temperature is 7-16 ℃, and the annual accumulated temperature above 10 ℃ is 2 272 ℃; the frost-free period is about 180 d; and the annual average precipitation is about 600-800 mm. This area has a plateau temperate monsoon semi-humid and semi-arid climate, which is warm, and it has a long frost-free period, abundant heat and abundant rainfall. However, the annual rainfall is unevenly distributed, the dry and wet seasons are obvious, and the precipitation from June to September accounts for more than 80% of the whole year. The soil types in the area are diverse, including subalpine meadow soil, swamp meadow soil, brown earth, aeolian sandy soil and stony soil[17].
Soil sample collection
The collection of soil samples in this experiment was carried out in August 2019. Three kinds of typical farmland (all planted with wheat) representing local planting management models were selected from Gengzhang Township to Mirui Township in the lower reaches of the Niyang River as the research objects. In order to maintain the consistency of the research objects, it was required that the farming time was more than 30 years, and plowing should be carried out once before crops were planted every year. In each farmland, 5 plots (5 m×5 m) were randomly selected, the soil samples of 5 soil layers (0-10, 10-20, 20-40, 40- 60, 60-100 cm) were randomly collected from each plot, and the soil samples of different layers were, respectively, mixed into one sample replicate. Soil samples were collected under the forest and grassland near each farmland (within a distance of 400 m) by the same sampling method. A total of 45 soil samples were obtained. The collected soil samples were transported back to the laboratory and sieved through a 2 mm sieve. After removing rocks, plant residues and soil animals and other debris, they were allowed to dry naturally for determination of soil properties.
General situation of the sampling area
The selected forest was a temperate coniferous and broad-leaved mixed forest composed of the main tree species of Quercus aquifolioides, Picea likiangensis var. linzhensis and Pinus densata. Other tree species included Amygdalus mira, and understory trees included Piptanthus concolor, Rosa sp., Berbens thunberii, Rumex nepalensis, Potentilla chinensis, and various ferns, Artemisia and Poaceae. The selected grassland was natural grassland with light grazing, and the main plants include Carex, Aster, Gramineae, Duchesnea indica, Taraxacum mongolicum and Rubus biflorus.
Determination of soil physical and chemical properties
The pH of the soil was determined by extracting the soil with 1 mol/L KCl (water-soil ratio 2.5∶1) and measuring by the potentiometric method. The soil bulk density was determined by the cutting ring method. The total nitrogen in the soil was determined with an automatic Kjeldahl nitrogen analyzer[18]. Soil available phosphorus was determined by 0.5 mol/L NaHCO3 extraction-molybdenum antimony colorimetric method. The determination of soil available potassium adopted sodium tetraphenylborate turbidimetry. The total phosphorus and total potassium of the soil were determined by the perchloric acid-sulfuric acid method. The soil organic carbon was determined by the high-temperature potassium dichromate heating oxidation-volume method[19]. The soil organic nitrogen was determined by potassium persulfate ultraviolet spectrophotometry.
Data analysis
Statistical analysis on the measurement results was performed with the statistical software of Excel 10.0 and SPSS 20.0 For windows, and plotting used Canon for 4.5.
Results and Analysis
Diurnal variations of soil temperature and moisture at different depths
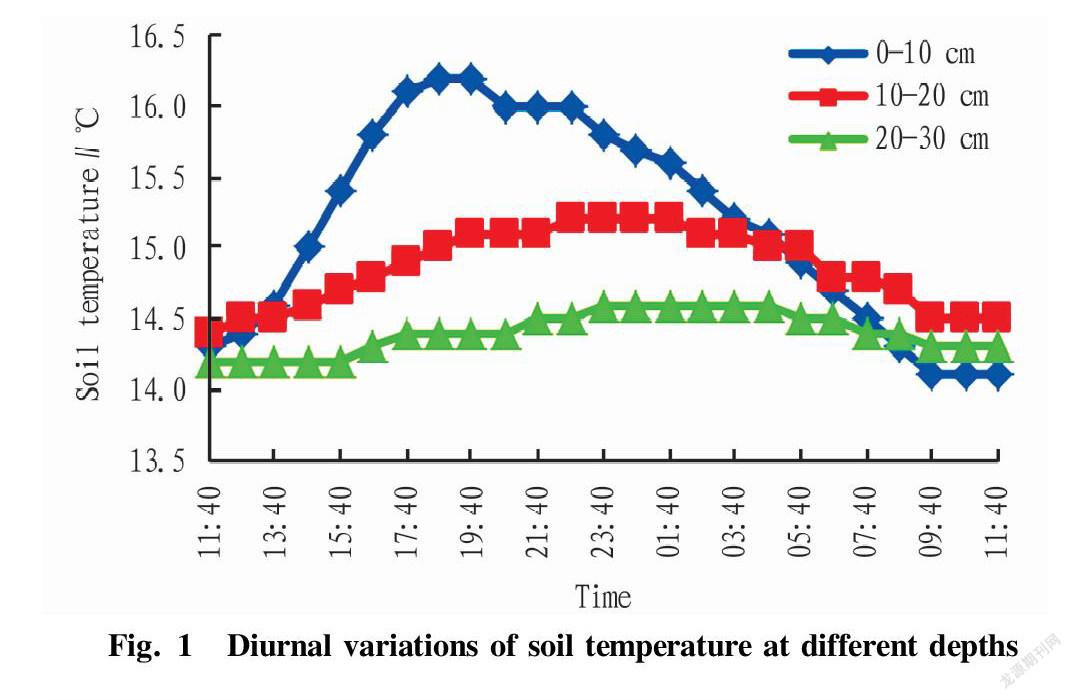
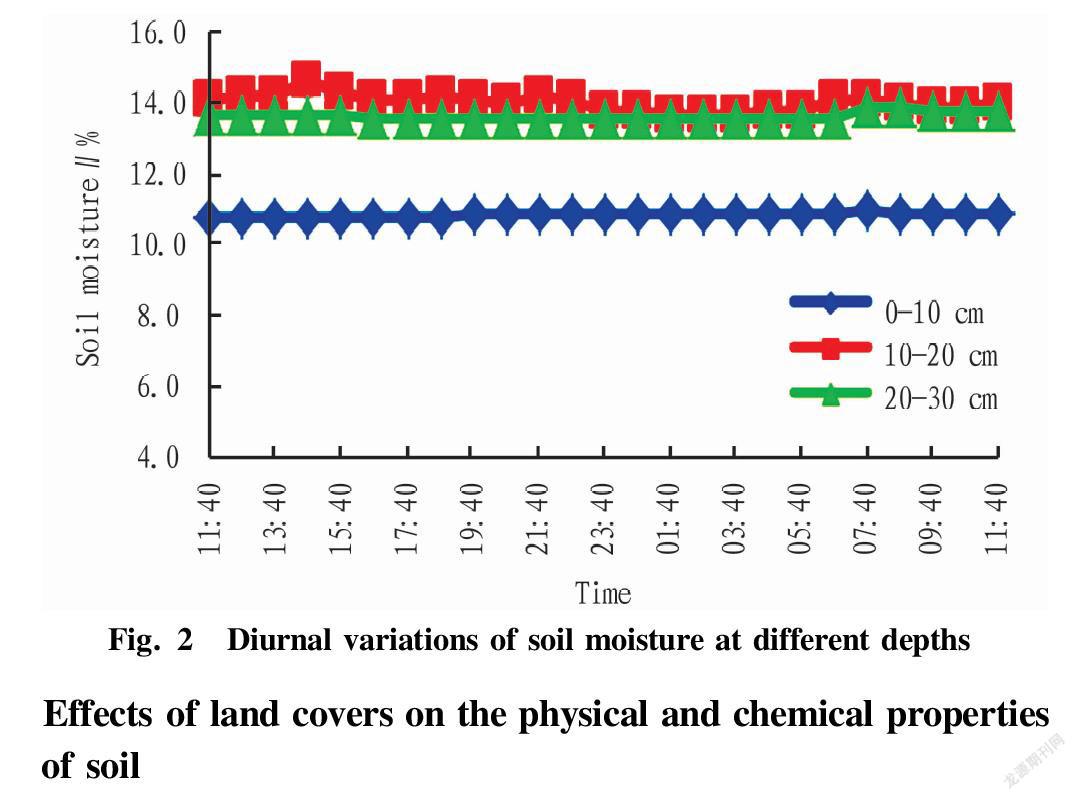
In this study, we used an NZ99 series soil temperature and humidity recorder to measure the changes in soil temperature and humidity of forest soil at different depths of 0-10, 10-20, and 20-30 cm within 24 h. The diurnal changes of soil temperature and humidity at different depths are shown in Fig. 1 and Fig. 2.
Fig. 1 reflects the diurnal variations of soil temperature at different depths: the soil temperature of the 0-10 cm varied greatly, and as the depth increased, the soil temperature changed less until it became stable. The maximum solar radiation appeared around 15:40 in the afternoon of the same day, and then the solar radiation gradually weakened, but the ground heat still accumulated, and the ground temperature continued to rise. The heat accumulation reached a maximum at about 18:40, when the ground temperature reached a maximum value. After the surface got hot during the day, the heat transferred downwards and was blocked layer by layer, so the soil heat gain decreased as the depth increased.
Fig. 2 reflects the diurnal variations of soil moisture at different depths: the soil of 0-10 cm was exposed to strong solar radiation, and showed rapid temperature changes, and the soil moisture evaporation was strong, so the soil moisture value was the minimum (10.772%). As the depth increased, the solar radiation received by the soil of 10-20 cm weakened, and the soil temperature changed slowly. Coupled with rainfall infiltration, the soil moisture was at the maximum (13.924%). The solar radiation in the soil of 20-30 cm was weaker, but due to the interception of rainfall by the upper soil, the soil moisture was between 0-10 and 20-30 cm (13.568%). The same method was used to measure soil temperature and humidity at different levels of farmland and grassland, and their changes showed the same trends as the changes in forest soil temperature and humidity.
Agricultural Biotechnology2022
Effects of land covers on the physical and chemical properties of soil
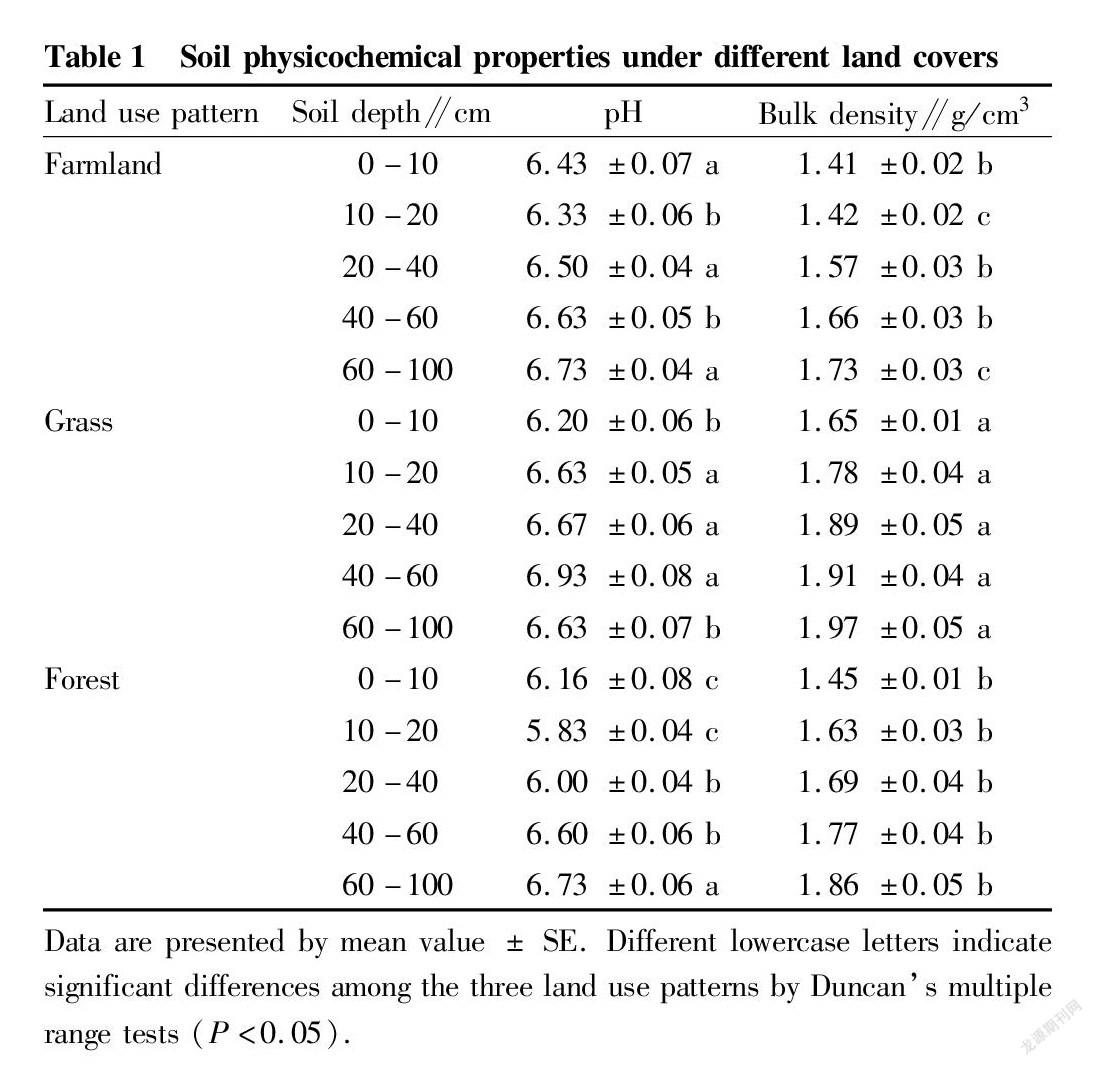
In this study area, the changes in soil physical and chemical properties under different land cover are shown in Table 1.
It can be seen from Table 1 that the soil pH values of farmland, grassland and forest in the study area increased with the increase of soil depth. Among them, the pH values of farmland, grassland and forest were compared: grassland (6.612)>farmland (6.524)>forest (6.264), and the difference in soil pH between 0-10 and 10-20 cm was significant (P<0.05), while the differences in soil pH between 20-40, 40-60 and 60-100 cm were not significant (P>0.05). In addition, this study showed that the soil bulk density increased with the increase of soil depth, and the overall average variation range was 0.11-0.97 g/cm3. In terms of the bulk density comparison of the three different types of land cover, the result was obtained as grassland (0.840)>forest (0.680)> farmland (0.346), and the soil bulk density between 10-20 and 60-100 cm had significant differences (P<0.05), while the differences in soil bulk density between 0-10, 20-40 and 40-60 cm were not significant (P>0.05).
Effects of different land covers on soil nutrient contents
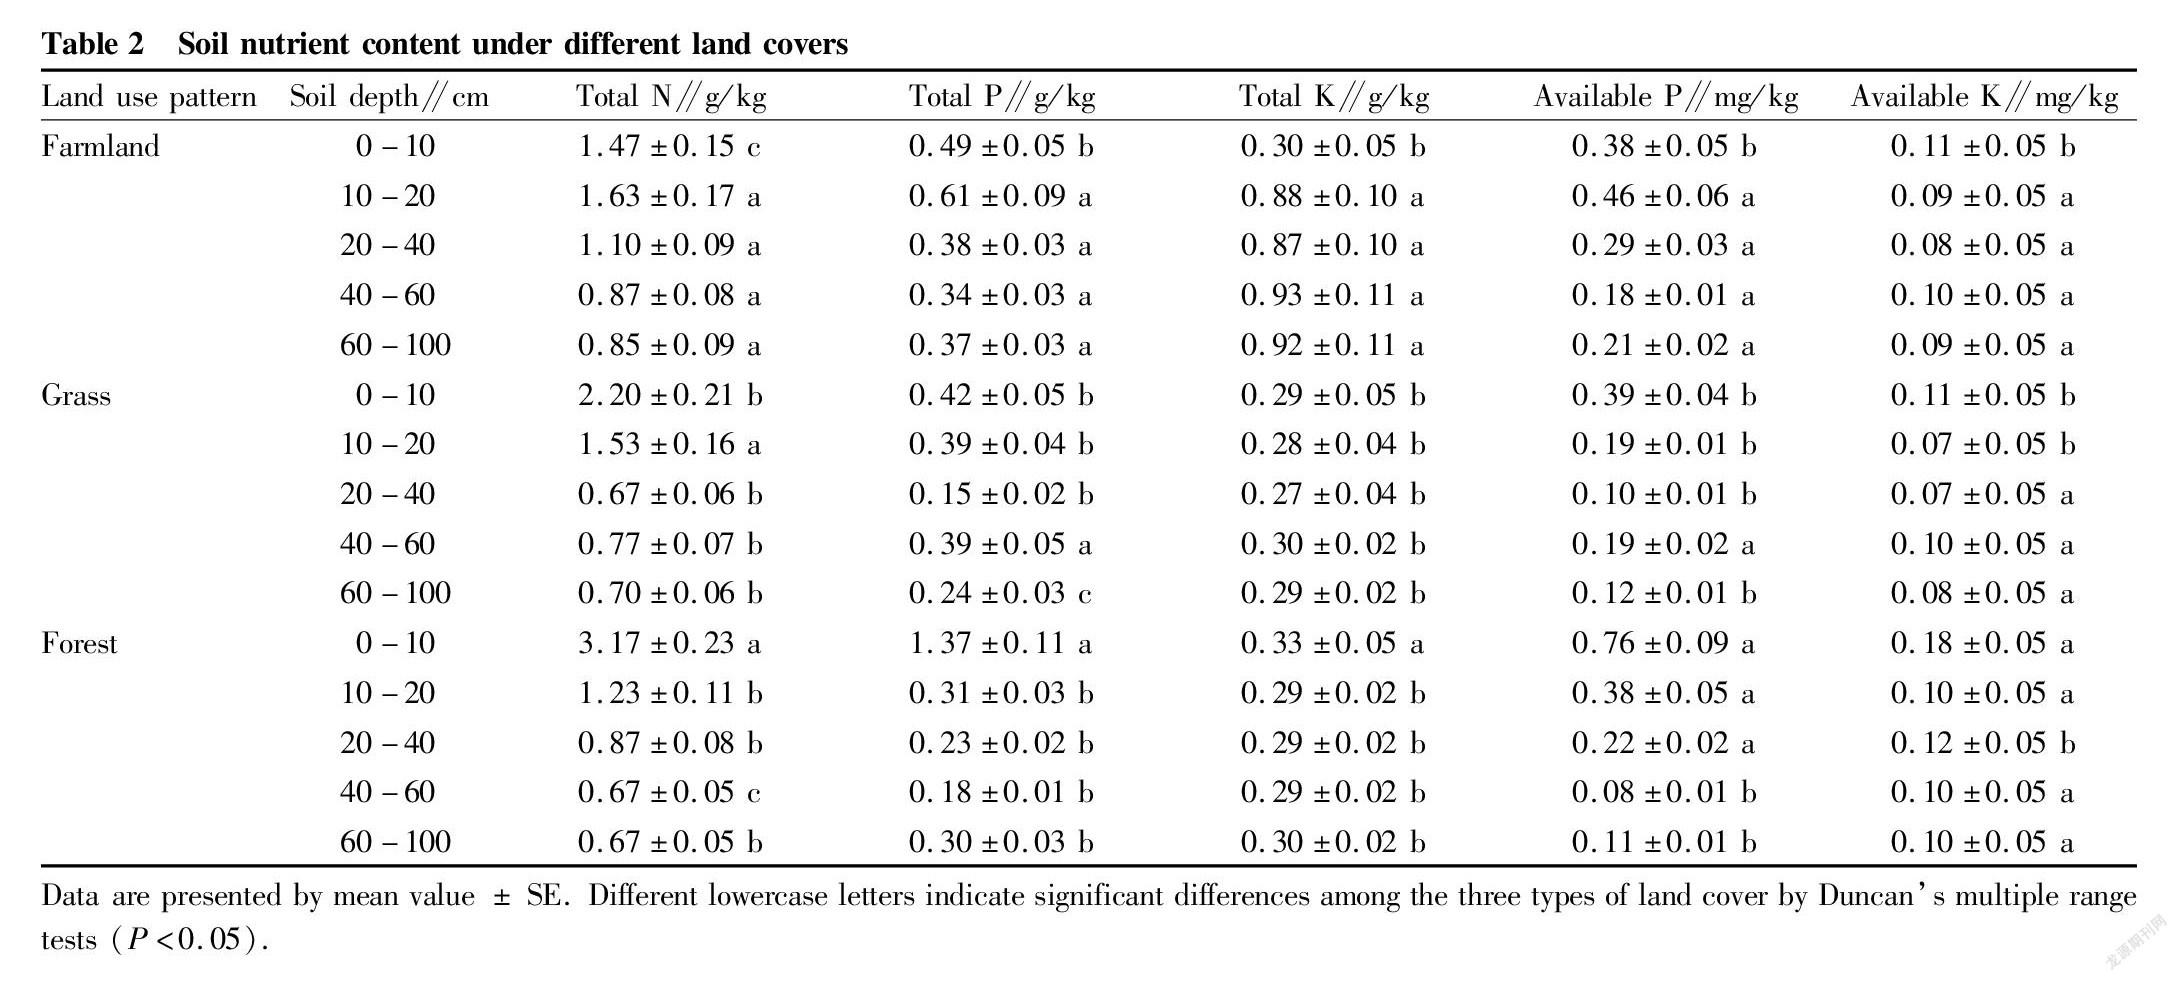
The soil nutrient contents under different land covers in this study area are shown in Table 2.
It can be seen from Table 2 that there were differences in the contents of various nutrients in the soil under the three types of land cover: farmland, grassland and forest. As far as total nitrogen and total phosphorus were concerned, their contents decreased with the increase of soil depth. Among the total nitrogen contents of farmland, grassland and forest, the total nitrogen content of forest was the highest, reaching 1.32 g/kg, the total nitrogen content of grassland was the lowest at 1.17 g/kg, and the total nitrogen content of farmland was between the two, 1.18 g/kg. Similarly, the total phosphorus contents of the three were compared: forest (1.32 g/kg)> farmland (1.18 g/kg)> grassland (1.17 g/kg). The total potassium content of farmland increased with the increase of soil depth, and its variation range was 0.78-0.92, while the total potassium contents of grassland and forest decreased with the increase of soil depth, but the magnitude of variation was small, indicating that farming measures significantly affected the total potassium content of the soil. As far as available phosphorus was concerned, with the increase of soil depth, its content showed a gradual decrease trend, and the order obtained was forest (0.31 mg/kg)>farmland (0.29 mg/kg)>grassland (0.20 mg/kg). There was no significant difference in soil available phosphorus content between forest and farmland (P>0.05), but the differences in available phosphorus content between the two and grassland were significant (P<0.05). Similarly, the contents of soil available potassium under different land covers ranked as forest (0.12 mg/kg)>farmland (0.10 mg/kg)>grassland (0.09 mg/kg), and the contents all decreased with the increase of soil depth. The content of available potassium in forest soil was significantly different from those of farmland and grassland (P<0.05), while the contents of available potassium in farmland and grassland soil were not significantly different (P>0.05).
Analysis of the effects of different land covers on soil organic carbon and nitrogen contents
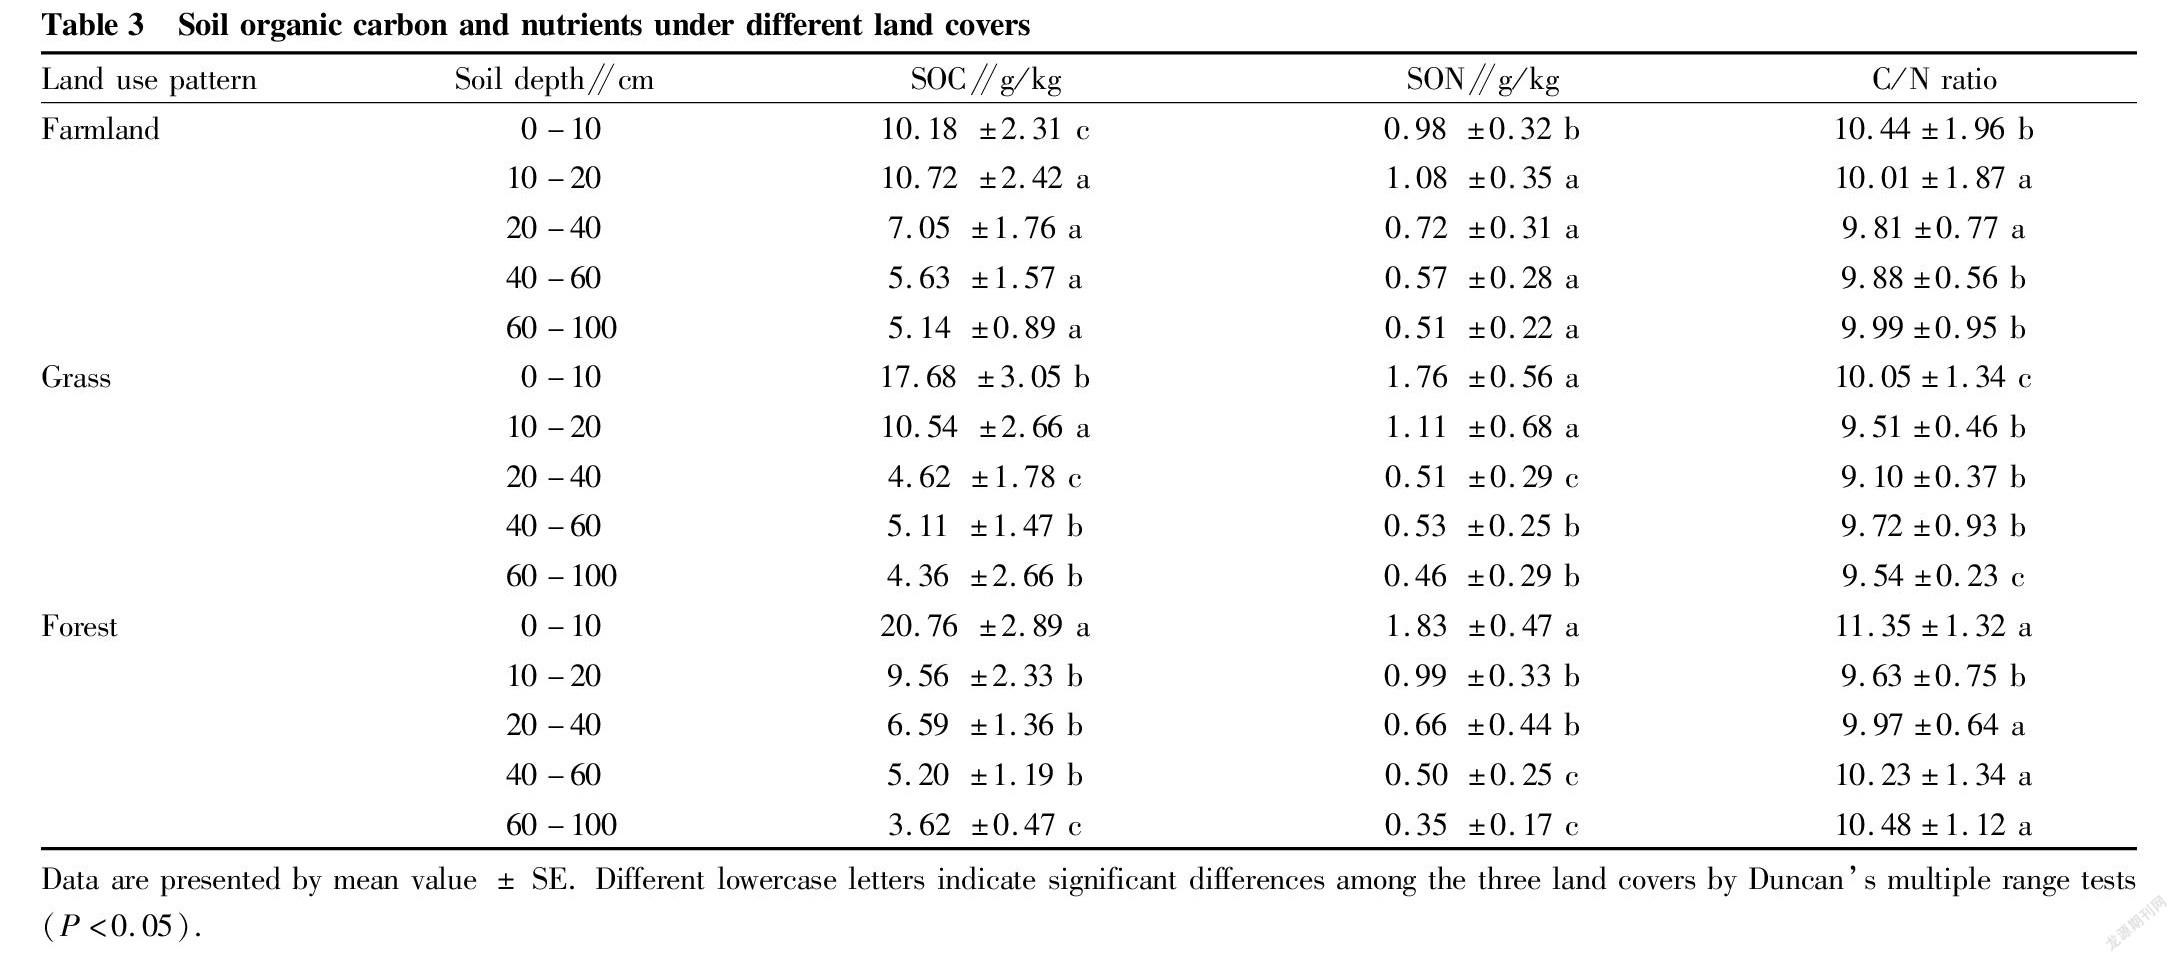
The characteristics of organic carbon and nitrogen contents of different land cover soils are shown in Table 3. It can be seen from Table 3 that the content of soil organic carbon (SOC) in farmland was the highest in the 10-20 cm soil layer, reaching 10.72 g/kg, while under the two land use modes of grassland and forest, the SOC content was the highest in the 0-10 cm soil layer, which was 17.68 and 20.76 g/kg, respectively. The SOC contents of the above three types of land cover were all the lowest in the soil bottom layer (60-100 cm), at 5.14, 4.36 and 3.62 g/kg, respectively, that is, the SOC contents showed a decreasing trend with the increase of soil depth. It could be seen that soil depth had a significant effect on SOC content, which is consistent with previous research results[20-22]. In addition, the average SOC contents of the three types of land cover ranked as forest (9.146 g/kg)> grassland (8.462 g/kg)>farmland (7.744 g/kg). The reason was that the SOC input to the soil after the decomposition of remaining branches and leaves was concentrated on the surface of the soil, and its surface aggregation was more obvious, indicating that the difference in vegetation type has a greater impact on the variation of SOC.
Compared with SOC, the soil organic nitrogen (SON) content under the three land use types of farmland, grassland and forest showed the same consistency as SOC, that is, with the increase of soil depth, the content of soil organic nitrogen (SON) showed a decreasing trend. Farmland had the highest SON content at 10-20 cm at 1.08 g/kg, while grassland and forest had the highest SON content at 0-10 cm at 1.76 and 1.83 g/kg, respectively. The average SON contents of farmland, grassland and forest were in order of grassland (0.87 g/kg)>forest (0.86 g/kg)>farmland (0.77 g/kg).
In addition, in the 0-10 cm soil layer, the SOC content of forest was 103.9% and 17.4% higher than those of farmland and grassland, respectively, while the SON content of forest was 87.6% and 4.1% higher than those of farmland and grassland, respectively. At a soil depth of 10-20 cm, the SOC content of farmland was 1.7% and 12.2% higher than those of grassland and forest, respectively, and the SON content of grassland was 3.5% and 11.8% higher than those of farmland and forest, respectively. At a soil depth of 20-40 cm, the SOC content of farmland was 52.7% and 7.0% higher than those of grassland and forest, respectively, and the SON content of farmland was 41.7% and 8.7% higher than those of grassland and forest, respectively. At a soil depth of 40-60 cm, the SOC content of farmland was 10.2% and 8.3% higher than those of grassland and forest, respectively, and the SON content of farmland was 8.4% and 13.4% higher than those of grassland and forest, respectively. At a soil depth of 60-100 cm, the SOC content of farmland was 17.8% and 41.8% higher than those of grassland and forest, respectively, and its SON content was 11.8% and 47.9% higher than those of grassland and forest, respectively.
CCA Analysis on soil organic carbon and nitrogen and physical and chemical properties of different land covers
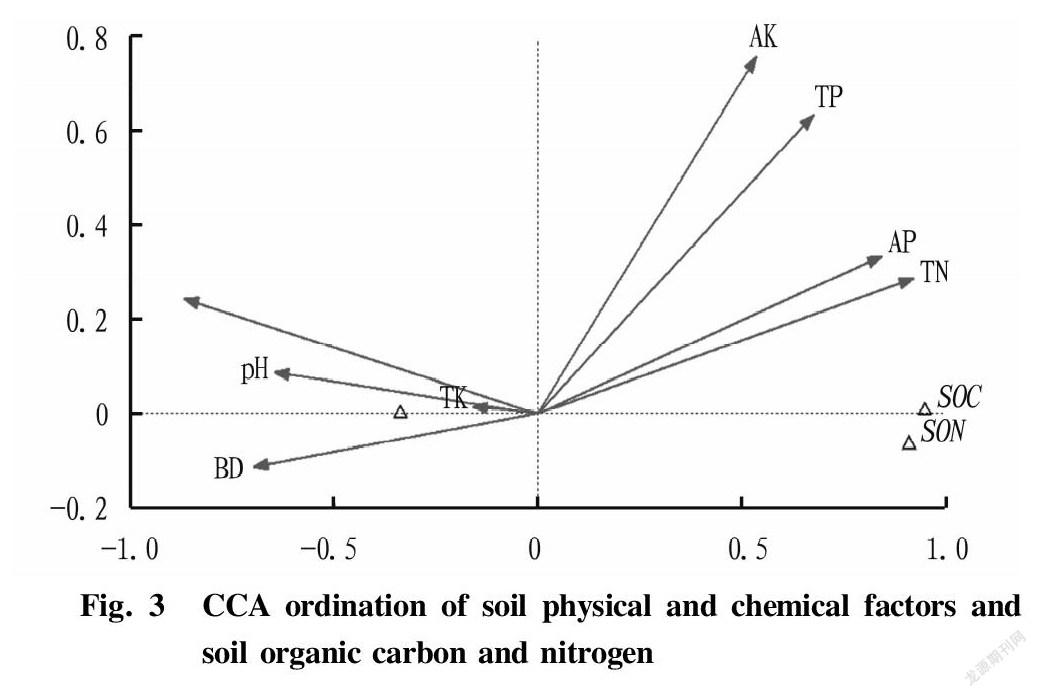
The soil physical and chemical factors and soil organic carbon and nitrogen of different soil levels in different land cover types were sorted into corresponding matrices and imported into the Canoco 4.5 software for processing. The Canonical Correspondence Analysis (CCA) was used for ranking analysis, and a two-dimensional ranking map of soil physical and chemical factors and soil organic carbon and nitrogen was obtained (Fig. 3). The arrows in the figure represent the soil factors, and their quadrants represent the positive or negative correlation between the soil factors and the ranking axes; and the lengths of the lines indicate the strength of the correlation between the soil physical and chemical factors and the soil organic carbon and nitrogen, and the slopes of the lines on the ranking axes indicate the correlation between the soil factors and the ranking axes.
According to the CCA analysis (Fig. 3), in terms of the strength of the correlation, soil total nitrogen, available phosphorus, total phosphorus, and available potassium all had an extremely significant positive correlation with the first axis of CCA (P<0.01), while soil total potassium and pH value were extremely negatively correlated with the first axis (P<0.001). Soil bulk density and the second ranking axis of CCA were extremely significantly negatively correlated (P<0.001). The soil physical and chemical factors with the highest correlation coefficients with the first axis were total nitrogen, available phosphorus, total phosphorus and available potassium.
Discussion
The results of Meta analysis based on global data found that after forests were converted to farmland, their carbon pools lost an average of 42%, while grazing grasslands were converted to farmland with an average loss of 59% of carbon pools[23]. Studies have shown that the degrees of influence of different land use methods on soil organic carbon storage vary greatly in various regions of the world, mainly due to differences in regional climate factors (such as temperature and precipitation) that can affect the rate of soil organic carbon turnover[24-25]. In addition, the length of time for farmland reclamation can also affect the degree of soil organic carbon reduction[26-27]. In this study, compared with natural vegetation, namely grassland and forest, farmland planting resulted in a significant decrease of SOC content by 8.5%-15.3%, and a significant decrease of SON content by 11.1%-11.7% (Table 3). The reason may be that in agricultural ecosystems, the amount of carbon sources (mainly from crop roots and residues) imported into the soil through net primary productivity is usually less than that of natural ecosystems (litter and underground carbon input)[28]. Moreover, the contents of lignin, tannic acid and other plant secondary compounds in the input carbon sources are often relatively lower than those of litter in the natural ecosystem[29-30], so they have a faster decomposition rate[31]. The results of this study are consistent with the above conclusions.
The results of this study showed that different land covers had a greater impact on the physical and chemical properties and nutrient contents of the soil. Under the three types of land cover of farmland, grassland and forest, their pH values all increased with the increase of soil depth, and ranked as grassland>farmland>forest, but the differences were not significant. When the temperature is high, soil moisture will evaporate. Therefore, the relationship between the two is that within a certain temperature range (above 0 ℃), as the soil temperature increases, the moisture content decreases. Soil humidity changes with the change of soil water content and is restricted by the various components of the water balance. The seasonal difference in soil N supply caused by temperature and humidity is an important basis for formulating fertilization systems. When the soil temperature is too low or the water content is too high, due to the extremely weak nitrification effect, crops’ N nutrient supply will be insufficient. At this time, more nitrogen fertilizer should be applied to the soil. The seasonal changes of soil P are more complicated. This study showed that soil temperature and humidity had no significant effects on the content of P element. The influence of temperature and humidity on K+ in the soil is multifaceted. The results of this study showed that low temperature could reduce the release rate of slowly-available K in the soil and increase the content of soil available potassium. The vertical variation of total potassium in the soil profile was more average and the lower layers were higher than the upper layers, which was related to the leaching nature of potassium in the state of free ions in the soil. The results of this study showed that the changes in soil organic carbon content and organic nitrogen content tended to be consistent.
As far as soil nutrients are concerned, the soil nutrients of forest land come from the accumulation, decomposition and mineralization of the surface litter layer. Litter, as an important link connecting soil and plants, participates in the species cycle and energy flow of the forest ecosystem, and is the main source of soil organic carbon. However, forests are less affected by human and livestock disturbance, and the vegetation and biomass of the forest land are relatively high, so the soil nutrient content of the forest land was the highest. On the contrary, grassland has very few litter layers on the ground. In addition, the study area of this study is a semi-agricultural and semi-pastoral area, and the grassland was not only disturbed by humans, but also often gnawed by livestock, resulting in relatively low nutrient cycle and metabolism, as well as relatively low soil nutrient contents. Farmland soil is different, long-term fertilization will significantly increase the soil nitrogen content. Different from other parts of China, Tibetan farmers and herdsmen are accustomed to deliberately leaving crop residues longer (about 20-30 cm) when harvesting crops, and then rushing livestock (such as cattle and pigs) to the field for grazing after the crops are harvested. Such activities will last for 2 months. Two months later, although a part of the stubbles and fallen leaves are eaten by the livestock, a part of them are left in the ground, and afterwards, they accumulate, and are decomposed and mineralized to form soil nutrients. Therefore, the soil nutrient contents of farmland were between those of forest and grassland. In addition, the content of soil organic carbon and nitrogen is not only affected by factors such as climate, vegetation coverage, and sedimentary environment, but also closely related to the physical and chemical properties of the soil. In this study, the soil organic carbon and organic nitrogen contents gradually decreased in different soil layers in different types of land cover. The reason was that most of the branches and leaves and roots of plants were distributed in the surface soil, and after decomposition, humus was formed and accumulated in the surface soil, so the soil organic carbon content gradually decreased from the surface layer downward. As the soil organic carbon content gradually decreased, the soil pH value gradually increased, and the soil solution gradually changed from acidic to alkaline. It was because that soil pH can affect the growth and activities of microorganisms. In acidic soils, the types of microorganisms are limited, mainly fungi, which slows down the decomposition of organic matter, and meanwhile, the decomposition of plant materials will slow down; and under alkaline conditions, the dissolution, dispersion and chemical hydrolysis of organic substances will increase, which improves the utilization rate of organic substances by microorganisms. In addition, soil organic carbon content and bulk density showed an extremely significant negative correlation (P<0.001). Compared with other provinces in China, this region has more extensive management of farmland for farmers and herdsmen, and the soil nutrient contents are relatively poor. It shows that in the semi-arid area of southeastern Tibet, the method of changing land use patterns can be adopted to improve soil properties, so as to promote the improvement of land quality.
Conclusions
① Under the three different types of land cover in the Niyang River Basin, in terms of pH value comparison, the values ranked as grassland (6.612)>farmland (6.524)>forest (6.264). Bulk density increased with the increase of soil depth, and ranked as grassland (0.840)>forest (0.680)> farmland (0.346).
② In terms of the average SOC contents of the three types of land cover of farmland, grassland and forest, forest had the highest SOC content at 9.15 g/kg, followed by grassland with a SOC content of 8.46 g/kg, and farmland had the lowest SOC content at 7.74 g/kg. The changes of SON showed the same consistency as those of SOC. In the semi-arid areas of Tibet, the method of changing land use patterns can be adopted to improve soil characteristics, so as to promote the improvement of land quality.
References
[1] MENG YY, ZHANG YQ, ZHOU JC, et al. Spatial distribution of soil nutrients in cinnamon soil arable layer in southwest of Yaodu District[J]. Journal of Gansu Agricultural University, 2018, 53(1): 102-109. (in Chinese).
[2] ZHAO ZZ, LI Y, ZHAO ZY, et al. Effects of land use patterns on soil organic carbon and easily oxidized organic carbon in the eastern part of Hainan Island[J]. Tropical Geography, 2019, 39(1): 144-152. (in Chinese).
[3] GONG YY, ZHU XP, LI DP, et al. Effect of land use type on the active organic carbon of wetland soil in an arid area[J]. Pratacultural Science, 2019, 36(8): 1944-1952. (in Chinese).
[4] SUN SS, DUAN JJ, WANG XL, et al. Composition characteristics of soil organic carbon under different land use types in small watershed of karst[J]. Journal of Mountain Agriculture and Biology, 2018, 37(3): 49-55. (in Chinese).
[5] ZHANG Y, GONG J, MA XC, et al. Research progress on the impact of land use on soil organic carbon based on the bibliometric method[J]. Chinese Journal of Soil Science, 2016, 47(2): 480-488. (in Chinese).
[6] DATTA A, BASAK N, CHAUDHARI SK, et al. Soil properties and organic carbon distribution under different land uses in reclaimed sodic soils of North-West India[J]. Geoderma Regional, 2015(4): 134-146.
[7] IQBAL J, HU R, DU L, et al. Differences in soil CO2 flux between different land use types in mid-subtropical China[J]. Soil Biology & Biochemistry, 2008.4 (9): 2324-2333
[8] PAUL EA. The nature and dynamics of soil organic matter: Plant inputs, microbial transformations, and organic matter stabilization[J]. Soil Biology and Biochemistry, 2016(98): 109-126.
[9] CELIK I. Land-use effects on organic matter and physical properties of soil in a southern Mediterranean highland of Turkey[J]. Soil and Tillage Research, 2005, 83(2): 270-277.
[10] WILSON BR, KOEN TB, BARNES P, et al. Soil carbon and related soil properties along a soil type and land-use intensity gradient, New South Wales, Australia[J]. Soil Use and Management, 2011, 27(4): 437-447.
[11] BISSETT A, RICHARDSON AE, BAKER G, et al. Long-term land use effects on soil microbial community structure and function[J]. Applied Soil Ecology, 2011(51): 66-78.
[12] RODRIGUES JLM, PELLIZAAI VH, MUELLER R, et al. Conversion of the Amazon rainforest to agriculture results in biotic homogenization of soil bacterial communities[J]. Proceedings of the National Academy of Science of the United States of America, 2013(3): 988-993.
[13] GR ZWEIG JM, SPARROW SD, CHAPIN III FS. Impact of forest conversion to agriculture on carbon and nitrogen mineralization in subarctic Alaska[J]. Biogeochemistry, 2003, 64(2): 271-296.
[14] LI KR, WANG SQ, CAO MK. China’s vegetation and soil carbon storage[J]. Science in China, 2003, 33(1): 72-80. (in Chinese)
[15] YANG Y, FANG J, TANG Y, et al. Storage, patterns and controls of soil organic carbon in the Tibetan grasslands[J]. Global Change Biology, 2008, 14(7): 1592-1599.
[16] LI N, WANG GX, GAO YH, et al. On soil organic carbon of alpine ecosystem in Qinghai-Tibet Plateau [J]. Soils, 2009, 41(4): 512-519. (in Chinese)
[17] ZHANG C, LIU B, ZHANG WX. Study on soil physical and chemical properties of wetlands in Linzhi Reaches of Niyang-Yaluzangbu River Valley in Tibet[J]. Journal of Anhui Agricultural Sciences, 2011, 39(31): 19119-19121. (in Chinese)
[18] LI W, CAO WX, SHI SL, et al. Changes in organic carbon and nitrogen storage in alpine meadows under different grazing management regimes[J]. Acta Prataculturae Sinica, 2016, 25(11): 25-33. (in Chinese)
[19] GARTER CT, POST WM, HANSON PJ, et al. Forest soil carbon inventories and aspen and spruce dominated studies of the boreal mixedwood forest[J]. Soil Science Society of America Journal, 2004, 68(5): 1735-1743.
[20] SUN WX, SHI XZ, YU DS, et al. Estimation of soil organic carbon density and storage of northeast China[J]. Acta Pedologica Sinica, 2004, 41(2): 298-300. (in Chinese).
[21] LI Z, SUN B, LIN XX. Density of soil organic carbon and the factors controlling its turnover in East China[J]. Scientia Geographica Sinica, 2001, 21(4): 301-307. (in Chinese).
[22] SUN B, ZHANG TL, ZHAO QG. Fertility evolution of red soil derived from quaternary red clay in low-hilly region in middle subtropics II. Evolution of soil chemical and biological fertilities[J]. Acta Pedologica Sinica, 1999, 36(2): 203-217. (in Chinese).
[23] GUO LB, GIFFORD RM. Soil carbon stocks and land use change: A meta analysis[J]. Global Change Biology, 2002, 8(4): 345-360.
[24] DAVIDSON EA, JANSSENS IA. Temperature sensitivity of soil carbon decomposition and feedbacks to climate change[J]. Nature, 2006, 440(7081): 165-173.
[25] ZHANG K, DANG H, ZANG Q, et al. Soil carbon dynamics following land-use change varied with temperature and precipitation gradients: Evidence from stable isotopes[J]. Global Change Biology, 2015, 21(7): 2762-2772.
[26] WEI X, SHAO M, GALE WJ, et al. Dynamics of aggregate-associated organic carbon following conversion of forest to cropland[J]. Soil Biology and Biochemistry, 2013, 57(3): 876-883.
[27] SCHWEIZER SA, FISCHER H, HRING V, et al. Soil structure breakdown following land use change from forest to maize in Northwest Vietnam[J]. Soil and Tillage Research, 2017(166): 10-17.
[28] PAUL EA. The nature and dynamics of soil organic matter: Plant inputs, microbial transformations, and organic matter stabilization[J]. Soil Biology and Biochemistry, 2016(98): 109-126.
[29] SOLOMON D, LEHMANN J, KINYANGI J, et al. Long-term impacts of anthropogenic perturbations on dynamics and speciation of organic carbon in tropical forest and subtropical grassland ecosystems[J]. Global Change Biology, 2007, 13(2): 511-530.
[30] SOLOMON D, LEHMANN J, ZECH W. Land use effects on soil organic matter properties of chromic Luvisols in semi-arid northern Tanzania: Carbon, nitrogen, lignin and carbohydrates[J]. Agriculture, Ecosystems and Environment, 2000, 78(3): 203-213.
[31] GR ZWEIG JM, SPARROW SD, CHAPIN III FS. Impact of forest conversion to agriculture on carbon and nitrogen mineralization in subarctic Alaska[J]. Biogeochemistry, 2003, 64(2): 271-296.
Editor: Yingzhi GUANG Proofreader: Xinxiu ZHU
- 农业生物技术(英文版)的其它文章
- Expression Analysis of Heat Shock Protein 70 Gene in Rice (Oryza sativa L.)
- Changes in Physiological and Biochemical Characteristics of Floral Organ
- Research Progress on Lonicera japonica Thunb. Affected by Environmental Stress
- Research Progress on Genetic Diversity of Snap Bean
- Allelopathic Effects of Cedrus deodara Needle Extracts on Seed
- Development Status and Countermeasures of Passiflora spp. Seedling Industry in Qinzhou, Guangxi

