
Characterization of refined fish oil from small fish in Mauritania
2022-03-01 03:32XuebingZhngLiuLinZhunxiChenJingZhngXichngWngNingpingTo
Aquaculture and Fisheries 2022年6期
Xuebing Zhng, Liu Lin, Zhunxi Chen, Jing Zhng, Xichng Wng,b,c,Ningping To,b,c,*
aCollege of Food Science and Technology, Shanghai Ocean University, Shanghai, 201306, China
bShanghai Engineering Research Center of Aquatic-Product Processing & Preservation, Shanghai, 201306, China
cNational R&D Branch Center for Freshwater Aquatic Products Processing Technology, Shanghai, 201306, China
Keywords:
ω-3 PUFAs
Crude fish oil
Fish oil refinement
Triglyceride molecular species
Mauritania Sea
Small pelagic fish
A B S T R A C T
In this study, the effects of chemical refining on the physicochemical indices, environmental pollutants, lipid functional groups, relaxation characteristics, fatty acid profiles, and triglyceride (TG) molecular species in crude oil extracted from small fish in Mauritania were evaluated.The acid, peroxide, and iodine values of crude oil were identified as 5.52 mg KOH/g, 1.73 meq/kg, and 200.78 g/100 g oil, respectively.After refining, these values were determined to be 0.29 mg KOH/g, 0.76 meq/kg, and 210.80 g/100 g oil, respectively.The polychlorinated biphenyls and arsenic content of crude oil were identified as 32.30 μg/kg and 1.00 mg/kg,respectively.After refining, these were not detected.The content of eicosapentaenoic acid (EPA) and docosahexaenoic acid (DHA) accounted for as much as 87.55% of the polyunsaturated fatty acids in the refined oil,indicating that high-quality fish oil is suitable as a food supplement.The correlation coefficient of the infrared spectra before and after refining was 0.968, and the relaxation time and peak shape data were almost similar before and after purification.Meanwhile, there were no significant differences (P ≥0.05) in fatty acid profiles between the crude and refined oils, except for C16:0 (P <0.01).Based on UPLC-Q E-MS/MS detection, 137 TG molecules were identified in both crude and refined oils.Among the detected TG molecular species, 64 contained EPA or DHA, which accounted for 46.83% and 46.00% of the total TG content in crude and refined oils,respectively.After refining, the content of the molecular species decreased by 31.95 mg/10 g, among which the three most variable molecular species were TG (16:0/18:1/22:6), (16:1/16:2/18:1), and (18:4/16:0/20:5), accounting for 29.26% of the decline of the molecular species.Overall, the refining process had little effect on the fatty acid profile and distribution of TG molecular species in fish oil.
1.Introduction
Fish oil is a major source of polyunsaturated fatty acids (PUFAs),especially ω-3 PUFAs, such as eicosapentaenoic acid (EPA) and docosahexaenoic acid (DHA), which have anti-inflammatory and tissueprotection effects owing to the potent metabolites of lipid mediators,such as eicosanoid (e.g., adiponectin), resolvins, and protectins (Calder,2015; Simopoulos, 2002).Epidemiological and experimental evidence has shown that ω-3 PUFA can boost brain and retinal development(Swanson, Block, & Mousa, 2012) as well as reduce risk factors leading to cardiovascular disease, cancer, etc.(Fuentes, Kim, Fan, & Chapkin,2018; Manson et al., 2019; Rimm et al., 2018).
Presently, both Western and Eastern diets are deficient in ω-3 PUFAs and contain excess ω-6 PUFAs (Simopoulos, 2004).ω-3 PUFAs are essential fatty acids (FAs) that cannot be synthesizedde novoor made in sufficient amounts in humans (Barceló-Coblijn & Murphy, 2009).Therefore, it is necessary to obtain the required ω-3 PUFAs through the daily diet to prevent chronic diseases.ω-3 PUFAs are present in high amounts in seafood, such as fish and fish oil supplements.However,crude fish oil is generally extracted from small miscellaneous fish and by-products of fish meal processing, including scales, viscera, and air bladders.Crude fish oil contains impurities and undesirable compounds,such as free FAs (FFAs), heavy metals, and cholesterol (Huang &Sathivel, 2010), and thus, do not fully meet the standards of edible fish oil.Marine fish can accumulate large quantities of pollutants, including persistent organic pollutants (POPs) and heavy metals, through food chain biomagnification.POPs tend to accumulate in the lipids of wild marine fish because of their lipophilic characteristics and are ultimately transferred to oil that is extracted from these fish (Martí, Ortiz, Gasser,Martí, & Díaz-Ferrero, 2010).These POPs may cause different adverse health effects in humans and animals, such as disruption of the reproductive and endocrine systems as well as neurobehavioral and developmental disturbances (Mozaffarian & Rimm, 2006).A refining process is necessary to produce fish oil for human consumption as it can largely reduce the concentrations of environmental pollutants in the final fish oil products (Berntssen et al., 2010).Typically, crude fish oil must undergo refining steps prior to being considered safe for consumption or use as food supplements.This process generally includes four steps,namely, degumming, deacidification, decolorization, and deodorization(Kajal and Deepu, 2015).
The Mauritania Sea is located at the confluence of the Canary Current and the Gulf of Guinea, with strong upwelling and abundant fishery resources.It is one of the most important fishing grounds in Northwest Africa.Mauritania is rich in small pelagic fish, especially sardines, sardinella, horse mackerel, and chub mackerel (FAO, 2012).However, individuals below the minimum landing size, juvenile species, and by-catches (non-target species of low commercial value) are always discarded directly (Hofstede & Dickey-Collas, 2006; Zeller, Cashion,Palomares, & Pauly, 2017), which causes resource waste and environmental pollution.Kajal and Deepu (2015) found that sardine by-products are a good alternative source of PUFAs, and the utilization of by-products contributes to waste management and sustainable fisheries.Fish by-catches and by-products have become an important source of fish oil (García, Pérez, Morales, & Guadix, 2013).
In fish oils, ω-3 PUFAs mainly exist in the form of triglycerides (TGs),which are comprise glycerol and three FAs.Owing to the complexity of the types of FAs attached at these three sites, TGs have a complex structure of molecular species.In addition, the composition and positional distribution of FAs (especially ω-3 PUFAs) can greatly influence the digestion, absorption, and oxidative stability of TGs (Dyerberg,Madsen, Møller, Aardestrup, & Schmidt, 2010; Schuchardt & Hahn,2013).Therefore, studying the TG molecular species of oils and fats is of great significance for further understanding its nutritional value and physiological functions.Many comparative studies have been conducted to study the TG molecular species in different oils, and HPLC combined with mass spectrometry (MS) has been proven as an effective method.Weng, Zhao, and Zhang (2017) used ultra-high-performance liquid chromatography (UPLC) and Q Exactive high-resolution MS for the rapid and accurate identification of 28 TGs in the oil extracted from large yellow croaker, and reported that the dominant TG was(C16:1/C18:1/C18:2), accounting for 35.26% of the total TGs.Zhang et al., 2018a analyzed the TG molecular species of the oils obtained from anchovy, salmon, and tuna, and identified 30-40 TG molecules.The dominant TGs were (20:5/18:1/18:0), (16:0/16:0/18:0), and(20:5/16:0/18:0) in the oils extracted from anchovy, salmon, and tuna,respectively.TGs (18:1/18:1/16:0), (22:6/18:1/18:0), and(22:6/16:1/16:1) were the characteristic molecules in anchovy, salmon,and tuna, respectively, which distinguished the three marine fish species.However, there are some concerns regarding the changes in TG molecular species during the refining of fish oils, which may cause changes in FA profiles and the TG composition.Therefore, to determine the impact of refining on crude oil, UPLC-Q E-MS/MS was used to investigate the molecular types and content changes of fish oil before and after refining.Additionally, the physicochemical indices, lipid functional groups, relaxation characteristics, and FA profiles were determined.This study will help understand the effects of refining on the content of fish oil and lipids, thus, providing a theoretical basis for fish oil refining.
2.Materials and methods
2.1.Materials
Small fish and by-products caught in the fishing area of Mauritania were transported to a fish processing factory at the nearest shore.The main fish species includedMiichthys miiuy, sardine, andMerluccius.Crude fish oil was extracted by cooking (80-90 ℃ for 30 min), pressing,and centrifugation in a fish-oil processing plant equipped with a cooking chamber and centrifuge (Tao, Zhou, & Wang, 2011).The refinement process of crude fish oil was optimized in our previous study (Chen &Tao, 2018).The optimum refining process conditions were as follows:degumming by adding 80% phosphoric acid accounting for 1% of fish oil, deacidification with 4 mol/L NaOH (theoretical alkali and excess alkali, which accounts for 1.5% of fish oil), washing with hot water at 90 ℃, and bleaching by adding activated clay accounting for 20% of fish oil.
2.2.Determination of physicochemical indices
The crude and refined oils were characterized based on their acid value (AV), iodine value (IV), and peroxide value (PV) using the method of the American Oil Chemists’ Society (AOCS, 1994).
2.3.Measurements of environmental pollutants
The residual polychlorinated biphenyls (PCBs) were measured following the methods reported by Wu et al.(2014).The determination of organochlorine pesticide residues and heavy metals followed the methods of Fei (2016).
2.4.Fourier-transform infrared (FTIR) spectrometry
The spectra were collected using 32 scans in the range of 4000-525 cm-1with a resolution of 4 cm-1.The infrared spectrum was processed using seven-point Savitsky-Golay smoothing and a second derivative.
2.5.Detection method of low-field nuclear magnetic resonance (LF-NMR)
The method reported by Mao, Wang, and Shi (2017) was used with some modifications.The NMR tube was∮70 mm.The conditions for 1H NMR were as follows: magnet intensity 0.49 T and a resonance frequency of 21.17 MHz at a constant temperature of 32 ℃ for 10 min,sampled in a nuclear magnetic probe for 1 min.A CPMG pulse sequence in LF-NMR was selected, which determined the transverse relaxation time (T2) of the sample.Parameter settings: repeated sampling waiting time (TR) =2000 ms, half echo time (τ) =200 μs, echo count =5000,repeated scanning times (NS) =4, sampling points (TD) =500,050, and spectrum width (SW) =250 kHz.
2.6.FA composition analysis
The determination of FA composition in the crude and refined oils was achieved using gas chromatography (GC), using the method reported by Zhang et al., 2018.Methyl esterification was performed using the boron trifluoride-methanol method.The fish oil (0.08-0.10 g) was added to a round bottom flask, mixed with sodium hydroxide-methanol solution and nonadecanoic acid stock solution (internal standard),connected to a condensing device, and shaken at 100 ℃ for 10 min.Next, boron trifluoride-methanol solution was added and shaken at 100 ℃ for 5 min, followed by the addition ofn-hexane and further shaking at 100 ℃ for 2 min.After cooling, saturated NaCl solution was added and then-hexane layer was purified using a 0.22-μm organic filter.When completed, it was stored in a sample bottle.
The FA composition were analyzed by a gas chromatograph (Thermo Fisher Inc., Waltham, MA, USA) equipped with an Agilent SP-2560 capillary column (100 m × 0.25 μm × 0.2 μm) and a flame ionization detector (Thermo Fisher Inc., Waltham, MA, USA).The temperature program used was as follows: start at 70 ℃, increase to 140 ℃ at 20 ℃/min, increase to 180 ℃ at 4 ℃/min, hold for 1 min; increase to 225 ℃ at 3 ℃/min and hold for 30 min.The inlet temperature was 260 ℃,injection volume was 1 μL, split ratio was 45:1, column flow was 1 mL/min, and nitrogen was used as a carrier gas.
2.7.Determination of TG molecular species
The determination of TG molecular species was achieved using Q Exactive Orbitrap MS (Thermo, Waltham, MA.USA) coupled with a UPLC system (Dionex), based on the method reported by Tang et al.(2016).
2.8.Data analysis
Lipids were assigned and quantified using Lipid Search software v4.1.16 (Thermo).The data were processed using Excel software and are expressed as mean ± standard deviation (mean ± S.D.,n=3).The data were compared using one-way analysis of variance using the Statistical Package for the Social Sciences 16.0 software (SPSS Institute, Inc.,Chicago, IL, USA).P <0.05 was considered to indicate significant differences between the data, andP <0.01 was considered to indicate very significant differences between the data.
3.Results and discussion
3.1.Physicochemical characterization of the crude and refined oil
The indices of AV, PV, and IV of the crude and refined oils are shown in Table 1.AV is usually related to the content of FFAs, and PV is widely used as an indicator for measuring oxidative degradation in oils.The AV and PV of crude oil met the first grade standard of the aquatic industry standard for crude fish oil in China (SC/T 3502-2016, 2016), and the IV was as high as 200.78 ±24.98 g/100 g oil, indicating a high degree of unsaturation in the crude oil.Because of the removal of impurities during the refining process, the IV of the refined oil slightly increased to 210.80 ±8.52 g/100 g, which was higher than that of shad oil and horse mackerel oil (Boran, Karaçam, & Boran, 2006).Degumming is an acid-mediated partial refining process to remove phosphatides and other mucilaginous materials from crude oil.An increase in FFAs in the oils was observed oil after degumming, which may be due to the trace amount of acids added.In the deacidification stage, neutralization of FFAs with sodium hydroxide very significantly (P <0.01) decreased the AV from 5.52 ± 0.12 to 0.29 ± 0.11 mg KOH/g.

Table 1Physicochemical characterization of the crude and refined fish oils.
After refining, the PV of fish oil was significantly (P <0.01)decreased to 0.76 ±0.25 meq/kg.The PV of refined oil was lower than those of sardine and sardine by-products (Soldo et al., 2019).Activated clays can adsorb oxidation products and effectively remove primary oxidation products during the bleaching process.In addition, activated clays can adsorb pigments, trace metals, and remnant phospholipids and soaps, which improves the oxidation parameters and sensory quality of the oil to a great extent (García-Moreno, Guadix, Gómez-Robledo,Melgosa, & Guadix, 2013; Proctor & Toro-Vazquez, 1996; Sathivel &Prinyawiwatkul, 2004).After refining, the oil met the first-grade standard of the Aquatic industry standard for refined fish oil and the standard for fish oils of the Codex Alimentarius Committee (CXS 329-2017,2017), which is used in food and food supplements.
3.2.Residues of environmental pollutants in the crude and refined oils
Quality differences between crude and refined oils arise not only from peroxidation and the biochemical composition, but also due to the levels of pollutants.The changes in pollutant residues in the crude and refined oils are shown in Table 2.The PCBs and arsenic of crude oil were determined to be 32.30 μg/kg and 1.00 mg/kg, respectively, and were not detected in refined oil.No DDT, HCH, hexachlorobenzene (HCB), Pb,Hg, Cd or Cr were detected in the fish oil.The sodium soap produced during the deacidification process was a surface-active substance with strong adsorption capacity.Some impurities, such as proteins, pigments,and heavy metals, can be eliminated by the formation of the sodium soap (Fei, 2016).The reduction of heavy metals and PCBs in the decolorization stage is also related to the extent of adsorption of the decolorizer (activated clay) (García-Moreno, Guadix, Gómez-Robledo,Melgosa, & Guadix, 2013; Zhang, Wang, Jiang, & Liang, 2012).Sun et al.(2018) found that the concentrations of dioxins, PCBs, As, and Pb in the refined oils were 20%, 70%, 6%, and ≤1% of their corresponding values in crude oils, respectively.These findings indicate that the refining process can effectively reduce pollutant concentrations.

Table 2The concentrations of environmental pollutants in the crude and refined fish oils.
3.3.FTIR spectrometry
Visual inspection of the infrared spectra showed no obvious differences between the spectral characteristics of the crude and refined oils,except for minor changes in absorbance and band position (Fig.1).Information regarding the types and ratios of lipid functional groups in crude and refined oils was obtained from the FTIR spectra.The spectra of the lipids in crude and refined oils were similar to those of other oils as they were primarily composed of TGs (Guillén et al., 2004).The main characteristic absorption peaks and their corresponding functional groups in the FTIR spectra of both crude and refined oils are shown in Table 3.The band around 3011 cm-1was associated with the stretching vibration of the =CH- group of the cis olefin.The position and intensity of the peaks were related to the degree of unsaturation and PUFA species(Aarthy, Saravanan, Ayyadurai, Gowthaman, & Kamini, 2016; Guillén,Ruiz, Cabo, Chirinos, & Pascual, 2003).Furthermore, Yoshida and Yoshida (2003) suggest that the spectral data obtained because of =CH-cis group stretching and -CH2- group symmetrical stretching could be useful in determining the unsaturation levels of the oil.The bands near 1144 cm-1are correlated with the C-O ester group stretching vibration and -CH2-group bending vibration as well as to the proportion of saturated acyl groups in the oil samples.Therefore, the position andmagnitude of the band is affected when the ratio of FAs changes.The correlation coefficient between the crude and refined oils was 0.968,indicating that the lipid functional groups of the crude and refined oils were not significantly different from each other.
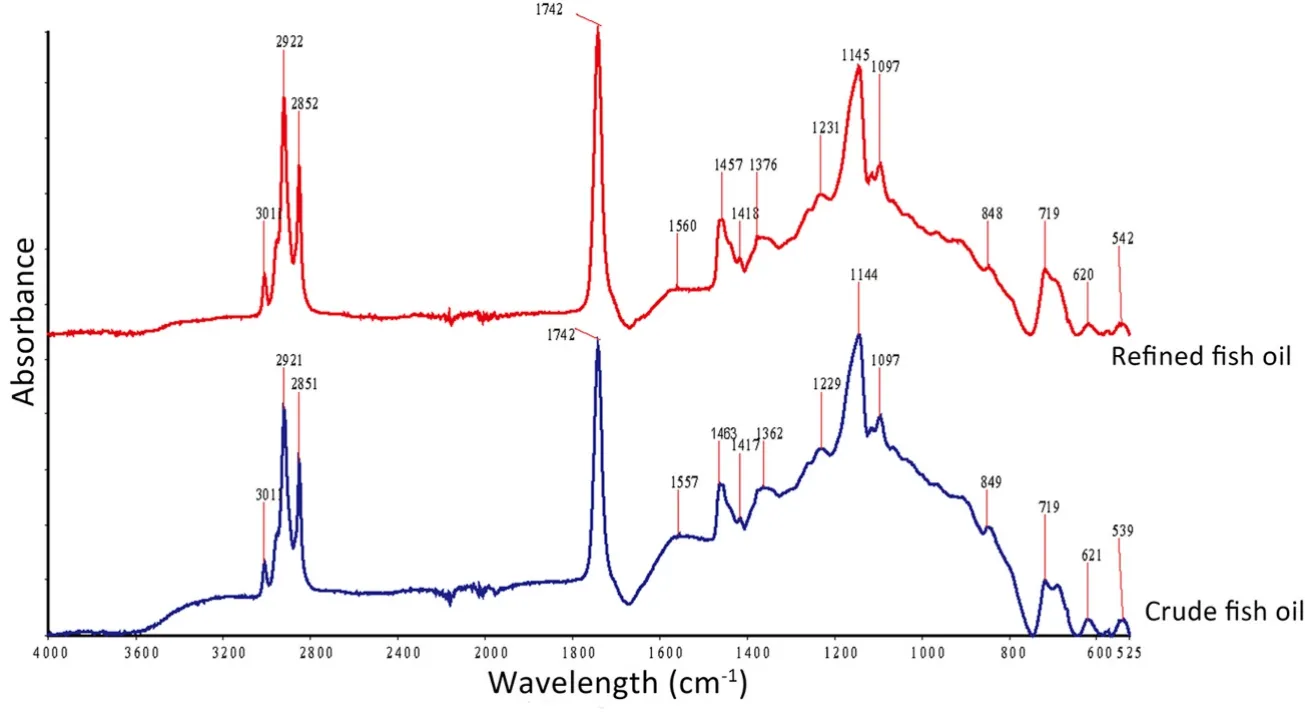
Fig.1.FTIR spectra of crude and refined fish oil in the range of 4000-525 cm-1.
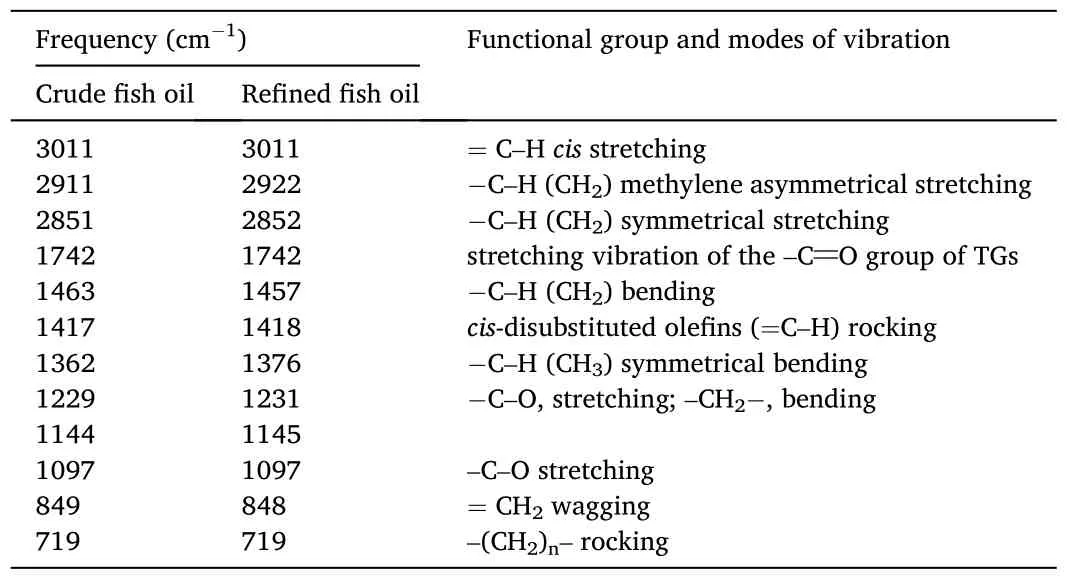
Table 3Characteristic absorption peaks in the FTIR spectra of crude and refined fish oils in the range of 4000-525 cm-1.
3.4.The relaxation characteristics of LF-NMR
The transverse relaxation spectra of crude and refined oils obtained using NMR are shown in Fig.2.The number and shape of the crude and refined oil peaks are similar, and the relaxation times of the five peaks were almost the same, namely T21: 0.5-7, T22: 7-40, T23: 60-980, T24:980-7000, T25: 7000-10,000 ms, and the corresponding peak areas were S21, S22…, S25, etc.Studies have shown that the relaxation time of the characteristic peaks and the ratio of peak area are related to the quality of fish oil (Sun, Zhang, & Fan, 2019; Zhao, Wang, Lu, & Liu,2014).S21and S22of the refined oil decreased to a certain degree compared to that of the crude oil.Sun et al.(2019) found that S21(0-10 ms) is positively correlated with the content of polar compounds.This might be related to the removal of some highly polar substances, such as phospholipids and glycolipids, from the crude oil.The content of saturated FAs (SFAs) decreased after refining, which is consistent with the trend of S22.The peak area of S23was maximized, which might be related to the abundance of hydrogen protons in the FAs.The double bond break of PUFAs introduced hydrogen ions, which might account for an increase in S23.Both S24and S25increased to a certain degree, but there was no significant difference compared to that of the crude oil.This may be because of the increase in FFA levels.The specific influencing factors should be investigated further.
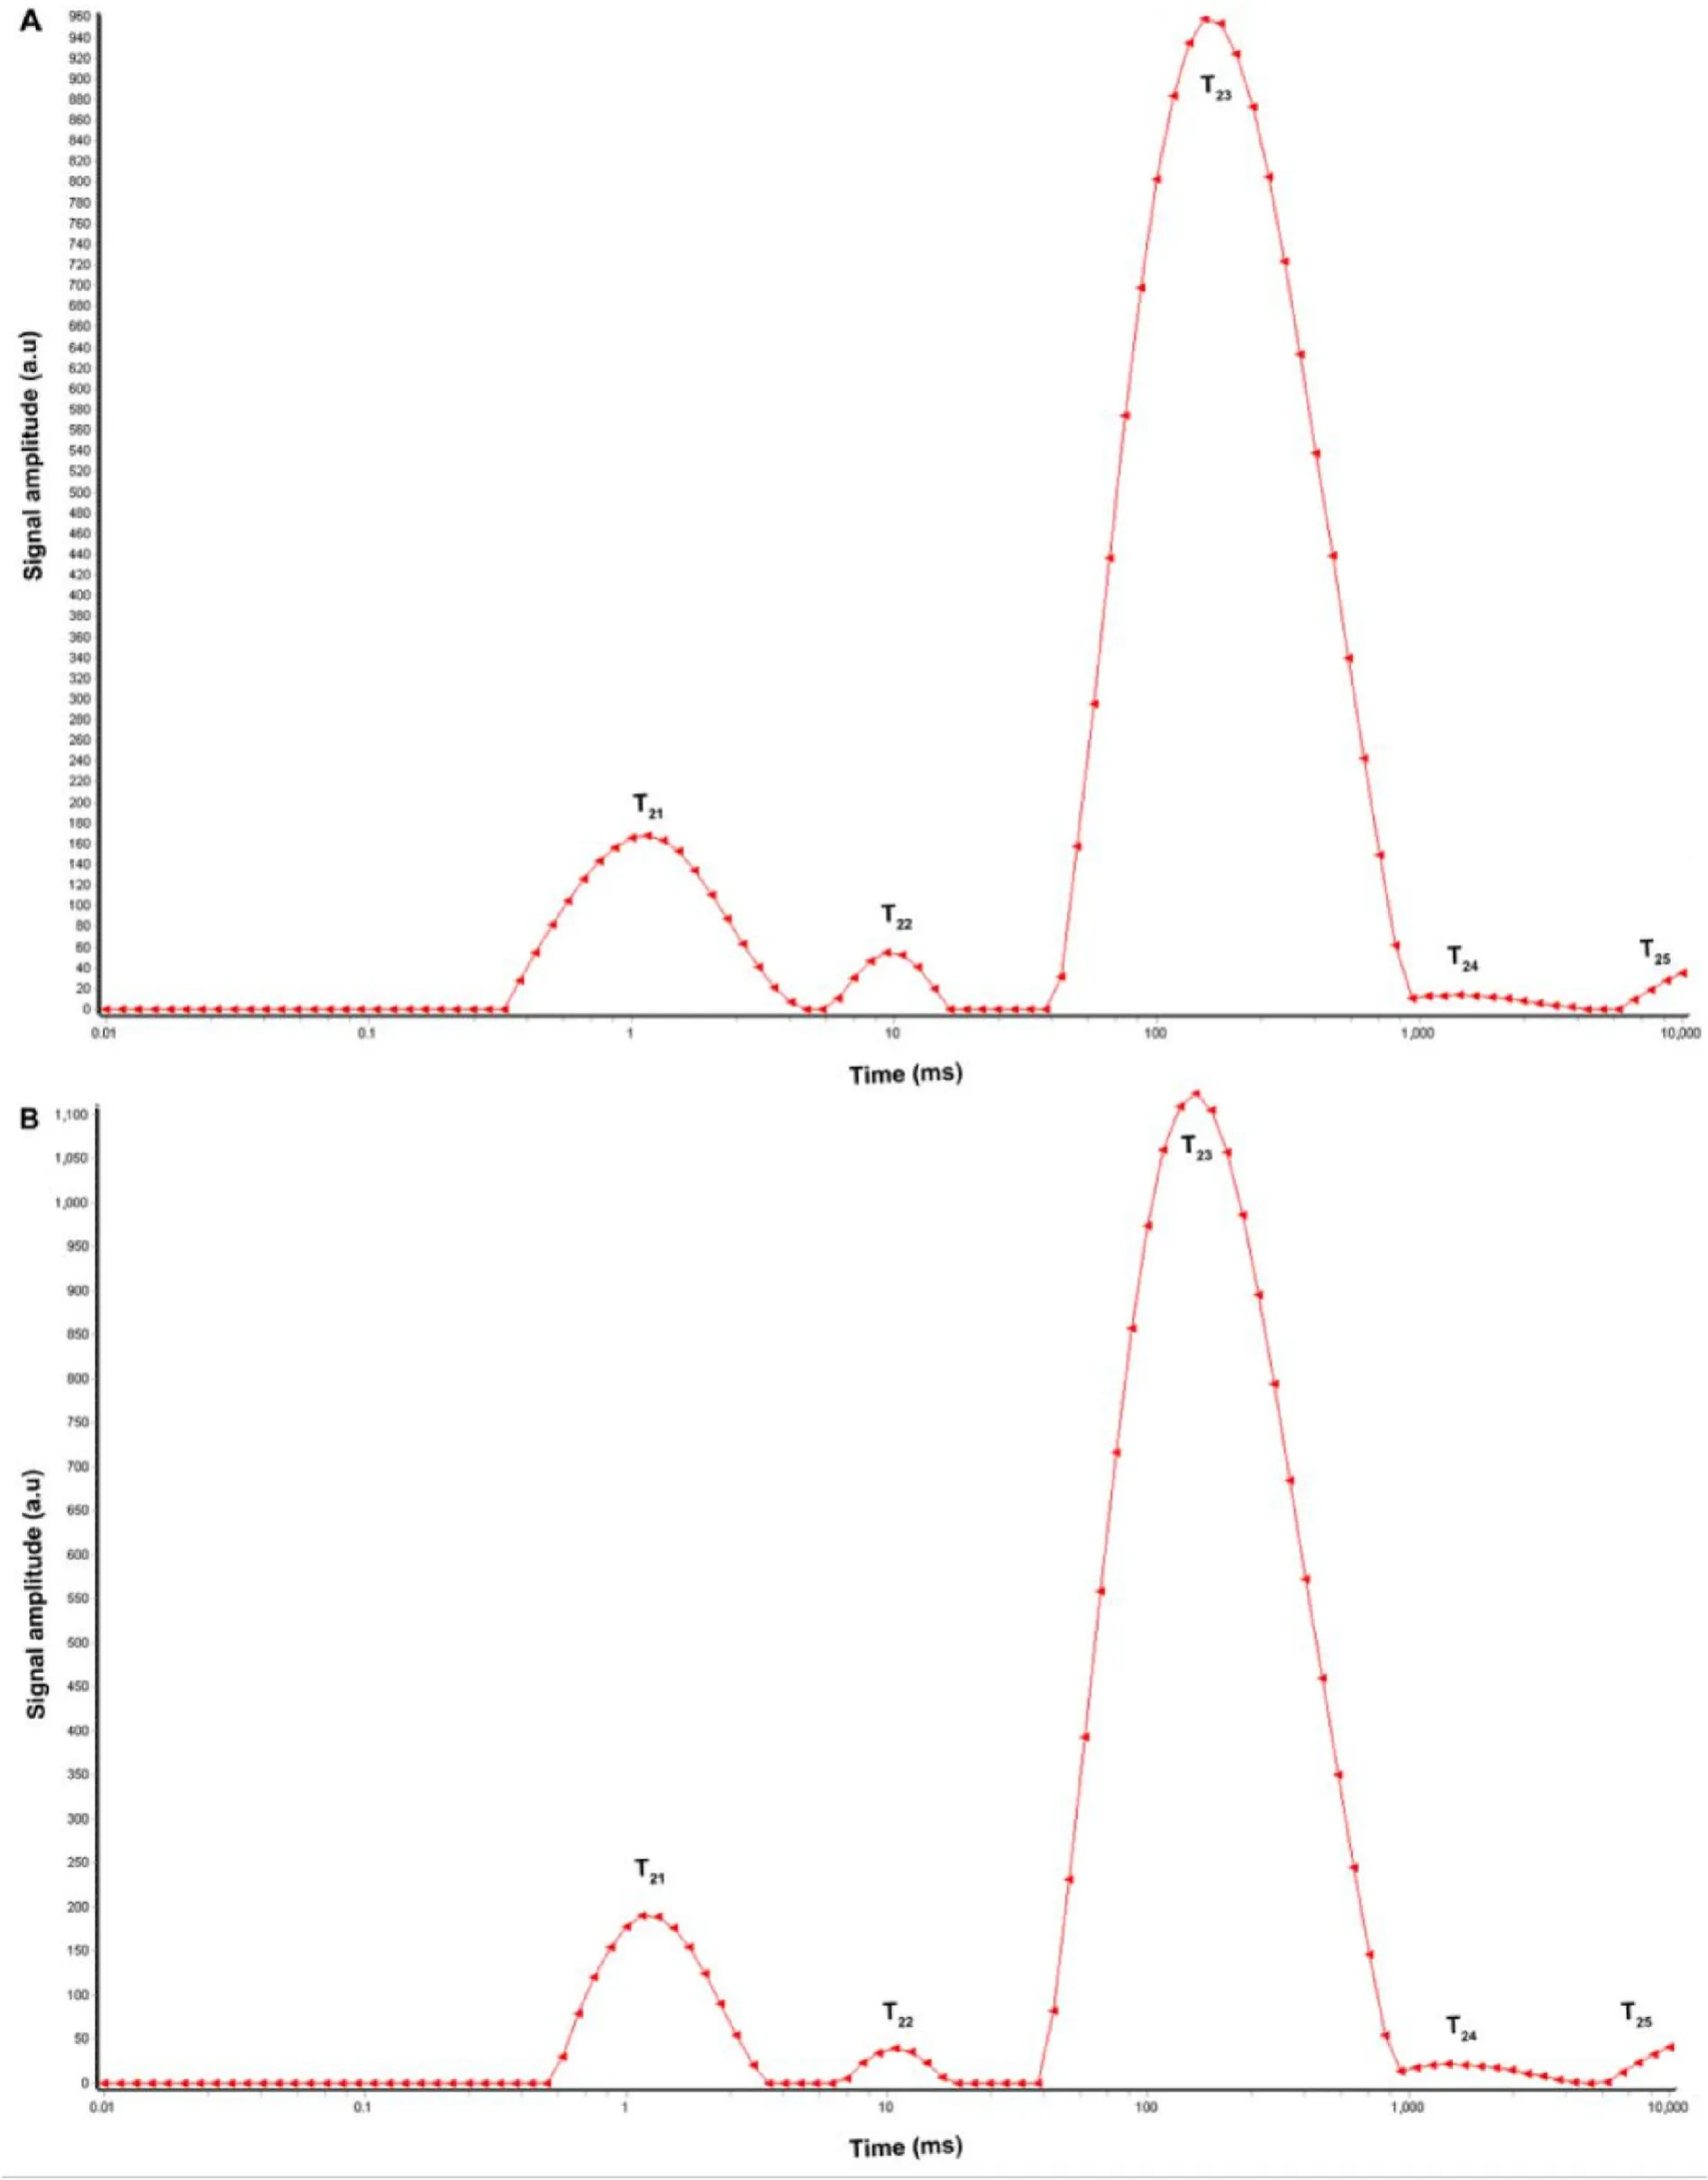
Fig.2.LF-NMR relaxation map of crude (A) and refined fish oil (B).
3.5.FA profile of fish oil
The FA composition results for crude and refined oils are shown in Table 4.The total lipid content decreased in refined oil, which may be attributed to the removal of other lipid compounds, such as phospholipids and waxes.In this study, 22 FAs were identified, including eight SFAs, six MUFAs, and eight PUFAs in crude and refined oils.Meanwhile,there were no significant differences (P≥0.05) in the contents of SFAs,MUFAs, and PUFAs between the crude and refined oils, except for C16:0(P <0.01).The content of palmitic acid (C16:0) in crude and refined oils was the highest, accounting for 59.58% and 56.56% of the total SFA content, respectively.Oleic acid (C18:1) accounted for 54.32% and 52.87% of the MUFAs in crude and refined oils, respectively.EPA accounted for 35.67% and 35.99% of crude and refined oils, respectively.DHA accounted for 51.60% and 51.56% in crude and refined oils,respectively.∑ω-6/∑ω-3 PUFA ≤2:1 should be the target for human nutrition (Simopoulos, 2004).In this study, the∑ω-6/∑ω-3 PUFA ratios of crude and refined oils were 0.07 and 0.06, respectively, which were better than those of sardine oil (Soldo et al., 2019).A decrease in the human dietary∑ω-6/∑ω-3 PUFA ratio observed for refined oil was able to prevent coronary heart disease and reduce cancer risk (Simopoulos, 2004, 2010).
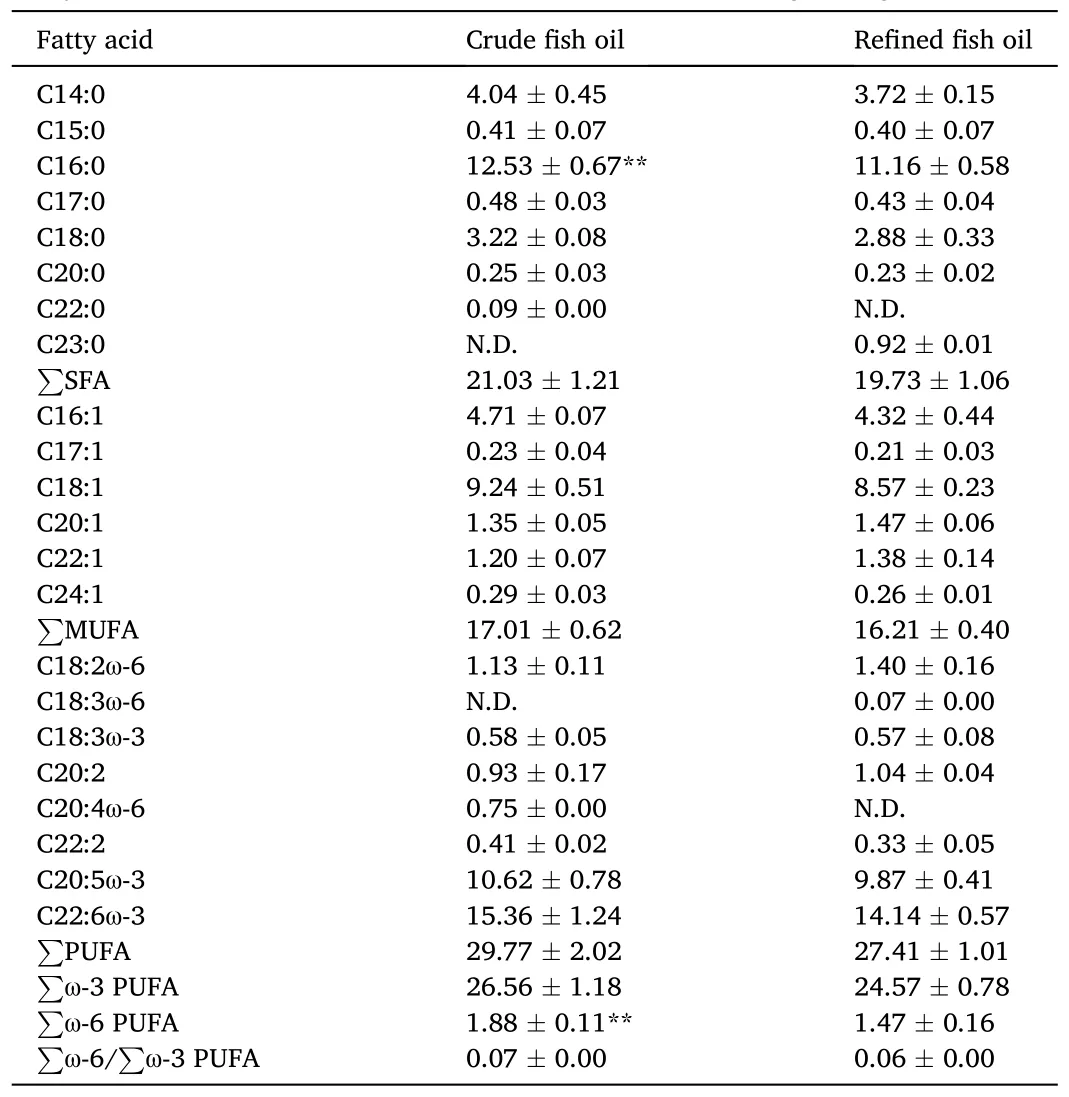
Table 4Fatty acids composition of the crude and refined fish oils (g/100 g).
3.6.Characterization of TG molecular species in crude and refined oils
In this study, UPLC-Q E-MS/MS was used to analyze the TG molecular species of crude and refined oils.The total ion chromatograms of crude and refined oils are shown in Fig.1S (positive modes).Identi fication of the FAs in TG molecules was achieved by observing the characteristic fragment ions in the mass spectrum, and obtained using the positive mode.The structure of the unknown TG could be characterized based on the MS and MS/MS data.The TG molecules of fish oil can be identified using the MS data, and the [M +NH4]+precursor ion in MS/MS data can be used to identify the acyl group.For instance, based on the measured precursor ion, m/z 922.79 ([M +NH4]+), of the unknown molecule, product ions with m/z 577, 632, and 649 were present in the MS/MS spectrum.LipidSearch software v4.1.16 was used to match the fragments with the database and identified them as [DG (16:0/18:1)+NH4]+, [DG (16:0/22:6)+NH4]+, and [DG (18:1/22:6)+NH4]+,respectively.Hence, 16:0, 18:1, and 22:6 were identified as the three FA chains of this TG molecule.However, we cannot confirm the location distribution of these three FAs in TG.In commercial fish oils, most of the FAs were distributed uniformly on the glycerol backbone, while DHA was distributed prior to the Sn-2 position of the TG molecule (Jaroslav,Weijie, & Colin, 2010).Therefore, it could be speculated that 22:6 was located at Sn-2, whereas 16:0 and 18:1 were located at Sn-1 and -3,respectively.
Using UPLC-Q E-MS/MS, 137 TG molecules were identified in the crude and refined oils, ranging from m/z 740.68 to 1060.93.A complete list of TG molecule species that were detected, as well as the absolute quantification data are provided in Table 1S.In this study, the fish oil contained abundant TG molecule species at much higher levels than those present in shark liver, tuna, and salmon oils (Jayasinghe, Gotoh, &Wada, 2012).In crude and refined oils, the predominant TG molecular species were TG (16:0/18:1/18:1; 6.59%, 7.12%), (16:0/16:1/18:1;5.41%, 5.90%), (16:0/16:0/18:1; 4.67%, 4.97%), (18:1/18:2/20:5;4.07%, 4.42%), (16:0/14:0/22:6; 3.89%, 4.19%), (16:0/16:0/16:1;3.46%, 3.77%), and TG (18:0/18:1/22:6; 3.37%, 3.57%), and there was no significant difference (P≥0.05) between the crude and refined oils.There were 64 TG molecules containing EPA or DHA, accounting for 46.83% and 46.00% of the total TG molecules in crude and refined oils,respectively.These findings also indicated that fish oils have a high degree of unsaturation.
Among the detected TG molecular species, 21 TG molecules showed significant differences between the crude and refined oils (Table 5).After refining, the molecular species content decreased by 31.95 mg/10 g, and the three molecular species that changed most were TG (16:0/18:1/22:6), (16:1/16:2/18:1), and (18:4/16:0/20:5), which decreased by 5.9120, 4.7030, and 4.6463 mg/10 g, respectively.The contents of these three molecular species decreased by 29.26% in total.The TG molecular species decreased in all molecular types, with the number of double bonds exceeding four, indicating that unsaturated FAs were more susceptible to the refining process.After refining, a decrease in the TG content might be related to the heating step in the refining process.Shi et al.(2019) found that thermal processing reduced the amounts of TG and increased the amounts of other lipid species, such as diglyceride and lysophosphatidylserine, in raw tilapia fillets.Therefore, it is necessary to control the temperature of the refining process.

Table 5The TG molecular species with significant differences between crude and refined fish oils.
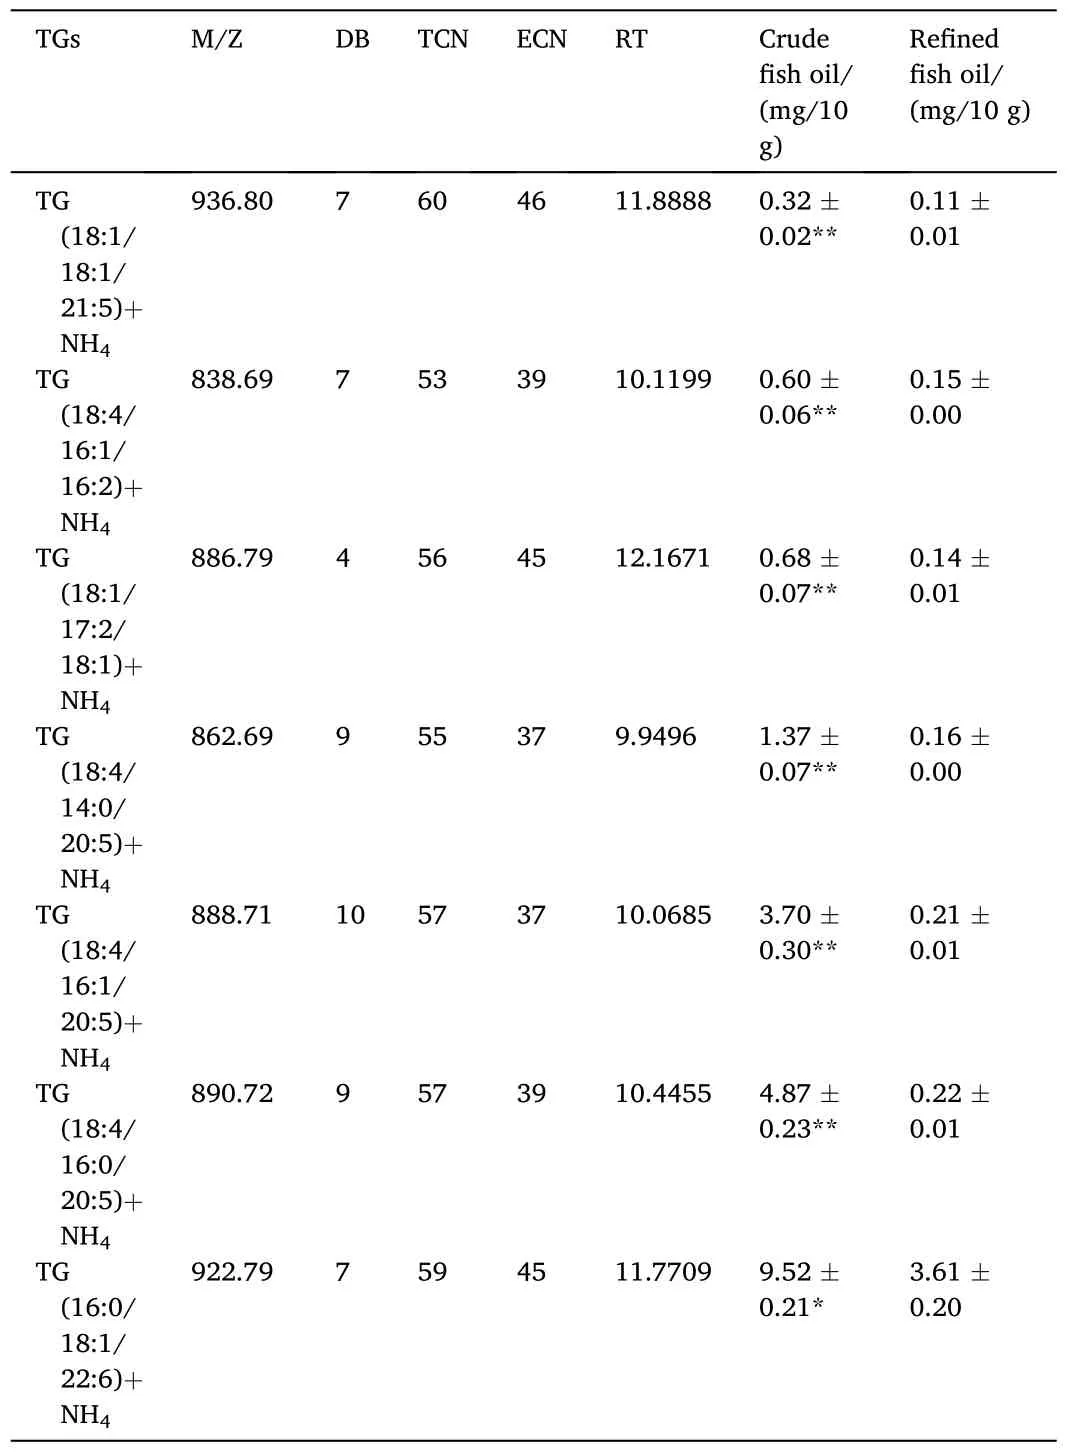
Table 5 (continued)
3.7.Distribution of TG molecular species based on total carbon number(TCN) and equivalent carbon number (ECN)
The distribution of TG molecules varied greatly in the oil obtained from marine fish.The distributions of the TG molecular species are shown in Fig.3.Fig.3A and B shows the TG molecular species classified based on TCN and ECN, respectively, and indicate that the TG molecular species are concentrated in TCN47-TCN69 and ECN33-ECN61.
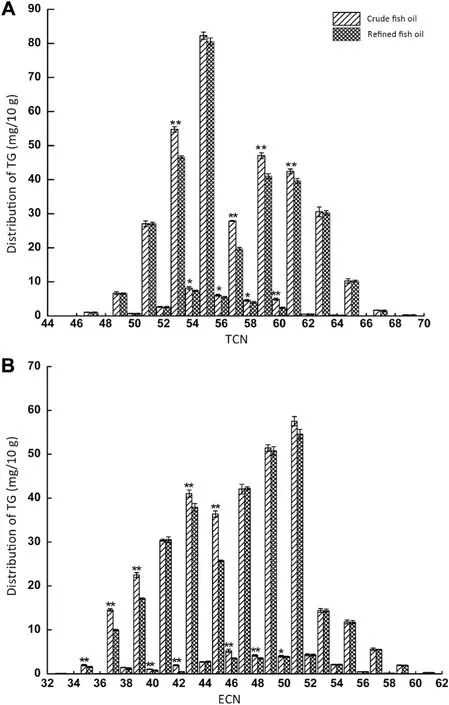
Fig.3.Distributions of TG according to total carbon number (TCN) (A) and equivalent carbon number (ECN) (B).* indicates significant difference (P <0.05), ** indicates very significant difference (P < 0.01), no letters indicates no significant difference (P ≥0.05).
The data management method of TG molecule species was based on TCN and ECN to identify the main characteristics of oils from various resources, as well as the similarities and differences among the samples.In the crude and refined oils, the TCN in the TG molecular species was mainly distributed in TCN53, TCN55, TCN59, and TCN61, accounting for 53.38% and 56.58% of the total TGs, respectively.The ECN species were mainly distributed in ECN43, ECN47, ECN49, and ECN51, accounting for 62.95% and 63.38% of the total TGs in the crude and refined oils, respectively.Although there was a significant difference between the crude and refined oils mainly concentrated in TCN53-61, a similar distribution trend of TCN and ECN indicated that refining did not change the distribution of the TG molecular species.The content of the TG molecular species (ECN ≤45) decreased in the refined oil, while that of the TG molecular species (ECN>45) in the crude oil increased.This might be related to the degradation of PUFAs and the breaking of double bonds during the refining process.
4.Conclusion
After refining, the AV and PV of fish oil significantly (P <0.01)decreased to 0.29 ± 0.11 mg KOH/g and 0.76 ± 0.25 meq/kg, respectively, and the IV increased to 210.80 ±8.52 g/100 g oil.The refining process effectively reduced pollutant-residue levels.There were no significant differences (P≥0.05) in the FA profiles between the crude and refined oils, except for C16:0 (P <0.01).The content of EPA and DHA accounted for as much as 87.55% of PUFAs in the refined oil, and the∑ω-6/∑ω-3 PUFA ratio was only 0.06.There were 137 TG molecular species detected in the crude and refined oils, and 21 TG molecular species showed significant differences before and after refining.However, refining did not change the distribution of TG molecular species.In general, the refined oil was of good quality and suitable to be used as an ω-3 PUFA supplement.
CRediT authorship contribution statement
Xuebing Zhang: Conceptualization, Methodology, Conducting the experiment, Writing - review & editing, Writing and editing the original manuscript.Liu Lin: Writing - review & editing, Editing and revise the manuscript.Zhuanxia Chen: Methodology, Conducting the experiment.Jing Zhang: Writing - review & editing, Review the manuscript.Xichang Wang: Supervision, Project administration.Ningping Tao:Conceptualization, Methodology, Writing - review & editing, Review and editing the manuscript.
Declaration of competing interest
The authors have declared no conflicts of interest.
Acknowledgments
This research was funded by the “National Key Research and Development Program of China; ” (Project NO.2016YFD0400202-8).
Appendix A.Supplementary data
Supplementary data to this article can be found online at https://doi.org/10.1016/j.aaf.2020.11.003.
 Aquaculture and Fisheries2022年6期
- Aquaculture and Fisheries的其它文章
- Transcriptome analysis and candidate gene identification reveals insights into the molecular mechanisms of hypermelanosis in Chinese tongue sole(Cynoglossus semilaevis)
- Transcriptomic analysis reveals growth-related genes in juvenile grass carp,Ctenopharyngodon idella
- A chromosome-level genome assembly of the blackspotted croaker(Protonibea diacanthus)
- Effects of low and high levels of nano-selenium on intestinal microbiota of Chinese tongue sole (Cynoglossus semilaevis)
- The digestible phosphorus requirement in practical diet for largemouth bass (Micropterus salmoides) based on growth and feed utilization
- Hybrids production as a potential method to control prolific breeding in tilapia and adaptation to aquaculture climate-induced drought