
A chromosome-level genome assembly of the blackspotted croaker(Protonibea diacanthus)
2022-03-01 03:32TinjunXuYeLiWeiweiZhengYuenSun
Aquaculture and Fisheries 2022年6期
Tinjun Xu, Ye Li, Weiwei Zheng, Yuen Sun,c
aLaboratory of Fish Molecular Immunology, College of Fisheries and Life Science, Shanghai Ocean University, Shanghai, 201306, China
bLaboratory of Marine Biology and Biotechnology, Qingdao National Laboratory for Marine Science and Technology, Qingdao, 266200, China
cKey Laboratory of Exploration and Utilization of Aquatic Genetic Resources (Shanghai Ocean University), Ministry of Education, Shanghai, 201306, China
dNational Pathogen Collection Center for Aquatic Animals, Shanghai Ocean University, Shanghai, 201306, China
Keywords:
Blackspotted croaker
Chromosomal assembly
Genome annotation
Genome evolution
Phylogenetic
A B S T R A C T
The blackspotted croaker (Protonibea diacanthus) is an endangered coastal marine fish.It is also a valuable species that is cultured on the southeast coast of China.While some genetic studies have been conducted to protect this species, genomic resources are lacking.Here, we report a chromosome-scale assembly of P.diacanthus genome by high-depth genome sequencing, assembly, and annotation.The genome scale was 635.69 Mb with contig and scaffold N50 length of 3.33 Mb and 25.60 Mb, respectively.Hi-C scaffolding of the genome resulted in 24 chromosomes of 94.15% total genome.We predicted 23,971 protein-coding genes.In addition, we constructed a phylogenetic tree using 2755 single-copy gene families and identified 462 unique gene families in P.diacanthus genome compared to three other sciaenids.What’s more, from the analysis of gene families, we found that several gene families related to innate immunity were significantly expanded in the blackspotted croaker genome compared to other teleost genomes.The high-quality genome can improve our understanding of the molecular mechanisms behind economically valuable traits and provide insights into characteristics of the immune system.
1.Introduction
Marine ecosystems provide an important source of food for human populations and especially nearshore coastal ecosystems support the highest quantity of wild fish harvest worldwide (Pauly et al., 2002).As global demand for seafood increases, many exploited species in these regions have declined and large numbers of species were fished at unsustainable levels (Jackson et al., 2001).Fishes of the family Sciaenidae are important components of coastal biological resources (Lenanton &Potter, 1987).Many species of Sciaenidae have declined in recent decades due to overexploitation, and several were considered threatened(Sadovy & Cheung, 2003; Tuuli, 2010).
Protonibea diacanthuswas one of these species (Sadovy & Cheung,2003).It can grow to a large size (>1.5 m max.tatal length; up to 42 kg mass) (Phelan, Gribble, & Garrett, 2008).P.diacanthusis widely distributed throughout coastal waters and estuaries of the tropical Indo-West Pacific (Sasaki, 2001).In China, it was distributed along the southeastern coast from the north of Taiwan to Fujian.P.diacanthuscan also be found in the coast of Japan.In Australia, it is distributed along the northern coast from Shark Bay, Western Australia, to Hervey Bay,Queensland (Phelan, 2007).Annually,P.diacanthusaggregates to spawn like other sciaenids.Historically, it was heavily harvested during breeding periods for commercial and recreational purposes.These periods accounted for a large proportion of the annual total catch and repeated unsustainable harvesting of these aggregations led to the decline ofP.diacanthus.(Sadovy & Cheung, 2003; Phelan, 2007).P.diacanthusis now under threat and methods for protecting the species have advanced considerably in recent years.In Australia, to support sustainable harvests, the population structure ofP.diacanthusacross north-western Australia was examined (Taillebois et al., 2017).However, there is a lack of genetic information which is required to make informed management practices based on species-specific knowledge.A complete genome will also allow further studies on population genetics.In China, to protect these commercially important fish, people began to culture this species instead of large-scale fishing.There has been a dramatic increase in aquaculture production ofP.diacanthusin China in recent years (Rong et al., 2020; Li et al., 2017).However, the knowledge of this species’ genome is lacking.Based on this resource, we can study its growth and immune related genes to molecular mechanism behind growth characteristics and make a good knowledge of immune system.Many researchers conduct molecular breeding based on genomic information (Zhu, He, & Chen, 1992; Du et al., 1992).We think that this genetic resource may be helpful for breeding technologies in the future.
This study is the first to present a high-quality genome sequence and annotation ofP.diacanthus.This complete genome would allow further studies in population genetics and serve as the genetic basis for future investigation of evolution and biology, which will be a valuable resource to conservation ofP.diacanthus.Our genomic analyses related to growth and immunity would improve our understanding of the molecular mechanisms behind economically valuable traits and provide insights into characteristics of the immune system, which would inform how to breed the species to enhance its economic traits and reduce the incidence of diseases.In addition, by analyzing the expanded gene families,we found thatP.diacanthusevolved a well-developed immune system,which may benefit their survival in the muddy inhabits.We think this resource may be used as a reference for studying the adaptation of other sciaenids to the coastal environment.
2.Materials and methods
2.1.Sample collection and sequencing
A one-year-old maleP.diacanthus(NCBI taxonomy ID: 335060), bred at the Laboratory of Fish Molecular Immunology of Shanghai Ocean University, Shanghai, China, was used for DNA sequencing.The DNA ofP.diacanthus was extracted from the blood and muscle tissue using a Blood & Cell Culture DNA Mini Kit (Cat# 13,323, Qiagen).The quality and the quantity of total DNA were determined by a NanoDrop UV-Vis spectrophotometer (Thermo Fisher Scientific, USA) and Qubit 3.0 Fluorometer (Invitrogen, USA), respectively.The qualified genomic DNA (OD 260/280: 1.8-2.0; OD 260/230: 2.0-2.2) was then used to construct survey, single tube long fragment read (stLFR), Nanopore and Hi-C libraries, respectively.
Two stLFR libraries with insert size of 300-1000 bp were constructed using MGIEasy stLFR Library Prep Kit and then sequenced on BGISEG-500 sequencing platform.The raw data were filtered using the stLFR2Supernova pipeline “-y -F $ADAPTOR_F -R $ADAPTOR_R -p -M 2-f-1 -Q 10” (https://github.com/BGI-Qingdao/stlfr2supernova_pipelin e).To get long single reads, we built an Oxford Nanopore library.Approximately 8 μg of gDNA was size-selected (10-50 kb) with a Blue Pippin (Siage Science, USA) and processed using the Nanopore SQKLSK109 kit (Cat# SQK-LSK109, Oxford).One library was contracted and sequenced on the R9.4 Flow Cell using the Oxford Nanopore PromethION sequencer (ONT, UK).ONT reads were based called with Guppy (version 2.2.3).1 μg DNA was taken for the survey library.In brief, DNA was randomly interrupted and purified to 200-400 bp using Covaris (LE220).After that, these fragments were connected to the joints which were designed by BGI (Qingdao, China).At last, single-chain circularization and purification were performed.Finally, one library was generated and sequenced on the BGISEQ-500 sequencing platform.
To acquire a chromosomal-level assembly of the genome, we built a high-throughput chromatin conformation capture (Hi-C) library for sequencing.Briefly, the fresh blood cells were collected by centrifugation and resuspended in PBS by repetitive pipetting.The cells were crosslinked by adding 37% formaldehyde (SIGMA, America) to obtain 1% final concentration and then added 2.5M glycine solution (SIGMA,America) to a final concentration of 0.2M to quench the reaction.To prepare nuclei, the formaldehyde fixed powder was re-suspended in nuclei isolation buffer (10 mM Tris-HCl pH 8.0 (SIGMA, America), 10 mM NaCl (BEYOTIME, Shanghai, China), 1 ×phenylmethanesulfonyl fluoride (PMSF) (SIGMA, St.Louis, America) and then incubated in 0.5% SDS for 10 min at 62 ℃.SDS was immediately quenched with 10% Triton X-100 (SIGMA, St.Louis, America) and the nuclei were collected by brief centrifugation.Afterwards, DNA was digested with the restriction enzyme (MboI) that gets a 5′overhang.The 5′overhang was filled, including a biotinylated residue.Then the resulting blunt-end fragments were ligated in situ by using T4 DNA ligase.Finally, the isolated DNA was purified using the cetyl trimethylammonium bromide(CTAB) method.The Hi-C library was created by shearing DNA and capturing the biotin containing fragments with streptavidin beads using Dynabeads MyOne Streptavidin T1 (Cat# 65,601, Invitrogen).We used T4 DNA polymerase (NEB) to repair the ends of DNA fragments to obtain blunt ends which were then 3′-adenlyated to create sticky ends.These DNA fragments were ligated at both ends to T-tailed adapters and amplified for eight cycles using KAPA HiFi HotStart ReadyMix (Cat#KK2600, Kapa Biosystems).After that, the standard circularization step required for BGISEQ-500 was carried out.A PE library with 200-400 bp insert size was constructed.Sequencing of Hi-C library was performed using the BGISEQ-500 platform with a read length of 100 bp for each end.The raw reads of survey and Hi-C were filtered out using SOAPnuke(Chen et al., 2017) with parameters “-n 0.05 -l 10 -q 0.1 -M 2 -Q 2 -G”and “-n 0.05 -l 5 -q 0.5 -A 0.5 -M 1 -Q 2 -G -d”, respectively.
2.2.Genome assembly
First, we used a K-mer frequency distribution method to estimate the genome size with Jelly fish (version 2.2.10) (Marcais & Kingsford, 2011).For this, 17-bp k-mers (17mers) were extracted from the sequencing data and the frequency of each 17-mers was calculated.The genome size was estimated to 675.06 Mb.The stLFR sequencing valid reads was first transferred into 10X Genomics format using stLFR2Supernova pipeline(https://github.com/BGI-Qingdao/stlfr2supernova_pipeline).Then we used Supernova (version 1.12) (Weisenfeld, Kumar, Shah, Church, &Church, 2017) to assemble the genome with parameters “supernova run-id =$projiect_name -maxreads =$max_reads -fastqs =./-localcores=$threads -localmem =$memory -accept-extreme-coverage -noprefl ight>supernova_run_’$tag’.log 2>supernova_run_’$tag’.err || exit 1”.The gaps in the assembly were filled using Gapcloser (version 1.12) (Luo et al., 2012) with clean reads in survey library for two times.Here are the parameters: “max_rd_len =100, avg_ins =350, reverse_seq =0,asm_flags =3, rank =1, pair_num_cutoff =3, map_len =32”.Then, we enhanced the draft assembly using TGS-GapCloser pipeline (https://gith ub.com/BGI-Qingdao/TGS-GapCloser) based on the long Oxford Nanopore reads and clean reads for genome survey with parameters “pion_-mem = ’300G′, chunk_num =1, cpu =30, minimap2_pram = ’-x ava-ont’, minidy = ’0.30′, minmatch =300”.
We performed quality control of Hi-C raw data using HiC-Pro(version 2.8.0) (Servant et al., 2015).To obtain the valid pairs, we used bowtie2 (version 2.2.5) (Langmead, Trapnell, Pop, & Salzberg,2009) to align raw reads to the draft assembled sequence with the end-to-end model (-very-sensitive -L 30).Here are parameters: “min_-frag_size =100, max_frag_size =100,000, min_insert_size =50, max_-insert_size =1500, max_iter =100,filter_low_count_perc =0.02,filter_high_count_perc =0.” In the next, we then used Juicer (version 1.5) (Durand et al., 2016), an open-source tool for analysis of Hi-C data sets with parameter “-sMboI”, and a 3Dde novoassembly (3D-DNA,version 70.123) (Dudchenko et al., 2017) to anchor primary scaffolds into 24 chromosomes with parameters “-m haploid -s 4 -c 24 -S split”.
2.3.Genome prediction and annotation
We used TRF (version 4.09) (Benson et al., 1999), RepeatMasker(version 3.3.0) and RepeatProteinMask (version 3.3.0) (Tarailo-Graovac& Chen, 2009) to detect repeat sequences and classify different types of repetitive sequences by aligning genome sequences to the Repbase library (version 17.01) (Jurka, Kapitonpy, Pavlicek, ).We also conducted a RepeatModeler analysis on thede novolibrary and used RepeatMasker(version 3.3.0) (Jurka, Kapitonpy, Pavlicek, ) to classify transposable elements (TEs) in the genome.
Based on the repeat masked genome, gene models were constructed,which incorporatesab initioprediction and homology-based prediction.Augustus (version 2.5.5) (Stanke et al., 2006), Gummerhmm (version 3.01) (Majoros et al., 2004) and Genescan (Burge & Karlin, 1997) were used forde novogene prediction with default settings.For homology-based methods, protein sequences ofCynoglossus semilaevis(GCF_000523025.1),Danio rerio(GCF_000002035.6),Gadus morhua(GCF_902167405.1),Gasterosteus aculeatus(GCA_006229165.1),Oreochromisniloticus(GCF_001858045.2),Oryziaslatipes(GCF_002234675.1),Seriola lalandi(GCA_003054885.1) andTakifugu rubripes(GCF_901000725.2) were download from the NCBI database and aligned to the blackspotted croaker genome using TBLASTN(E-value ≤10-5).GENEWISE (version 2.4.0) (Doerks, Copley, Schultz,Ponting, & Bork, 2002) was used to generated gene structure based on the alignment with parameters “blat -t 5 -a 0.3 -d 0.2 -c 50 -e 1000”.We performed GLEAN (Elsik et al., 2017) to integrate the results of thede novogene predictions and homolog-based gene annotations.In homolog-based gene annotations, we removed genes supported by only one homologous species.Genes which were only predicted inde novomethod and not jointly predicted by the three software were filtered out.
Functional annotations of the blackspotted croaker were then made by homology searching in several public gene databases, including Interpro, Kyoto Encyclopedia of Genes and Genomes (KEGG), Swissprot,and TrEMBL using BLASTP (E-value ≤10-5).We also used InterProScan(version 4.7) (Jones et al., 2004) to obtain protein domain annotations in Gene ontology (GO) databases.Finally, functional annotations of the best alignments in each database were used as the final consensus gene annotation result.To get noncoding RNAs, we also used BLAST to align theP.diacanthusgenome against the Rfam database (version 11.0)(Burge et al., 2013).
2.4.Assessment of completeness of the assembly and annotation
To assess the completeness of the assembly, reads from one small library were mapped back to the scaffolds using BWA (version 0.7.12)(Houtgast, Sima, & Al-Ars, 2018).We also conducted single-nucleotide polymorphism (SNP) analysis using Genome Analysis Toolkit (GATK)(version 4.0.2.1) (McKenna et al., 2010).Moreover, we performed analysis with Benchmarking Universal Single-Copy Orthologs (BUSCO,version 3.0) (Simao, Waterhouse, Ioannidis, Kriventseva, & Zdobnov,2015) with anActinopterygiigene set.In addition, to assess the completeness of the gene annotation, we used the Benchmarking Universal Single-Copy Orthologs (BUSCO, version 3.0) (Simao et al., 2015)with anActinopterygiigene set.
2.5.Phylogenetic analysis and gene family expansion and contraction analysis
To reveal phylogenetic relationships amongP.diacanthusand other species and analyze expansion and contraction of gene families between species, we identified gene families in theP.diacanthusgenome and 11 other vertebrate species, includingSciaenopsocellatus(GCA_014183145.1),Miichthys miiuy(GCA_001593715.1),Larimichthys crocea(GCF_000972845.2),Danio rerio(GCF_000002035.6),Oryzias latipes(GCF_002234675.1),Gasterosteus aculeatus(GCA_006229165.1),Tetraodonnigroviridis(GCA_000180735.1),Takifugurubripes(GCF_901000725.2),Cynoglossus semilaevis(GCF_000523025.1),Xiphophorus maculatus(GCF_002775205.1) andCallorhinchus milii(GCF_000165045.1).Firstly, we used BLASTP to align protein sequences of the 12 species with anE-value threshold of 1e-5.All genes were then clustered using OrthoMCL (Li, Stoeckert, & Roos, 2003) with the parameter of “mode 3”.We used single-copy orthologues which exist in all species to construct the phylogenetic tree.In brief, we used MUSCLE(version 3.6) (Edgar, 2004) to align the sequences of protein-coding genes with default parameters.The aligned protein and the fourfold degenerate sites in the corresponding coding sequences were each concatenated into a super gene (Lin et al., 2016).In the next, the phylogenetic tree was then constructed using maximum-likelihood algorithm in RAxML (version 8.2.4) (Stamatakis, 2006) with the optimal amino acid substitution model selected by PROTGAMMAAUTO parameter.Robustness of the maximum-likelihood tree was assessed using the bootstrap method (100 pseudo-replicates).MCMCtree in the PAML package (Yang, 2007) was used to predict divergence times.To visualize the concordances between the finalP.diacanthusassembly and three other sciaenids, the 24P.diacanthuschromosomes were aligned to the three other sciaenids chromosomes using LASTZ with default settings, respectively (version 1.10) (Harris, 2007).
We used CAFE (De Bie, Cristianini, Demuth, & Hahn, 2006) to identify expanded and contracted gene families betweenP.diacanthus,L.crocea,S.ocellatus,G.aculeatus,T.rubripes,T.nigroviridis,O.latipesandD.reriowith parameters “-p 0.05 -t 4 -r 10,000 -filter lambda -s”.We chose these species based on their evolutional significance and potential research value.The corresponding p-values were calculated in each lineage based on the conditional likelihood.
3.Results and discussion
3.1.Genome sequencing and assembly
We sequenced the genome ofP.diacanthuswith NGS and Oxford Nanopore sequencing technology.Two stLFR libraries and one survey library generated 179.6 Gb and 81.84 Gb raw data, respectively.In addition, we obtained 69.30 Gb long single reads from Oxford Nanopore libraries (Table 1, Figure S1).We also obtained 264.20 Gb valid Hi-C data after quality control (Table 1).The genome assembly spanned 635.69 Mb with a contig N50 of 3.326 Mb, a scaffold N50 of 25.60 Mb,and a GC content of 41.41% (Table 2).Using Hi-C data, we anchored and orientated scaffolds into 24 chromosomes (Fig.1).The length of 24 chromosomes ranged from 13.35 Mb to 32.49 Mb (Table S1), which additively covered 94.16% of the whole genome sequences.
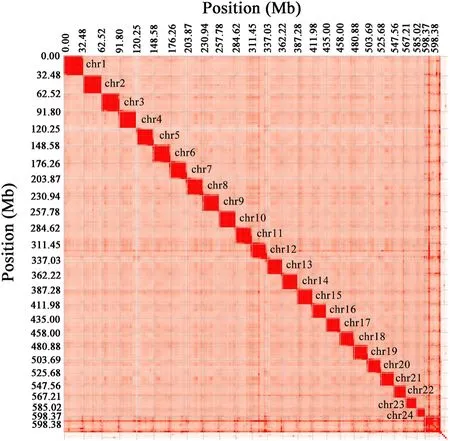
Fig.1.Heat map of chromosomal interactions in the P.diacanthus genome.The intensity of red represents the relative contact density between contigs, with deeper colours representing higher density.Numbers on the top and left represent the cumulative size of the genome.(For interpretation of the references to colour in this figure legend, the reader is referred to the Web version of this article.)
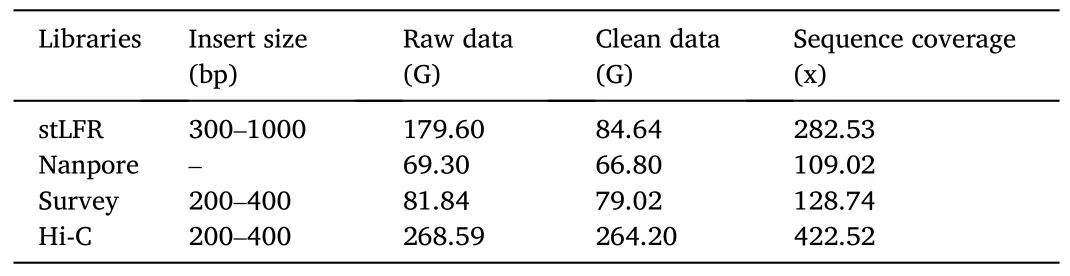
Table 1Statistics of the genome sequencing data.
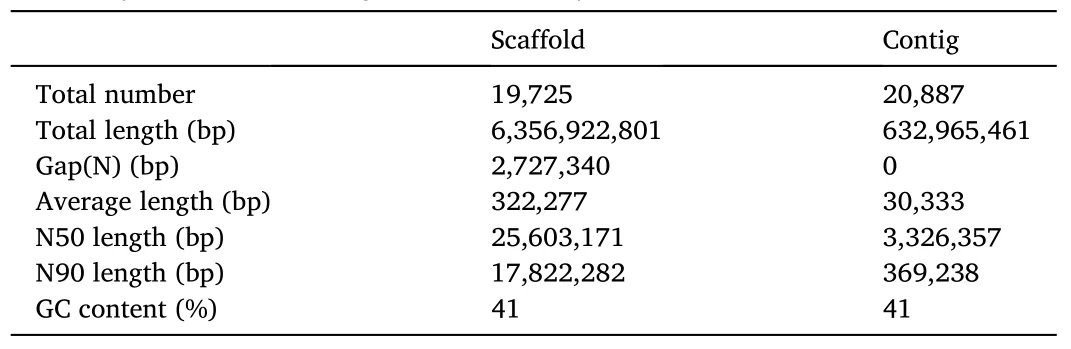
Table 2Summary of P.diacanthus genome assembly.
By assessing the accuracy and completeness of the genome assembly ofP.diacanthus, we obtained 8246 homozygous single-nucleotide polymorphisms (SNP) (Table S2).The extremely low proportion of homozygosis SNPs showed that the assembly has a high single-base accuracy so that we can infer that the assembly is of high accuracy.Moreover, the mapping rate of reads from the small library was 98.50%,and the genome coverage was 96.94% (Table S3).The BUSCO results showed that the assembly contained 97.70% complete and 1.2% fragmented orthologue genes (Table S4).The assessment results indicate that the genome assembly had good coverage and completeness.
3.2.Genome annotation
De novoprediction and homology search against the Rephase database showed that repetitive elements comprised 19.98% ofP.diacanthusgenome (Table S5).The most abundant TEs were DNA transposons(10.35% of the genome), followed by long interspersed elements (LINEs,5.66%) and long terminal repeats (LTRs, 3.27%) (Table S6; Figure S2).
After integrating results of thede novoand homolog-based gene predictions, we obtained a non-redundant gene set containing 23,971 protein-coding genes, with an average gene and CDS lengths of 13,531.62 bp and 1710.28 bp, respectively (Table S7), which were consistent with the distributions of gene features in other teleosts(Figure S3).Among predicted genes, 23,141 genes were functionally annotated in at least one of Swissprot, KEGG, TrEMBL, Interpro or GO databases (Figure S4; Table S8).Non-coding RNA such as rRNA, tRNA,snRNA, miRNA, not translating proteins, has important biological functions.We identified 2970 non-coding RNA, including 265 miRNA,1433 tRNA, 336 rRNA and 295 snRNA (Table S9).Finally, we assessed the completeness of gene annotation.The BUSCO results showed that our gene set contained 93.50% complete and 4.80% fragmented orthologue genes (Table S10), showing that our gene annotation was highly complete.
3.3.Phylogenetic and gene family expansion and contraction analysis
To investigate phylogenetic relationships ofP.diacanthuswith other species, we compared the genomes ofP.diacanthusand 11 other published vertebrate species.Finally, we obtained 17,779 gene families and 2755 single-copy orthologues (Fig.2a, Table S11).In addition, we found that there were 11,132 gene families shared byS.ocellatus,P.diacanthus,M.miiuyandL.crocea(Fig.2b).We identified 462 unique gene families inP.diacanthusgenome.These lineage-specific gene families may contribute to traits that are specific toP.diacanthus(Fig.2b).Using these single-copy orthologues, we constructed a phylogenetic tree.It showed thatM.miiuy,L.croceaandS.ocellatusare most closely related toP.diacanthuswith a divergence time ~60 million years ago.The ancestors ofP.diacanthusand the three sciaenids separated from the ancestor ofG.aculeatus~90 million years ago (Fig.3a).
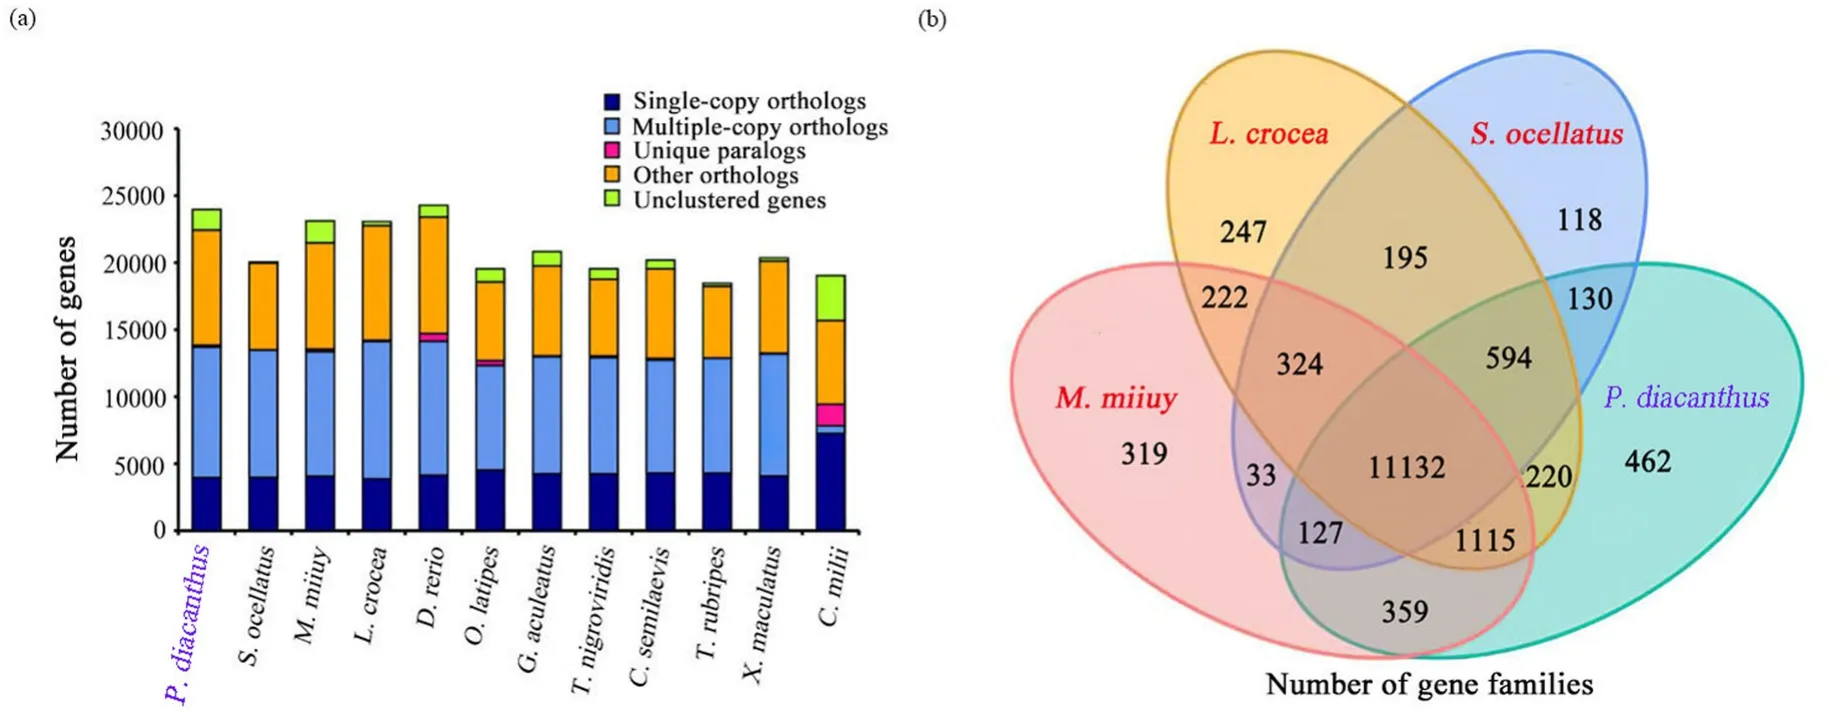
Fig.2.Comparison of genes and gene families.(a) Comparison of the number of homolog genes among S.ocellatus, M.miiuy, L.crocea, D.rerio, O.latipes, G.aculeatus, T.nigroviridis, T.rubripes, C.milii, C.semilaevis, X.maculatus and P.diacanthus.(b) Venn diagram of orthologous gene families.Four teleost species(S.ocellatus, L.crocea, M.miiuy, and P.diacanthus) were used to generate the Venn diagram in accordance with gene family cluster analysis.
Respectively, we then comparedP.diacanthusgenome withM.miiuy,L.croceaandS.ocellatusgenomes to examine chromosome evolution events after speciation.We conducted whole genome alignment betweenP.diacanthusand the three sciaenids with LASTZ (version 1.10)(Harris, 2007).We found that 24 chromosomes ofP.diacanthuscould be unambiguously aligned to single chromosomes ofM.miiuyandS.ocellatuswith 0.94 and 0.96 average coverage ratio, respectively.However, compared withP.diacanthusgenome,L.croceashowed a lower coverage 0.83 (Fig.3b, Table S12) compared to two other sciaenids, indicating these two species are less related.

Fig.3.Genome evolution analysis.(a) Phylogenetic tree of 12 vertebrate genomes.We used 2755 single-copy orthologous gene families from 11 teleost species.Divergence times from C.milii-D.rerio (452~496 Mya), D.rerio-C.semilaevis (165~209 Mya), X.maculatus-O.latipes (74~98 Mya), and T.rubripes-T.nigroviridis(40~52 Mya) from the Time Tree database were used as the calibration times.The blue numbers on the branches indicate the estimated diverge times in millions of years ago (Mya), and red circles indicate the calibration time.(b) Collinear blocks between P.diacanthus and M.miiuy, L.crocea, and S.ocellatus genomes,respectively.Each colored arc represents a best match between two species.Pdi_1-24 represents chromosomes 1-24 of P.diacanthus genome.Mmi_1-24, Lcr_1-24,and Soc_1-24 represent chromosomes 1-24 of M.miiuy, L.crocea, and S.ocellatus genome, respectively.(For interpretation of the references to colour in this figure legend, the reader is referred to the Web version of this article.)
A total of 698 expanded gene families (P <.05) and 1393 contracted gene families (P <.05) were identified inP.diacanthusgenome compared to 7 other teleost species, includingL.crocea,S.ocellatus,G.aculeatus,T.rubripes,T.nigroviridis,O.latipesandD.rerio(Fig.4,Table S13; Table S14).These expanded genes were significantly enriched in immunity, growth and development.

Fig.4.Expansion and contraction of gene families.Blue and red numbers represent the expanded or contracted gene families in each lineage, respectively.MRCA:most recent common ancestor.(For interpretation of the references to colour in this figure legend, the reader is referred to the Web version of this article.)
Like many other sciaenids,P.diacanthusinhabits coastal bottom water.This water area is relatively turbid and the bottom is mostly sandy mud.In previous study (Xu et al., 2016), we usedM.miiuyas a research species and have investigated some genes related to vision,taste and smell to try to understand sciaenids’ adaption to muddy environments.We found thatM.miiuyseems to evolve stronger physiological functions of smell and taste to adapt turbid waters.On the other hand, usually muddy sand contains more microorganisms, and the pathogenicity of these microorganisms may be a challenge forP.diacanthusand other sciaenids.In this study, we decided to focus on the development and evolution of the immune system ofP.diacanthusto understand the adaption to muddy inhabits.We found expanded genes were significantly enriched in immune system pathways such as the NOD-like receptor signaling pathway, phagosome and autophagy.
In NOD-like receptor signaling pathway, we found that the gene families NACHT, LRR and PYD domains-containing proteins (NLRPs)were significantly expanded inP.diacanthusincludingNLRP3andNLRP12.NLRP3, the sensor component of the NLRP3 inflammasome,plays a crucial role in innate immunity and inflammation (Nakanishi et al., 2017).WhileNLRP12plays an essential role as a potent mitigator of inflammation (Normand et al., 2018).The two genes are essential in response to pathogens and other damage-associated signals in NOD-like receptor signaling pathway.We also found that tripartite motif-containing proteins (TRIMs) were significantly expanded includingTRIM21andTRIM25.They modulate innate immune responses to bacterial and viral infections that involve the activation of IFN-regulatory factor 3 (IRF3),IRF7and nuclear factor-κB (NF-κB)(Ozato, Shin, Chang, & Morse III, 2008).Other genes related to immune system such as Acidic mammalian chitinase (Chia), apoptosis-associated speck-like protein containing a CARD (PYCARD) also expanded inP.diacanthus.We also identified specific gene families inP.diacanthus(Table S15).Many specific genes may be involved in immune system such as butyrophilin subfamily 1 member A1-like (BTN1A1) and leukocyte elastase inhibitor-like (SERPINB1) (Table S15).Therefore, we inferred thatP.diacanthusmay evolve an enhanced immune system to adapt to the muddy inhabits compared to other teleosts.
4.Conclusion
In this study, combined with stLFR reads (generated by BGISEQ-500), Oxford Nanopore long reads (generated by Oxford Nanopore PromethION sequencer), survey reads (generated by BGISEQ-500) and Hi-C reads (generated by BGISEQ-500), we obtained totally about 500 Gb clean data.We first assembledP.diacanthusgenome at chromosomelevel.The final genome assembly contain 24 chromosomes ranging from 13,348,899 bp to 32,491,028 bp.We also predicted 23,971 genes, of which 96.54% can be functionally annotated.In addition, we obtained some expanded and contracted gene families inP.diacanthuscompared to other species.The investigation of genome characteristics and function features provides insights into the molecular mechanism of the biology ofP.diacanthus.This study will not only be beneficial to improve molecular assisted breeding techniques and disease management in the blackspotted fish, but also provided references for the study of the genome of sciaenids.
Author contributions
T.X.designed the project.Y.L., W.Z., and T.X.analyzed the data.Y.S.,and T.X.prepared the samples and conducted the experiments.Y.L., and T.X.wrote and revised the manuscript.
Date availability statement
The genome assembly and raw data has been deposited into the NCBI with Bioproject accession PRJNA608639.Gene annotations are now available at: https://doi.org/10.5281/zenodo.3969378.
Declaration of competing interest
The authors declare that they have no competing interests.
Acknowledgements
This study was supported by the National Key Research and Development Project (2018YFD0900301) and the National Natural Science Foundation of China (31802325).
Appendix A.Supplementary data
Supplementary data to this article can be found online at https://doi.org/10.1016/j.aaf.2021.05.003.
 Aquaculture and Fisheries2022年6期
- Aquaculture and Fisheries的其它文章
- Transcriptome analysis and candidate gene identification reveals insights into the molecular mechanisms of hypermelanosis in Chinese tongue sole(Cynoglossus semilaevis)
- Transcriptomic analysis reveals growth-related genes in juvenile grass carp,Ctenopharyngodon idella
- Effects of low and high levels of nano-selenium on intestinal microbiota of Chinese tongue sole (Cynoglossus semilaevis)
- The digestible phosphorus requirement in practical diet for largemouth bass (Micropterus salmoides) based on growth and feed utilization
- Characterization of refined fish oil from small fish in Mauritania
- Hybrids production as a potential method to control prolific breeding in tilapia and adaptation to aquaculture climate-induced drought