
Transcriptomic analysis reveals growth-related genes in juvenile grass carp,Ctenopharyngodon idella
2022-03-01 03:32YubngShenKeyiQinZhuXioynXuJileLi
Aquaculture and Fisheries 2022年6期
Yubng Shen, Keyi M, Qin Zhu, Xioyn Xu,b,c, Jile Li,b,c
aKey Laboratory of Freshwater Aquatic Genetic Resources, Ministry of Agriculture, Shanghai Ocean University, Shanghai, 201306, China
bShanghai Engineering Research Center of Aquaculture, Shanghai Ocean University, Shanghai, 201306, China
cNational Demonstration Center for Experimental Fisheries Science Education, Shanghai Ocean University, Shanghai, 201306, China
Keywords:
Growth trait
Grass carp
Transcriptomics
Muscle
Differentially expressed genes
A B S T R A C T
Grass carp has the highest production yield among all the farmed fish species around the world.But the molecular and genetic basis of growth traits is inadequately understood in this fish.In the present study, we apply whole-transcriptome sequencing to identify genes whose expression is different between fast and slow growing grass carp.We identified 1178 differentially expressed genes (DEGs), among which 270 were upregulated in the fast growing group and 908 upregulated in the slow growing group.The GO enrichment analysis revealed that DEGs was significantly enriched in protein synthesis and export machinery, cell division and development and metabolism, suggesting that cell division and metabolism may play key roles in development processes of fish.KEGG pathway analysis showed that MAPK signaling pathway may play a prominent role in growth difference.In addition, the majority of genes in immune responses related pathway were upregulated in the slow growing individuals.These results provide some valuable resources for understanding the molecular mechanisms of growth traits in fish.
1.Introduction
Growth rate is one of the most important economic traits in all farmed species.The economic benefit of faster growth can be realized by a short time to harvest, meaning products with a faster turnover rate.A fast growing animal requires less energy and proteins for maintenance compared with one that grows slower, and as growth rate increases, so does feed conversion efficiency (Verdal et al., 2017).Growth rate can be easily measured.Several selective breeding programs for improving growth rate have been carried out in some fishes (Gjedrem, 2005).In those breeding programs, successful selection for optimal growth rate or body weight is a key objective.Phenotypic selection was always used to select for growth rate.However, it requires several generations to optimize genetic improvement.The reason is that growth rate is a quantitative trait.Heritability estimates for this trait in fish tend to be in the range of 0.20-0.30 (Gjedrem, 2005).Moreover, a multitude of environmental factors, such as nutrition and diseases, have a substantial contributory effect during the growth period.Marker-assisted selection(MAS) will greatly increase selection response in the near future.Markers potentially controlling the trait always occur within candidate genes.The discovery of high quality candidate genes is therefore a crucial step in the discovery of polymorphism associated with complex traits such as growth.
Rapid development of next generation sequencing (NGS) technology makes it possible to identify large numbers of high quality candidate genes.RNA-Seq is able to capture a genome-wide view of gene expression profile at the transcriptome level.Novel and low-abundance transcripts can be efficiently identified.It could offer insights into the complicated gene regulation networks and signaling pathways activated and operated in various biological processes (Ozsolak & Milos, 2011).Various RNA-Seq studies have been reported in grass carp under the effects of different pathogens, such as GCRV (He et al., 2015; Shi et al.,2014),Aeromonas hydrophila(Dang et al., 2016; Song et al., 2017; Xu et al., 2014), which provided better understanding of the mRNA transcriptome in grass carp.However, until now, only very few studies have been reported on the growth traits in grass carp at the transcriptomic level (He et al., 2015).
Grass carp is one of the most important aquaculture food fish species,having great commercial value and a worldwide distribution (Fu et al.,2016).Global production of cultured grass carp is approximately 4.6 million tons per year, accounting for 11.8% of global freshwater aquaculture production in 2016 (FAO, 2018).Considerable biological knowledge has been developed for this species as a result of widespread cultivation as a food fish.But the molecular and genetic basis of growth traits is inadequately understood in this fish.A family-based selection program was initiated in 2010 at the National Breeding Center of Grass Carp to improve growth performance in grass carp.The aim of this study was to identify the differentially expressed genes (DEGs) involved in differential growth in grass carp.Differential gene expression between two sibling groups of grass carp demonstrating significant differences in body weight was explored.This study identified the signaling pathways involved in growth rate.The obtained information would facilitate the uncovering of the molecular mechanisms of differential growth in fish species.The identification of growth-related genes represents a step forward in the genetic improvement of grass carp.
2.Materials and methods
2.1.Ethics statement
All handling of fishes was conducted in accordance with the guidelines on the care and use of animals for scientific purposes set up by the Institutional Animal Care and Use Committee (IACUC) of the Shanghai Ocean University, Shanghai, China.The IACUC has specially approved this study within the project “Breeding of Grass Carp” (approval number is SHOU-09-007).
2.2.Sample collection
We used the fish from a growth-selected line at the National Breeding Center of Grass Carp (Jiangsu Province, China).One hundred and four full-sib families were constructed in 2010 by crossbreeding 4 wild founder populations with known high genetic diversity.We randomly selected one high growth male from one family and one low growth female from another family to produce a full-sib family.Offspring were reared in one experimental pond which takes up a 1 mu (667 m2) land area and fed twice daily with commercial pellets (TongWei Company,China).
Individual body weight was measured at 6 months post-hatching.Generally, the 6-month-old juvenile grass carp will be used to growout culture.Ten fast growing (Average weight =95.2 g, SD =10.3 g)and ten slow growing (Average weight =23.8 g, SD =4.6 g) grass carp were collected.Muscle samples from each fish were flash frozen in liquid nitrogen, and then stored at -80 ℃ until total RNA isolation, since the majority of the fish’s growth is invested in accretion of muscle tissue and muscle may account for more than half of the fish’s body mass(Mommsen, 2001).
2.3.RNA extraction and sequencing
Total RNA was extracted from each sample using the TRIzol reagent(Invitrogen, Carlsbad, USA) following the manufacturer’s instructions.Equal masses of 1 μg total RNA from the samples of each group were pooled for RNA sequencing using a HiSeq 2000 Illumina platform.RNA integrity was assessed using the 2100 Bioanalyzer by RNA 6000 nano with a minimum RNA integrity number (RIN) value of 8.0.Ribosomal RNA was then removed prior to proceeding.The cDNA libraries were prepared using the NEBNext Ultra RNA Library Prep Kit from Illumina(New England Biolabs, Ipswich, MA, USA).We sequenced 150 base pairs, paired end reads.
2.4.RNA-seq analysis
The quality of cleaned reads was checked using FastQC (Andrews,2010).Thereafter, the software Trimmomatic v0.32 (Bolger et al., 2014)was used to remove low quality bases and adaptors from each RNA library.A minimum length of 50 bases was chosen as a cutoff for each raw read.Then, all cleaned reads were aligned and mapped using Tophat v2.0.11 (Trapnell et al., 2009) to provide genomic location information, and only reads that mapped to a single gene were used for further analysis.The Genome sequence and annotation downloaded from http://www.ncgr.ac.cn/grasscarp/were used as reference for mapping.
These uniquely mapped reads were used to generate count data using HTseq v0.5.3 (Anders et al., 2015).Then, we applied DESeq (Love et al.,2014), which uses exact tests to identify statistically significant differentially expressed genes (DEGs).Deseq models read counts using a negative binomial distribution (Love et al., 2014).A false discovery rate(FDR) adjustedP <0.05, with the Benjamini-Hochberg adjustment for multiple testing, is considered significant (Benjamini & Hochberg,1995).Only transcripts with log2(fold change)>2 or<-2 and adjustedP <0.05 as identified by both the two methods were considered to be DEGs.
Gene ontology assignment of the DEGs was performed by Blast2Go(Conesa et al., 2005) against all available nucleotide databases, with an E-value cutoff of 10-6.Functional classification of the DEGs was further conducted using the program WEGO (Ye et al., 2006) with default parameters.GO terms enrichment analysis were conducted at the pantherdb database (http://www.pantherdb.org/).The signaling pathways associated with the genes in the enrichments groups were performed by annotation against the Kyoto Encyclopedia of Genes and Genomes(KEGG) pathway database (Kanehisa & Goto, 2000).KEGG pathway enrichment was conducted by using the Clusterprofiler package.A correctedP <0.05 was the cut-off criterion.
2.5.Quantitative real-time PCR validation
Quantitative real-time PCR was used to confirm gene expression revealed by RNA-Seq.Five fast growing and five slow growing fishes were sampled at 6 months post-hatching from the same experimental pond.Total RNA was extracted ad reverse transcribed as previously described (Shen et al., 2011).Gene-specific primers were designed using the Primer Select program (DNASTAR, Madison, WI).Primers designed based on the sequences of the selected DEGs are listed in Table 2.Melting-curve analysis revealed a single product for all tested genes.Quantitative real-time PCR was carried out using the CFX96 Real-time PCR Detection System (Bio-Rad).Each cDNA sample was measured in triplicate.Relative expression was determined using the comparativeCTmethod (ΔΔCT) (Livak & Schmittgen, 2001), with samples normalized against beta-actin gene and expressed as fold change.Student’s t-test was performed using SPSS (SPSS Inc., Chicago, IL, USA) version 20.0 to determine whether there were significant differences between the fast growing and slow growing grass carp.
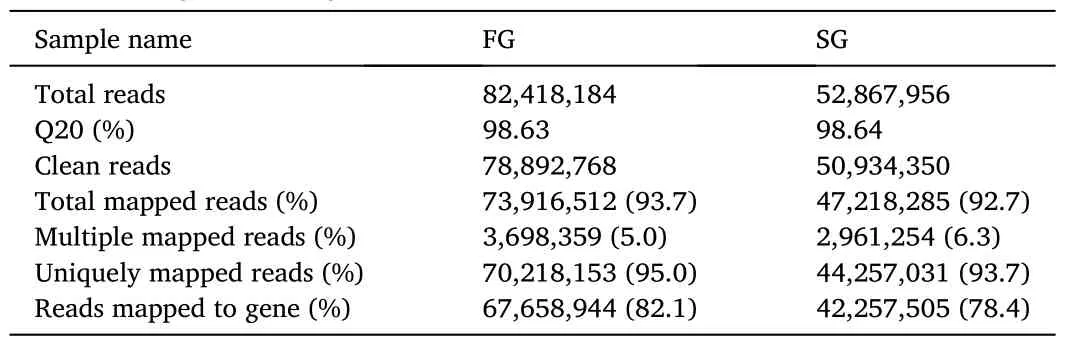
Table 1Summary statistics of the Illumina paired-end sequencing reads and the mapping to reference genome of grass carp.

Table 2Primers of DEGs used for Q-PCR.
3.Results and discussion
3.1.Sequencing of mRNA and alignment against the reference genome
Paired-end short read RNA-Seq technology was used to identify genes differentially expressed between the fast growing and slow growing grass carp.Two pools of ten samples from the fast growing fish and ten samples from the slow growing fish were used to construct two Illumina libraries.Two libraries gave Q20 ≥98%, confirming the high quality of the sequencing data.A total of 129,827,118 sequence reads and 13.47 Gb clean bases were obtained after quality trimming.Each library was represented by at least 50 million clean reads, a read density regarded as adequate to perform gene expression analysis.We obtained a total of 1.21 ×10⁸reads that mapped to the grass carp reference genome (over 92% of the filtered short reads) (Table 1) (Wang et al.,2015).From the total reads mapped, more than 93% was unique alignment, whereas the remaining reads were multiple mapped tags(Table 1).The multi-alignment parameters are a significant barrier in using the short-read sequencing methodology in transcriptomic studies,because it is influenced by both length and complexity of the reads.These multiple mapped reads were excluded from further analysis to reduce error probability.The percentages of reads mapped to genes were 78.4% and 82.1% for the fast growing group and slow growing group,respectively (Table 1).
3.2.Differentially expressed genes related to growth
Expression levels were computed as reads per kilobase of the transcript per million mapped reads (RPKM) and normalized by totals.In order to identify differentially expressed genes, fold change values were estimated by comparing RPKM values of the fast growing and slow growing groups.A FDR at the level of 0.05 was applied for p-value correction.We are able detect expression for 32,811 genes, out of 28,060 annotated genes in the genome.We identified a total of 1178 DEGs between the fast growing and slow growing groups, among which,270 were up-regulated in the high growing group and 908 up-regulated in the slow growing group (Table S1).A lot of growth-related genes that previously reported in other studies overlapped with our DEG genes,such as GHRb, MYL4, and Parvalbumin 1.GHR is a critical regulator of growth and metabolism.It should be an important gene that explains the difference in growth among tilapia species (Liu et al., 2014).MYL4 encodes a myosin alkali light chain and has a negative regulatory effect on myogenesis by inhibiting myoblast proliferation.Yu et al.also found it was associated with Changes in muscle fibre size in grass carp (Yu et al., 2017).Parvalbumin is very important in the relaxation of muscle fibres.The microsatellite in PVALB1 was significantly associated with body weight and body length at 90 days post-hatch in Asia seabass (Xu et al., 2006).
We found that many more up-regulated DEGs were identified in slow growing group than that in the fast growing group, similar to results being reported in pig (Komatsu et al., 2016) and abalone (Valenzuela--Miranda et al., 2015), but we do not know the reasons.
3.3.Validation of DEGs with qRT-PCR
To validate the DEGs identified by RNA-Seq, we randomly selected six genes from those with differing expression patterns and from growthrelated genes of interest based their function to quantify their expression in the fast growing and slow growing groups using qRT-PCR.The relative expression values from qRT-PCR were compared with the results of RNA-Seq expression analysis (Fig.1).The expression tendencies of the six genes observed in qRT-PCR and RNA-Seq methods were largely consistent.These results indicated the reliability and accuracy of the RNA-Seq data in this study.

Fig.1.Comparison of expression values of fifteen genes between the fast growing and slow growing grass carp by RNA-Seq and qRT-PCR.Histograms represent the relative expression levels (log 2) (RPKM) as accessed by RNA-Seq.Black dotted lines represent the expression levels of the relative expression by qRTPCR.P value indicate statistical significance of qRT-PCR.
3.4.Gene ontology analysis suggests significant association of growth with cell division and metabolism
To better understand the overall biology of the transcriptional growth difference in grass carp, we examined gene ontology (GO) of the 1075 DEGs between the fast and slow growing grass carp in three component ontologies.A full list of GO terms enriched (P <0.05) for genes either upregulated or downregulated is in Table S3.As expected,DEGs are enriched for a number of biological process GO categories related to protein synthesis and export machinery.These include“locomotion” (P=1.53 × 10⁻³) and “transport” (P=2.30 × 10⁻⁵).Additionally, DEGs are enriched for GO terms primarily related to cell division and development.These include “cell differentiation” (P=1.89× 10⁻⁵), “cell motility” (P=7.77 × 10⁻⁴), “cell proliferation” (P=4.10× 10⁻⁵), “cellular component assembly” (P=0.04) and “growth” (P=9.92 ×10⁻³).Meanwhile, we found DEGs enriched for GO classes suggestive of a role in metabolism.These include “carbohydrate metabolic process” (P=8.40 × 10⁻⁴), “generation of precursor metabolites and energy” (P=4.97 × 10⁻³) and “lipid metabolic process” (P=1.33×10⁻³).The GO terms for molecular function paint a similar picture(Table S3).Taken together, these patterns suggested a close connection between protein synthesis, cell division and metabolic process and growth difference.These results are agreement with previous studies in fish.In a study on rainbow trout, terms related to “carbohydrate” and“lipid” were found in large rainbow trout, while genes within “transport” GO category were more highly expressed in small rainbow trout(Danzmann et al., 2016).
3.5.KEGG pathway analysis suggests negative association of growth with disease traits
We further examined KEGG pathway enrichment to identify broad functional categories of the DEGs.After pathway enrichment analysis,937 DEGs had KEGG pathway annotations.We found 12 significantly enriched pathways withP <0.05, including Lipid metabolism, Amino acid metabolism, Metabolism of cofactors and vitamins, Membrane transport, Cell communication, Endocrine system and Digestive system(Table S4).However, these enriched pathways are different from that reported by previous researcher (He et al., 2015).Maybe He et al.collected samples from grass carp in starved and re-feeding condition.Both the studies all suggested that metabolic pathways play a key role in growth performance in fish species.
Genes which were upregulated in the fast growing group were enriched in a total of 13 signal transduction pathways, including one significantly enriched pathways, MAPK signaling pathway (Table S5).The MAKPs is kinase families.MAPK pathway is involved in cell proliferation, differentiation, migration and death (Zhang & Liu, 2002).It is located downstream of many growth factor receptors.To show the association of the MAKP signaling pathway and growth, 4 DEGs in the pathway were significantly upregulated in fast growting group using qRT-PCR (Fig.2).In fish, this signaling pathway is known to regulate myogenic cell proliferation, differentiation, and protein synthesis(Fuentes et al., 2013).In addition, we detected that most of the genes in immune response related pathways were upregulated in the slow growing individuals (Table S5).Immune system was included in the significant KEGG pathways.These results suggest that immune responses are negatively associated with growth rates.A number of studies have confirmed a negative association between growth rates and resistance traits in farmed animals (Foote et al., 2007; Overturf et al., 2010).These results have been used to explain why larger individuals die more easily during outbreaks of diseases.

Fig.2.The expression levels of the four DEGs in MAPK signaling pathway beween the fast growing and slow growing grass carp by qRT-PCR.Black dotted lines represent the expression levels of the relative expression by qRT-PCR.P value indicate statistical significance of qRT-PCR.
4.Conclusions
With the aim of identifying global candidate genes and pathways related to growth rate in grass carp, whole-transcriptome sequencing was carried out in both fast and slow growing individuals.We identified a large number of differentially expressed genes and pathways for growth difference.The DEGs were enriched for GO terms related to protein synthesis and export machinery, cell division and development and metabolism.KEGG pathway analysis implied that metabolism pathways play a key role in growth performance in fish species.In addition, most of the DEGs in immune response related pathways were upregulated in the slow growing individuals, suggesting that immune responses are negatively associated with growth rates.Our study results provide some valuable resources for understanding the molecular mechanisms of growth traits in fish.Further studies of the association between SNPs in genes and growth rate may help improve growth rate of grass carp, thus greatly benefiting grass carp aquaculture.
The raw sequencing reads have been deposited in the NCBI Short Read Archive under the accession number SRP253161.
CRediT authorship contribution statement
Yubang Shen: Methodology, Writing - original draft, Software.Keyi Ma: Writing - review & editing, Supervision, Visualization.Qin Zhu:Data curation, Software, Validation.Xiaoyan Xu: Investigation, Visualization.Jiale Li: Conceptualization, Methodology.
Declaration of competing interest
The authors declare that they have no competing interests.
Acknowledgments
This work was supported by the Project of Shanghai Engineering and Technology Center for Promoting Ability (19DZ2284300), and the Earmarked Fund for the China Agriculture Research System (CARS-45-03).We thank Mr.Ye Baoqing from TLL for English editing.
Appendix A.Supplementary data
Supplementary data to this article can be found online at https://doi.org/10.1016/j.aaf.2020.09.006.
 Aquaculture and Fisheries2022年6期
- Aquaculture and Fisheries的其它文章
- Transcriptome analysis and candidate gene identification reveals insights into the molecular mechanisms of hypermelanosis in Chinese tongue sole(Cynoglossus semilaevis)
- A chromosome-level genome assembly of the blackspotted croaker(Protonibea diacanthus)
- Effects of low and high levels of nano-selenium on intestinal microbiota of Chinese tongue sole (Cynoglossus semilaevis)
- The digestible phosphorus requirement in practical diet for largemouth bass (Micropterus salmoides) based on growth and feed utilization
- Characterization of refined fish oil from small fish in Mauritania
- Hybrids production as a potential method to control prolific breeding in tilapia and adaptation to aquaculture climate-induced drought