Economics of Road Safety in Asia in View of the 2030 Agenda for Sustainable Development*
2022-02-13 07:08JacWismansFangChen
汽车文摘 2022年2期
Jac Wismans·Fang Chen
(1.SAFETEQ,automotive safety consultancy,Son 5691,The Netherlands;2.Intelligent and Connected Vehicle Development Institute,China FAW Corporation Limited,Changchun 130013)
【Abstract】Road traffic accidents and injuries are a major public health problem and leading cause of death in Asia.In this paper,an overview of UN activities in road safety is given including the role of various UN bodies like WHO,UNECE,UNESCAP and UNCRD.Important global UN milestones with a goal to stabilize and reduce the predicted levels of road traffic fatalities around the world is presented including the Decade of Action for Road Safety 2021—2030,launched 28th Oct 2021,with the target of preventing at least 50% of road death and injuries by 2030.This paper aims,among others:(1)to review the road safety problem in Asia including the economic impact,(2)review the role of the UN and its entities in the field of road safety,including the 2015 Sustainable Development Goals,(3)introduce the basics of economics of road safety,(4)present the cost-benefit of various road safety measures and(5)review the status of road safety measures in Asia.The paper concludes with a number of recommendations,among others,concerning the reliability of valuation of the economic impacts of traffic accidents and the need for further analysis in this field,the need for accurate accident data systems in a country,the most cost effective road safety measures and the importance of safe public transport,future extensions of the proposed dashboard on road safety in Asia,possible updates of the UNESCAP goals in Asia.
Key words:Road safety,Economic impact,Risk factor,Cost benefit analysis
1 Introduction
Road traffic accidents and injuries have been a major public health problem and leading cause of death glob⁃ally.The World Health Organisation(WHO)estimates that in 2013,1.25 million people died worldwide due to road accidents.In 2016,this figure reached 1.35 million,due to the increased number of vehicles on the road,even though the death rate per 100 000 vehicles decreased from 135 in 2010 to 64 in 2016.This means that every day more than 3 700 people die because of road accidents.More than half of all fatalities oc⁃cur in Asiaand the majority(90%)in developing countries.
The yearly number of people that are injured in road accident,frequently resulting in long-term disabilities,is much higher.The WHOestimates that up to 50 million people are injured yearly and a study from the Institute for Health Metrics and Evaluation(IHME)-World Bank results in even much higher estimates:78.2 million per⁃sons needed medical care in 2010 due to a road accident,of which 9.2 million requiring hospital admission.From 2013 to 2017,the number of road traffic death increased in 27 low-income countries,60 middle-income coun⁃tries and 17 high-income countries.At the same time,there are 23 middle-income countries and 25 high-in⁃come countries where the number decreased in this peri⁃od.
Globally,road traffic accidents are the main cause of death among those aged 15-29 years,so this trage⁃dy affects many who are entering their most productive years.Road traffic injuries are currently the 9th leading cause of death across all age groups and this is,as usual scenario,expected to become the seventh leading cause of death by 2030,in particular due to increasing death rates on roads in emerging economies,linked to increas⁃ing urbanization and motorization.
Fig.1 shows the death rate in 2013 for various coun⁃tries and regions in Asia as well as the world divided into various income categories.The high-income countries in the Asia Pacific(Japan,Singapore and Rep.of Korea)show the lowest values,followed by South Asia with a rate more than twice as high and the highest values for China,the Russian Federation and Southeast Asia(ex⁃cluding Singapore).It also includes the world average death rate and the average death rate for low,middle and high-income countries in the world.There is a strong dependency with the income status of a country as shown in Fig 1.In low and middle-income countries in the world,the rate on the average is twice as high as in highincome countries.
Fig.1 Death rate due to road accidents per 100 000 Population in different countries and regions of Asia,together with average values for low,middle-and high-income countries in the world as well as the world average[1]
Comparing regions in the world,Africa has the high⁃est fatality rate of 26.6 Death/100 000 Population.In Europe,the 5 best performing countries have a death rate below 3.1 Death/100 000 Population.
Vulnerable road users(pedestrians,cyclists and mo⁃tor cyclists combined)are particularly at risk in Asia as is shown in Fig.2.This figure shows,for a number of Asian countries,the percentage of pedestrians,cyclists,and riders of motorized 2 and 3-wheelers that were killed in road accidents in 2013.Globally about 50% ofall crash victims are pedestrians,cyclists,and motorcy⁃clists.But as can be seen this percentage is much higher in many of the Asian countries.In 5 of the countries,it is even more than 80%:Lao(80%),Sri Lanka(81%),Singa⁃pore(82%),Thailand(83%)and Cambodia(86%).This is largely due to the high number of fatalities among motor⁃ized 2 and 3-wheelers in these countries.

Fig.2 Death by Road user category in%of total number of road fatalities in several Asian countries(based on data in reference[1])
Road accidents are also a major economic burden for countries.They are estimated to cost$1.85 trillion yearly for the global economy,which is 3%of the GDP.
The objectives of this paper are to:
(1)review the road safety problem in Asia including the economic impact;
(2)introduce the Safe System Approach as the most important strategy to develop measures to reduce the road safety problem;
(3)review the role of the UN and its entities in the field of road safety,including the 2015 Sustainable De⁃velopment Goals;
(4)introduce the basics of economics of road safety and the economic impact of road safety in Asia;
(5)develop recommendations and show examples of the most cost-effective road safety measures;
(6)review the status of road safety measures in Asia.
The methodology used for this study consists of a re⁃view and analyses of data in literature concerning the road safety problem and efforts to reduce the problem in⁃cluding reports form the WHO,World Bank and other in⁃ternational(UN)organizations,review of recent scientific publications,consolidation of methods concerning the economics of road accidents,discussions with experts and review of best practices,cases studies etc.
2 The Safe System Approach
The road safety policy framework which is widely accept⁃ed nowadays for defining accident and injury prevention strategies and used as the framework to define the ac⁃tions by the United Nations discussed in the next section,is the“Safe System Approach”.The Safe System Ap⁃proach has largely replaced the earlier policy framework called the Haddon Matrix developed in 1968,which iden⁃tified 3 phases in a crash:pre-event,event and postevent,as well as 3 components:human(behavior and tol⁃erance),vehicle and infrastructure(environment).This Haddon Matrix approach has led to many successful safe⁃ty improvements within all elements of the Matrix,but the approach is limited in that neither the concept of ex⁃posure nor the importance of interactions between the ele⁃ments of the Matrix are addressed.
In Sweden,the Safe System Approach was called“Vision Zero”and adopted by the Swedish parliament in 1997 as the main road safety strategy.The ultimate tar⁃get of the Vision Zero strategy is to eliminate all fatalities and severe injuries due to road accidents-a very strong ethical statement indicating that in the long run there is little support to balance mobility and safety.Safety should instead be a prerequisite for mobility.
The Safe System Approach is illustrated in Fig.3.Similar concepts were developed in other countries like in the Netherlands,where it was called“Sustainable Safe⁃ty”.It would be out of the scope of this paper to present in detail the concept of the Safe System Approach here,but a few important characteristics are described below.Background information of the Safe System Approach or Sustainable Safety can be found in:[10-13].

Fig.3 Safe System Approach illustrated with some criteria used in Europe[13]
The cornerstone of the Safe System Approach is that instead of trying to adapt the road users to the system,the transport system should be made such that it absorbs hu⁃man errors and mistakes,and that errors and mistakes should not result in fatalities and serious injuries.A safe speed and the biomechanical tolerance of a road user are thus important elements in the system.
The 3 components in the Safe System Approach—human,vehicle and infrastructure are similar as the com⁃ponents used in the Haddon Matrix.For Human,it con⁃cerns safe and responsible behavior,which includes for example that road users to the best of their ability comply with traffic rules and regulations.It includes also ade⁃quately using personal protection systems like helmets.Vehicles should be designed to avoid accidents in case of potential conflicts(crash avoidance technologies)and if an accident happens to protect road users in-and outside the vehicle(crashworthiness of the vehicle,protective equipment like seatbelts and airbags,safe pedestrian fronts etc.).Roads should be designed to minimize the risk of accidents and injuries for all road users,including for example the use of separate lanes for vulnerable road users and public transport,forgiving road infrastructure like guard rails and road barriers and speed measures.
An important principle of the Safe System Approach is that safety is a shared responsibility of governmental and private actors including road authorities,vehicle manufacturers,insurance companies,police etc.and that managing the complex interactions of the elements in the system requires a holistic approach.Another principle is that all parts of the system must be strengthened in com⁃bination with the other parts in the system to reach a bet⁃ter overall safety level and if one part fails,then still the risk of fatalities and serious injuries should be minimal.
Implementation of the Safe System Approach in a country requires a number of elements where the most im⁃portant ones are(see e.g.[14]):
(1)A highly ambitious vision for road safety with commitment on the highest level of government;
(2)Strengthening of the road safety management system including capacity building and knowledge trans⁃fer among the various actors;
(3)A reliable accident data collection system;
(4)Setting of ambitious targets and use of safety per⁃formance indicators to monitor progress to these targets;
(5)Adoption of proven road safety measures for ear⁃ly gains;
(6)Investments in road safety.
3 The Role of The United Nations(UN)In Road Safety
The United Nations has recognized the importance of road safety already soon after its establishment in 1945.In 1950 an Ad Hoc Working Group on the prevention of road accidents was set up within the United Nations Eco⁃nomic Commission for Europe(UNECE).The activities were succeeded by with participants coming from all over the world.The United Nations Economic and Social Commission for Asia and the Pacific(UNESCAP)has al⁃so been working on road safety since 1951.
As a result of the work several international agree⁃ments have been established in the United Nations sys⁃tem in which road safety(in addition to facilitating trade)is an important focus:Many countries across the world have become contracting parties to such agreements and the related legal instruments on vehicle and road safety.
(1)Convention on Road Traffic in 1949;
(2)Convention on Road Traffic(Vienna Conven⁃tion)in 1969;
(3)Agreement on Transport of Dangerous Goods in 1957;
(4)Agreement on Technical Vehicle Regulations in 1958;
(5)Convention on Road Signs and Signals in 1968;
(6)Agreement on Periodic Technical Inspection of Vehicles in 1997;
(7)Agreement on Global Technical Regulations(GTRs)in 1998.
In 2004,the“World report on road traffic injury pre⁃vention”developed by the World Health Organisation(WHO)in cooperation with the World Bank,was launched.This report described the magnitude and im⁃pact of the road traffic injury problem,major causes and risk factors,prevention strategies,the role of the various stake holders in the prevention of road traffic injuries and recommendations on what countries can do to reduce road traffic injuries.The United Nations Road Safety Col⁃laboration(UNRSC)was established to strengthen global activities in road traffic injury prevention.
A breakthrough for international recognition of road injuries as a major public health problem and develop⁃ment challengeswas the declaration of the decade 2011—2020 as the Decade of Action for Road Safety.Based on the Safe System Approach the Commission for Global Road safety defined five pillars for a road safety policy framework,which were used in the Global Plan for the Decade of Action for Road Safety 2011—2020.Table 1 shows these 5 pillars from the Global Plan together with important activities within each pillar.A special em⁃phasis has been put on 5 risk factors:speed,drunk-driv⁃ing,not wearing motorcycle helmets,not wearing seatbelts and not using child restraints in cars.In June 2012,The United Nations Member States agreed to launch a process to develop a set of Sustainable Development Goals(SDG’s)as a replacement for the Millennium De⁃velopment Goals(MDGs)that would expire in 2015.

Table 1 Summary of important actions within the 5 pillars of the Global Plan for the Decade of Action for Road Safety[1]
The United Nations summit for the adoption of the post-2015 development agenda and the United Nations General Assembly adopted“Transforming our World:The 2030 Agenda for Sustainable Development”,which is a new framework for a sustainable development of our world for the period till 2030.In this Agenda 17 universal goals and 169 targets are defined,which focus on various global issues such as poverty and environmen⁃tal issues.
Progress in a number of the SDG’s is strongly relat⁃ed and dependent on advances in sustainable transport,safe and efficient transport to schools,safe and accessi⁃ble transport for disabled and elderly people are the im⁃portant parts in SDG’s(See Table 2).

Table 2 Road Safety goals and targets in the SDG’s[22]
These goals are a strong mandate for action to pro⁃mote road safety.In particular,the ambitious target for 50% reductions of both road crash fatalities and injuries is a significant challenge to all governments and other stakeholders worldwide.In the meantime,it became clear that this SDG goal 3.6 Death/100 000 Population isfar from realistic,considering the trends in road fatalities worldwide.Therefore,at the Third Global Ministerial Conference on Road Safety in Stockholm(19-20 Febru⁃ary 2020)this Goal was changed to reach 50% reduction in deaths and injuries in 2030(instead of 2020).Based on this new target the Global plan for the Decade of Ac⁃tion for Road Safety 2021—2030 was launched 28 Oct 2021.The actions in this new Global plan for Road Safety are,like in the earlier Plan,based on the Safe Sys⁃tem Approach using 5 pillars,where the first pillar called“multimodal transport and land-use planning”replaces the pillar“road safety management”in the earlier plan.
A global initiative linked to the UN road safety ac⁃tivities was the Brasilia Declaration on Road Safety ad⁃opted in Nov 2015.The declaration consists of 30 ac⁃tions organised in 7 groups of which 5 groups are equiva⁃lent to the 5 pillars of the Global Plan 2011—2020(see Table 11)and 2 separate groups,one of them dealing spe⁃cifically with vulnerable road users(which include chil⁃dren,youth,older and disabled persons,gender issues and motorcyclists)and one on strengthening cooperation and global road safety coordination.Most actions in the Declaration are largely a recommitment and/or strength⁃ening of the actions included in the Global Plan 2011—2020.New or partially new actions in the Declaration in⁃clude:
(1)New risk factors which lead to distracted or im⁃paired driving due to medicines,narcotic or psychotic drugs,distraction by cell phones and other causes.
(2)Introduction of new technologies in traffic man⁃agement and intelligent transport systems to mitigate road traffic crash risk and maximize response efficiency.
(3)Actively protect and promote pedestrian safety and cycling mobility,such as pedestrian walkways and bi⁃cycle lanes and/or tracks,adequate lighting,speed camer⁃as,road signs,etc.
(4)Introduction of legislation and policies on motor⁃cycles,including training,driver licensing,vehicle regis⁃tration,work conditions,and the use of helmets and per⁃sonal protection equipment by motorcyclists.
(5)Development,under coordination of the WHO of detailed national,regional,and global targets and indica⁃tors to reduce road traffic crashes and fatalities in view of the SDG targets.
Detailed road safety targets exist already for many years at national and regional levels.For example,Swe⁃den introduced a target of 50% reduction in fatalities be⁃tween 1996 and 2007,together with several sub-targets like reducing travel speeds and increasing seat belt use.In the 2011 White Paper—“Roadmap to a Single Europe⁃an Transport Area”,the EU aimed at a further reduction of 50% of road fatalities from 2011 until 2020 and for 2050 to move close to zero fatalities.This target of 50% reduction by 2020 is far from being reached as can been seen in Fig.4.

Fig.4 Aggregate evolution in the number of road deaths in IRTAD countries(without USA)[26]
This section will conclude with some road safety ini⁃tiatives in Asia by the UN organisations UNCRD(United Nations Centre for Regional Development)and UNES⁃CAP(United Nations United Economic and Social Com⁃mission for Asia and the Pacific).
The UNCRD EST(Environmentally Sustainable Transport)Initiative,adopted in 2010 the Bangkok 2020 Declaration,in which twenty sustainable Transport Goals for 2010-2020 were defined.Goal 13 specifically dealt with road safety:“.The suc⁃cessor of the Bangkok declaration is the Aichi 2030 Dec⁃laration—Making Transport in Asia Sustainable(2021-2030)adopted Oct.202021.The core of the Declara⁃tion are 6 goals of which one(Goal 2)specifically deals with Road Safety.Goal 2 is(based on SDG 3.6,the UN Decade of Action on Road Safety 2021—2030,and the Stockholm Declaration on Road Safety):
In Asia and the Pacific UNESCAP has played a cen⁃tral role in the coordination road safety initiatives.A Declaration on Improving Road Safety formed the start of the development of goals,targets and indicators by UNESCAP member countries in 2006.The declara⁃tion included the general goal“”.It resulted in 8 goals with corre⁃sponding targets and indicators for monitoring achieve⁃ments:
Goal 1:Making road safety a policy priority;
Goal 2:Making roads safer for vulnerable road us⁃ers,including children,elderly people,pedestrians,nonmotorized vehicle users,motorcyclists and persons with disabilities;
Goal 3:Making roads safer and reducing the severi⁃ty of road crashes(“self-explaining”and“forgiving roads”);
Goal 4:Making vehicles safer and encouraging re⁃sponsible vehicle advertising;
Goal 5:Improving national and regional road safety systems,management and enforcement;
Goal 6:Improving cooperation and fostering partner⁃ships;
Goal 7:Developing the Asian Highway network as a model of road safety;
Goal 8:Providing effective education on road safety awareness to the public,young people and drivers.
The goals,targets and indicators were further re⁃fined and updated at different occasions since then,among others to align with the targets and indicators of the Decade of Action for Road Safety 2011—2020 and the SDG’s.The latest update resulted from the“Region⁃al Meeting on Renewing Regional Road Safety Goals,Tar⁃gets and Indicator for Asia and the Pacific”,held on 28—29 July 2016,Seoul,Republic of Korea and adopted in the Third Session of the Ministerial Conference on Trans⁃port organised by UNESCAP in Moscow,5—9 Dec 2016.In line with the SDG target 3.6,as overall objective was defined:“50% reduction in fatalities and serious in⁃juries on the roads of Asia and the Pacific over the period 2011 to 2020”.Note that the reference year here is 2011,where for SDG 3.6 this is assumed to be 2015.So the tar⁃get for Asia and the Pacific,although still very ambitious,has been set slightly less ambitious than the SDG global target.
Next to the 8 goals,30 underlying targets were de⁃fined as well as 40 indicators to monitor the progress on the goals and targets.Examples of indicators are reduc⁃tion in fatalities and serious injuries in total,per 100 000 habitants and for specific road user groups,adoption of regulations,implementation and enforcement of laws con⁃cerning risk factors(like helmets,speed etc.),infrastruc⁃ture improvements like separate pedestrian and cycle tracks and information on national road safety plans and their implementation.The status for a number of these in⁃dicators will be summarized in section 7.
4 Economics of Road Safety
The aim of this section is to provide insight in the rele⁃vance of the economics of road safety and more specifical⁃ly how investments in road safety will contribute to the road safety targets to halve the number of global deaths and injuries from road traffic accidents.
The main question to be discussed is what the eco⁃nomic impact is of road safety investments and which types of measures are the most cost-effective ones to be able to set priorities for policy makers(evidence-based policy making).For this purpose,a brief overview of methods for the valuation of the economic costs of road safety will be presented(see below),based on a review of various methods available.These costs consist of directcosts like medical,administration and property damage,and indirect,less tangible,costs due to loss of production and income of someone injured or killed in an accident as well as immaterial costs like suffering,pain,and loss of quality of life,further referred here to as Human costs.
4.1 Human Capital(HC)Method
Within the HC method(sometimes also referred to as Gross Output method)estimates are made for all cost cat⁃egories related to road accidents.In international guide⁃lines dealing with the costs of road accidents five main cost categories can be distinguished(see for ex⁃ample).Table 3 shows an overview of these catego⁃ries,with a brief description of each cost category accord⁃ing to the SWOV.For the computation of costs a mone⁃tary value must be put on each component based on the available data in a country and,if data are not available,assumptions have to be introduced to make estimates for these components.Table 3 includes an overview of poten⁃tial data sources to determine the costs within each cate⁃gory based on TRL guidelines.

Table 3 5 main road safety cost categories[32-33]
Medical and administrative costs:This will of⁃ten be the first and most tangible economic burden expe⁃rienced by a traffic accident victim.In some cases,the medical treatment may continue over many years ahead,in the worst cases over the whole lifetime,and therefore it is necessary to estimate the present value of future medical treatments.This value is rather straight forward to estimate if good records on hospital and medical costs exists.
Production loss:3 types of production losses can be distinguished:due to premature death,due to reduced working capacity and due to days of illness.To calcu⁃late the loss of production,estimates for the working time lost and on future wages have to be available.The amount of working time lost for a fatal casualty is the time the crash victim could have spent working in the fu⁃ture,and it is measured from the time of death to the age of retirement.For seriously and slightly injured casual⁃ties,it is the amount of working time lost someone would have spent working if they had not been disabled,or whilst recovering in hospital or at home.In addition,for the calculation of production loss,estimates are need⁃ed on future wages.National income statistics have been the traditional source for such estimates as well as some⁃times casualty reviews.
Calculation of production loss is done in a similar way in all countries.However,important differences can occur,like that some countries also put a value on domes⁃tic work and that various assumptions regarding the growth of incomes are used.Some countries correct the production loss for expected future consumption:gross production loss is the production loss including the value of future consumption and net production loss without fu⁃ture consumption.
Human costs:deals with immaterial costs like suffer⁃ing,pain,sorrow,and loss of life or of quality of life,The amount to add to reflect pain grief and suffering with⁃in the HC method is essentially a political decision and the greater the amount added,the higher the value soci⁃ety would place upon the prevention of crashes.
An earlier TRL(Transport Research Laboratory in the United Kingdom)studycontained recommenda⁃tions to add the following values for“pain,grief and suf⁃fering”:
(1)28%of total costs for a fatal crash;
(2)50%of total costs for a serious crash;
(3)8%of total costs for a slight crash;
(4)0%of total costs for a damage only crash.
Several countries,also in Asia,where the HC meth⁃od has been used have adopted these recommended val⁃ues or equivalent values in their calculations.
4.2 Willingness-To-Pay Method(WTP)
A major objection against the HC method described above is that most people do not value their life primarily for their output to the society(economic impact),but be⁃cause it has intrinsic value to them and their relatives.This value,often referred to as the Value of Statistical Life(VSL),can be estimated by determining the amount of money that people are willing to pay to reduce the risk of being killed in an accident.The VSL is estimated by the WTP method,which has been adopted in many highincome countries in the meantime,replacing the HC method.A huge literature on methodology and Meta stud⁃ies exists today concluding that although the WTP meth⁃odology is not flawless,it is more suitable than the alter⁃natives.
Various WTP methods have been developed,where the 2 most important ones are the Revealed Preference(RP)and the Stated Preference(SP)method.RP methods value risk reductions based on actual behavior,for exam⁃ple on how much money is spent on safety provisions,while in SP methods people are asked how much they are willing to pay for safety provisions.The cost estimates resulting from the WTP approach are usually(much)higher than those resulting from the HC approach.
The WTP method can also be applied to determine the value for a person not being fatally injured in an acci⁃dent indicated as Value of Statistical injury(VSI).There are few estimates of the value of reducing the risk of nonfatal accidents in High Income Countries(HIC’s).As nonfatal accidents become relatively more important,as mortality risk reduces,it is necessary to improve the understanding of the benefit of a reduction in nonfatal ac⁃cidents.It is well known that commonly used definitions such as severe and light injury hide a broad variation in valuation.The wide-ranging variation makes a single value questionable and targeted study for all possible out⁃comes of nonfatal states impossible.
4.3 iRAP“Rule of Thumb”Method
The WTP method is costly and requires sophisticated sur⁃vey techniques,due to which adoption of the WTP meth⁃odology in developing countries may be less viable.Therefore,iRAP investigated an alternative approach based on results from available WTP and HC studies from a range of countries.The basic assumption in the method is that the income in a country(GDP)is the pri⁃mary determining factor for the VSL.From the avail⁃able VSL data collected from the involved countries,ra⁃tios of VSL to GDP per capita were calculated.Table 4 shows the VSL/GDP ratio for Asian EST countries pres⁃ent in the iRAP database,including the year for which the ratio was calculated and the method used(HC or WTP).For most of these countries the HC method was used,where for the estimation of human costs a value was added based on the TRL percentages mentioned in above.
Table 4 Values for VSL/GDP ratios/capita in some of the Asian EST countries including year for which the calculation was made calculation method(HC=Human Capital and WTP=Willingnessto-Pay)[44].
Table 5 Total cost per casualty(price level 2012 in US$)for fatalities,serious injuries,minor injuries and damage only casualties(based on analysis of ADB data by SWOV[32]) US$/Casualty
Similar calculations were carried out for several high-income countries showing that HIC countries tend to have higher VSL/GDP ratios than Low and Middle In⁃come Countries(LMIC’s).Also countries using the WTP method(more represented within the HIC group of coun⁃tries)showed larger ratios than countries using the HC Capital method.The iRAP study concluded that as a“rule-of-thumb”method a ratio of 70 can be used for all countries to make an estimate for the VSL as function of GDP per capita.This value of 70 is slightly below the Ma⁃laysia WTP based value of 76 but higher than most of the other ratios found for Asian EST countries.For a more de⁃tailed discussion on the relationship between VSL and GDP and differences between LMIC’s and HIC’s and de⁃pendency on methodology used to determine the human costs,interested readers are referred to[42,32].
For the valuation of serious injuries(VSI for serious injuries being hospitalized)similar calculations were car⁃ried out by iRAP based on data available for a few HIC’s and this resulted in a recommended VSI/GDP-per-capi⁃ta ratio of 17,so about 25% of the VSL value.It was not⁃ed in the iRAP study that this VSI estimation is less ro⁃bust that the VSL estimation since it is derived from much less data.Note that these iRAP ratios are just for the VSL and VSI components in the costs and do not count for the net production loss,property damage costs etc.
If the number of serious injuries is not known in a country,iRAP proposes to use a ratio of 10 serious inju⁃ries for each fatality,based on different data sources.For less severe and minor injuries iRAP has made no“ruleof-thumb”estimates for the VSI.
5 Costs of Road Accidents in Asia
A large study concerning the costs of road accidentsthe ADB-ASEAN Regional Road Safety Project in Asia-was carried out by the Asian Development Bank(ADB)in the Southeast Asian countries.In this study,domestic consultants recruited by ADB carried out an ac⁃cident costing exercise for each country using the HC method and using guidelines from TRL to estimate the human cost component.One exception was Malaysia that already had adopted the WTP approach.Wijnen and Stip⁃donk from SWOVmade an analysis of the ADB data to⁃gether with data from other sources from HIC’s.They showed that in the Asian LMIC’s property damage has the largest share(39% average)in the total costs,fol⁃lowed by production loss and then human costs,but with large variations between the several countries.It was not⁃ed in the analysis that the number of crashes with only property damage is uncertain because of(very)incom⁃plete crash reporting.The estimation for human costs(40% average)in HIC’s are about twice as high as in LMIC’s(18% average),which was partly explained by the more frequent use of the WTP method in HIC’s than in LMIC’s.
5.1 Costs Per Casualty
The costs per casualty based on the ADB data for resp.a fatal crash,a crash with a serious injury,a casualty with a minor injury and a damage only crash is shown in Ta⁃ble 5.Large variations in costs between various countries can be seen and in particular in the costs for a fatal casu⁃alty.For example,the costs in Thailand are a factor 10 higher than in Cambodia and even a factor 25 higher than in Lao PDR.
5.2 GDP Loss Data Due to Road Accidents
At the 2014 Regional EST forum Wismans et.al.,[8]pre⁃sented estimates for the accident costs expressed as a per⁃centage of GDP loss in the year 2013 in various Asian countries.These estimates were based on the following steps and assumptions:
(1)Number of fatalities in 2010 based on the aver⁃age of the number of fatalities reported in the 2013 Glob⁃al Status report and the IHME/World Bank 2014 report;
(2)Serious injury estimates in 2010 based on the IHME/World Bank 2014 reportand defined as injuries requiring hospital admission;
(3)Costs of minor injuries,property damage,medi⁃cal costs,administration costs and production loss due to injuries were neglected;
(4)For human costs,the iRAP“rule of thumb”of 70×GDP/capita for fatalities and 17×GDP/capita for seri⁃ous injuries was adopted and calculated for the year 2010(2014 US$values).
(5)Gross production loss for fatalities was calculated as described in[8]and corrected for future consumption loss since future consumption loss is also part of the hu⁃man costs as calculated according to the iRAP method.The resulting net production loss was small(about 0.1%GDP loss)and therefore neglected.Therefore,the costs re⁃ported in the 2014 studywere the VSL and VSI esti⁃mates.
The resulting GDP losses(total and % of GDP)for the Asian EST countries are shown in Table 6 together with the GDP loss data(%)from the 2015 Global Status reportand the estimates resulting from the ADB data.Most of the WHO estimates were based on national stud⁃ies in the various countries and for different years.The WHO Global status report does not describe how these GDP losses were achieved(like using HC vs WTP,which data were used for fatalities and injuries etc.)and wheth⁃er all cost categories and all type of casualties(fatal up to property damage only)have been considered.

Table 6 Estimated costs of road accidents in Asian countries based on different studies
The total resulting costs of road accidents in 2010 is 735 Billion US$.A division over various countries and regions in Asia is shown in Fig.5.Almost halve of the costs occur in China followed by the high-income coun⁃tries in the Asia Pacific(Japan,Rep.of Korea and Singa⁃pore)and South Asia(which includes India).Fig.6 shows the loss due to road accidents in 2010 as a percent⁃age of GDP in various countries and regions in Asia with the lowest values(<2%)in the high-income countries and the highest(>4%)in South Asia.The average per⁃centage GDP loss in the Asian EST region is 3.3 %(Ta⁃ble 6).

Fig.5 Distribution of estimated costs road accidents in 2010 over various countries and regions in Asia

Fig.6 GDP loss in percentage due to road accidents in 2010 in various countries and regions(unweighted in%)in Asia.
The results from Wismans,et al.for the percent⁃age of GDP loss due to road accidents is for most coun⁃tries higher than the ADB and WHO percentages of GDP loss estimates.This is largely due to the different methodology that have been used,i.e.the rule of thumb iRAP approach which may lead to higher estimates for the human costs,as well as the use of more accurate in⁃jury estimates than in other studies.These injury esti⁃mates are based on the IHME/World Bank data that be⁃came available in 2014.Note that on the other hand,these estimates are also conservative since they ex⁃clude major cost components like the property damage costs,the costs of minor injuries,medical costs and ad⁃ministrative costs.
6 Cost Benefit of Road-Safety Measures
Decades of research have created a huge amount of scien⁃tific knowledge on the costs and benefit of various traffic safety measures.As an example,an overview of the bene⁃fit to cost ratios of a selection of road safety measures in Norway is given in Table 7.Examples are shown from the field of road design,vehicle safety,enforcement,and user behavior.Many of the road safety measures included in the Table 7 show a high benefit-cost ratio.This over⁃view is based on work done in Norway as described among others in the Handbook of Road Safety Measures,in which the results of a systematic search of the liter⁃ature on traffic safety by means of a meta-analysis is summarized.The meta-analysis approach is a statistical methodology that combines the results of multiple scien⁃tific studies,in order to minimize the contribution of sub⁃jective factors,which are often included in traditional lit⁃erature surveys.
Table 7 Examples of Benefit-Cost ratios of road safety measures in Norway[47]
Many of the cost benefit studies have been carried out in Europe and the US which may limit however the applicability to other parts of the world.The latest ver⁃sion of the above-mentioned handbook in English is from 2009(printed version only).The handbook contains mea⁃sures within all 5 pillars of road safety including,policy instruments,road design and maintenance,traffic con⁃trol,vehicle design and protective devices,vehicle in⁃spections,driver requirements and training,education,enforcement and first aid.For each measure problems and objectives are described as well as description of the measure,effect on accidents,mobility and environment and finally,where available,cost and a cost-benefit anal⁃ysis.
6.1 Speed and Speed Enforcement
Speed has been identified as a key risk factor in road traf⁃fic injuries,influencing both the risk of a road crash as well as the severity of the injuries that result from crash⁃es.Increased speed reduces safety margins as the driver needs a greater distance before he reacts to a hazard,and because the error margins are smaller.To ensure a prop⁃er tradeoff between speed and safety,speed limits are al⁃most universally applied.
Change of speed limits affects traffic safety by affect⁃ing the average speed,which in turn affects the number of accidents and injured and killed persons.Many stud⁃ies have investigated the relationship between actual ve⁃hicle speed and certain accident types.Fig.7 illus⁃trates the global cumulative relationship between vehicle impact speed and fatality risk for different collision types(all car occupants are belted):pedestrians impacted by a vehicle front,side impact collisions and frontal impacts(car-car or against a hard object).The larger the speed the higher the fatality risk and above a certain impactspeed the risk of being killed approximates 100%.Car oc⁃cupants are much better protected for the same impact speed than pedestrians and in frontal impacts car occu⁃pants can withstand higher impacts speeds than in side impacts.
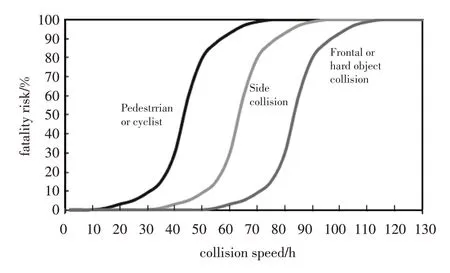
Fig.7 Relationship between impact vehicle speed and fatality risk for different collision types(car occupants are all belted)[51]
The“optimal”speed limit,from an economic point of view,can be calculated as the balance between in⁃creased travel time and reduced accident and environ⁃mental costs.Although such calculations are made,real speed limits are often set(much)higher than what would be optimal.To ensure speed limits,enforcement is neces⁃sary.Doubling the level of speed enforcement has a bene⁃fit-cost ratio of almost 6.The experience in France has shown that increasing speed enforcement is very effective in the reduction of fatalities and injuries.
6.2 Safe Roads
iRAP developed a business case for the amount of invest⁃ments needed in road infrastructure,in order to improve the 10%highest risk roads in the world to a 3 star or high⁃er level(on a scale from 1~5,where 5 is highest).The proposed investments in road infrastructure of al⁃most 681 billion US$worldwide(which is less than 1%of global yearly GDP)would result in a saving of more than 3.6 million fatalities in 20 years.The return on in⁃vestment(Benefit-Cost ratio)was estimated 8 on a global level and even higher(11)in LMIC’s,see Table 8.In oth⁃er words in LMIC’s for every dollar invested in road safe⁃ty infrastructure there would be a return of investment of 11 dollars in 20 years,due to a reduction in trauma and economic costs.The benefit estimates for fatalities and serious injuries were based on the iRAP“Rule of the Thumb”method presented in earlier section.

Table 8 The business case for investments in safer roads[10,54]
6.3 Helmets
It is well documented that the use of a helmet on motor⁃cycles reduces the risk of serious head injuries.A me⁃ta-analysis from 2008 by Liu et al.summarized 61 studies from 1977—2006 and the results are fairly con⁃sistent between studies.In overall,the motorcycle hel⁃met reduces the risk of being killed with 42% and the risk of head injuries with 69%.A study from Taiwan showed that a helmet use reduces the risk of being killed with 74%.
Helmets do not affect travel speed or environment.The reduction in accident risk is thus only weighted against the cost of a helmet.Elvik et al.showed that the benefits of using the helmet on the moped and motor⁃cycle is far greater than the costs,with a benefit-cost ra⁃tio of about 17.There is no reason to believe that the hel⁃met has become less cost-beneficial over time.
In spite of the effectiveness of a helmet,the nonuse of a helmet is still a problem.A study in Lao found that the main reasons for not using a helmet were be⁃cause the motorcyclist did not like how adult helmets feel or made them look.In another study in Iran reported that,physical discomfort(which can include heat related issue)was the main reason for not using a helmet.Therefore,comfort must be taken on-board by helmets manufacturers to help increase the helmets use.
The Asia Injury Prevention(AIP)Foundation has initiated a two-year program“Head Safe Helmet On”(HSHO)aiming to increase motorcycle passenger helmet use in six target districts in Cambodia from an average of 10% in 2014(baseline)to 60% in 2016.The program included among others a primary school-based program with free helmets,a behavior change campaign in mass media and improved enforcement of the passenger hel⁃met law.The costs of this program were 1.1 million US$.Fig.8 depicts the calculated avoided accident costs over the period of the program as a function of the helmet use of motorcycle passengers.The“total cost avoided”includes all elements:medical,administrative,property damage,production loss and human costs.In the“eco⁃nomic cost avoided”,human costs is excluded.For the in⁃tervention to have higher benefits than costs(breakeven point)the helmet use must increase above 37% in case the human costs are included and 48%if the human costsare excluded.With a target result of 60% helmet use the measure has significant higher benefits than costs.
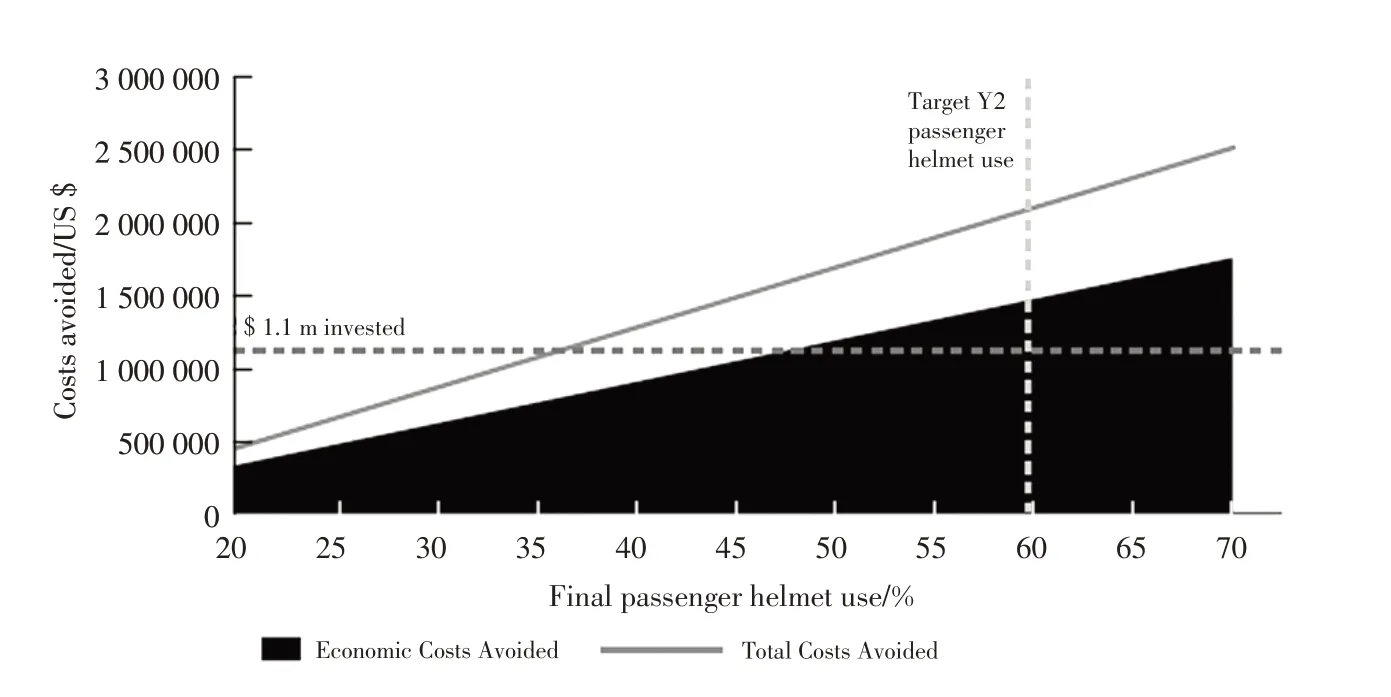
Fig.8 Investments costs of the HSHO motorcycle passenger helmet program versus avoided costs due to reduced fatalities and serious injuries as a function of actual helmet usage[60]
6.4 Public Transport
Examples in literature of well documented cost benefit studies of investments in public transport where safety investments and benefits are included in the analyses(next to environmental impact,improved mobility,so⁃cial etc.)are difficult to find.Studies carried out by EMBARQ in Brasil suggest that audit costs as such are less than 1% of the cost of a project and have a bene⁃fit-cost ratio of 10.EMBARQ also conducted road safety audits of several existing bus rapid transit corri⁃dors in Brazil including the BRT Transcarioca in Rio de Janeiro,where a high number of 50 injury crashes per ki⁃lometer annually were reported.The costs of these crash⁃es were estimated about US$12.5 million per year.The audit projected a reduction in crashes of 30% per year representing US$3.75 million saved.
Since safe public transport is much safer per km travelled then other forms of private motorized and nonmotorized transport,the effect of mode shifts from less safe to safer forms of transport should be taken into ac⁃count in the analyses,which most likely would show addi⁃tional safety benefits of investments in high quality pub⁃lic transport.Therefore,it is highly recommended to take a systems approach(city level or higher)and to consider these and other dynamic effects to secure an overall posi⁃tive outcome of a shift towards public transport.Informa⁃tion on methodologies to quantify the environment,social and economic benefit of bus rapid transit systems is avail⁃able by Binoy Mascarenhas of EMBARQ India.
6.5 Work-Related Road Accidents
Work-related road accidents include professional trans⁃port,driving during work hours(for example,truck,bus and van drivers as well as sales people),and workers on the road(for instance road maintenance crews).Work-related road accidents represent up to one third of all road casualties and even 50%if commuting to work is included.That’s why many companies nowadays are promoting policies and practices to improve the safety of their workers when driv⁃ing for work.The importance of this is also expressed in SDG 12“ensure sustainable consumption and produc⁃tion patterns”by the targets 12.6 and 12.7:
Encourage companies,especially large and transna⁃tional companies,to adopt sustainable practices and to inte⁃gratesustainabilityinformationintotheirreportingcycle.
Promote public procurement practices that are sus⁃tainable,in accordance with national policies and priori⁃ties.
The European project PRAISE(Preventing Road Accidents and Injuries for the Safety of Employees)aims to promote best practice in order to help employers se⁃cure high road safety standards for their employees.In the reportit describes the Work-Related Road Risk Management(WRRRM)program and shows that the ben⁃efit for companies who implement this program can be larger than the costs of implementation.Other benefits like increasing efficiency of the management,competi⁃tive advantage and fulfilling legal compliance obligations are also addressed.The report covers a list of possible costs and the importance of introducing measures to re⁃duce them.A number of examples from several compa⁃nies are included which could also apply to Asian coun⁃tries.In the report the International Standard Organiza⁃tion(ISO)standard 39001 for road traffic safety manage⁃mentis promoted as a framework for reviewing and de⁃veloping a continuous improvement process for road safe⁃ty in an organization(see Fig.9)

Fig.9 Benefits associated with the implementation of the ISO 39001 road safety management system[65]
6.6 ITS systems
Several of the benefit-cost ratios introduced in Table 7 relate to ITS applications(e-Call,feedback signs for speeds,intelligent speed adaption etc.)and all show that the benefits exceed the costs.But these benefit-cost ra⁃tios are determined for European conditions and may not apply to Asia.A literature study in Chinaanalyzed sev⁃eral(mostly European)reports on cost/benefit for Vehi⁃cle-to-Vehicle(V2V),Vehicle-to-Infrastructure(V2I)and C-ITS.The C-ITS systems with highest safety bene⁃fit were found to be those that warn drivers of excessive speed and services that provide warnings on the road ahead.The authors however also note that other,non-CITS,measures may be more effective,such as enforce⁃ment.
7 Status of Road Safety Measures in Asia
The total costs of fatalities and serious injuries in Asia in 2010 was estimated to 735 billion US$or 3.3% of GDP(Table 6).When the SDG target 3.6 would have been reached,the burden on the economy would be reduced with more than 350 billion US$per year,or equivalent to a growth in GDP of more than 1.5%.Such targets are extremely ambitious and hard to reach.But on the other hand examples for some individual countries in Europe have shown that significant improvements are possible in a short period,where in particular,strategies adapting best practices from other,better performing,countries have shown to be very successful.
The Global Status reports of the WHO contain a wealth of data on the introduction of road safety measures for many countries in the world,including most of the Asian countries.On the basis of the data presented in the Global Status report on Road Safety,in 2015[1]a Dash⁃board of road safety measures was developed in[68].This Dashboard focused on the road safety indicators ad⁃opted by UNESCAP(see section 3).They concern gener⁃al data on road safety management,infrastructure,promo⁃tion of Non Motorized transport(NMT),introduction of UNECE regulations in the country,availability of emer⁃gency access numbers and data on the risk factors:speed,drunk-driving,not wearing motorcycle helmets,not wearing seat-belts,not using child restraints in cars and mobile phone use during driving.Most data in the Dashboard represent the status in 2013.
Some observations from the Dashboard:
(1)All countries appear to have a designated lead agency on road safety.Most countries have a national road safety strategy(except Afghanistan,Pakistan,Mal⁃dives and Sri Lanka)and many of the countries with a na⁃tional road safety strategy have introduced targets for fa⁃tality reduction like,for example,a 50% fatality reduc⁃tion by 2020(Bangladesh,Cambodia,Indonesia,Malay⁃sia,Mongolia and Philippines).
(2)Formal audits for new road construction projects are carried out in 19 of the 24 Asian countries included in the Dashboard and regular inspections of existing road infrastructure in 14 countries.
(3)Policies to promote walking or cycling on a na⁃tional level exist in 8 countries,but policies to separate road users and protect Vulnerable Road Users(VRUs)in only 6 countries,although in some countries they may ex⁃ist on a sub-national level.
(4)For 3 UNECE vehicle safety regulations,resp.on Frontal Impact protection,Electronic Stability Control(ESC)and Pedestrian protection,information is included in the dashboard.3 countries(Japan,Russia,and Rep.of Korea)have accepted all these regulations.China had ad⁃opted in 2003 the Frontal Impact protection standard,Thailand the Pedestrian protection standard and Malay⁃sia both the Frontal Impact and Pedestrian protection standard.Note that the UNECE requirements are mini⁃mum requirements and usually less demanding than re⁃quirements in New Car Assessment Programs(NCAP),like the various NCAP programs introduced in Asia.
(5)In most countries an Emergency access tele⁃phone number has been introduced,but the numbers are different in each country and in some countries also mul⁃tiple numbers are used.
(6)Most Asian countries have introduced helmet laws for motorcycles.For helmet laws to be effective they should:apply for both drivers and passengers(not the case for Cambodia and Maldives in 2013)),require that helmets be worn in all traffic and weather conditions and apply for all engine types,and specify that helmets need to be always fastened,which is not the case in 13 of the countries,require helmets to meet an adequate helmet standard like ECE 22,which is not the case in 7 coun⁃tries.Without an adequate standard,the risk of using a helmet without sufficient protection increases.
(7)The wearing rate for helmets is available for half of the countries and appears to be high(75% and more wearing rate)in Indonesia(drivers),Malaysia(all),Philip⁃pines(drivers),Rep.of Korea,and Vietnam(all).The en⁃forcement level is also included in the Dashboard and countries will a high enforcement level show usually high wearing rates and countries with a low enforcement level(Mongolia and Pakistan)very low wearing rates.
(8)Child restraint systems for cars are required in only 7 countries and the usage rate and enforcement lev⁃el is very low in all countries except for Japan.All coun⁃tries have a national seatbelt law except for Afghanistan,Bangladesh,and Myanmar,but in only 10 countries this law applies to both front and back seats.
(9)Drunk-driving laws exist in all countries except Maldives(where alcohol consumption is legally prohibit⁃ed).Most countries have specified Blood Alcohol Content(BAC)limits,usually 0.05 or 0.08 g/dl but also some⁃times lower like 0.02 in China.In countries where alco⁃hol consumption is legally prohibited like Afghanistan,Pakistan,Bangladesh no BAC limits are specified.Also in Indonesia and Nepal no BAC limits are specified.In most countries with BAC levels random breath testing is carried out.Some countries have specified lower BAC numbers for novice drivers(not included in the dash⁃board).Some countries show high enforcement levels for drunk-driving including Brunei,China,Japan,Rep.of Korea and Singapore and others having very low enforce⁃ment levels,including countries with BAC limits(Lao,Philippines)and without BAC limits(Mongolia Afghani⁃stan,Pakistan,Bangladesh).
(10)High speed is the most important risk factor.All countries have national maximum speed laws(in In⁃dia on a sub-national level).A distinction is made be⁃tween roads in urban areas,in rural areas and high⁃ways.Some countries have national speed limits for roads only in one or two of these areas.In urban areas national speed limits vary from 30 km/h up to a very high level of 80 or 90 km/h.In rural areas speed of more than 110 km/h are seen.The effectiveness of en⁃forcement of speed laws was rated high(7 or higher)in Rep.of Korea,China,Nepal,Japan,Russia and Singa⁃pore and low(3 or below)in Afghanistan,Bangladesh,In⁃dia,Mongolia and Thailand.
8 Concluding Remarks
In 2016 about 1.35 million people died worldwide due to road accidents of which more than 50% in Asia.In Asia the death rate is 6.7 Death/100 000 Population,in the high-income countries and 19.7 the in South-East Asia,so almost 3 times higher.The death rate in South-East Asia is 13% above the world average rate and 26% less than the death rate in Africa.Vulnerable road users(VRU:pedestrians,cyclists and motor cyclists combined)are particular at risk in the Asian EST countries.Global⁃ly the number of VRU is about 50%,but in most Asian EST countries this is more than 60%and in five countries(Lao,Sri Lanka,Singapore,Thailand and Cambodia)it is even more than 80%,which is largely due to the high number of fatalities among motorized 2 and 3-wheelers in these countries.
The road safety policy framework“Safe System Ap⁃proach”,summarized in this paper,is widely accepted nowadays for defining accident and injury prevention.The cornerstone of the Safe System Approach is that in⁃stead of trying to adapt the road users to the system,thetransport system should be made such that it absorbs hu⁃man errors and mistakes,and that errors and mistakes should not result in fatalities and serious injuries.A safe speed and the biomechanical tolerance of a road user are important elements in the system.
An overview of the work done by the United Nations in the field of road safety was presented in this paper,in⁃cluding various Conventions,the first one on Road Traf⁃fic,already in 1949 and the Agreements on Periodic Technical Inspection of Vehicles in 1997 and on Global Technical Regulations(GTRs)in 1998.In 2011 the Unit⁃ed Nations(UN)published the first Global Plan for the Decade of Action for Road Safety(2011-2020)with a goal to stabilize and reduce the predicted levels of road traffic fatalities around the world and in 2021 the 2Global Plan(2021-2030)aiming to deliver a 50% reduc⁃tion in deaths and injuries in 2030.The 50% reduction target was already included as a Sub goal in 2015 within the Sustainable Development Goals(SDGs),however,with the target year much sooner:2020.
The principles behind the valuation of the economic impact of traffic accidents and estimates for the cost of road accidents in Asia are presented.These costs consist of direct costs and indirect.3 methods have been intro⁃duced to determine the costs of road accidents:the Hu⁃man Capital(HC),Willingness-To-Pay(WTP)and iRap method.The WTP method is recommended by econo⁃mists nowadays to deal with such“human”costs and the related Value of Statistical Life(VSL).The difficulties to estimate the VSL have been discussed.
Based on the iRAP method the costs of road acci⁃dents in Asia have been calculated for the year 2010 and expressed as total costs for a country and as a percentage of GDP and compared with data from other sources It is shown that road safety has a major impact on economies of Asian countries.The total resulting cost estimate for road accidents in Asia is 735 Billion US$of which al⁃most half in China.The average % GDP loss in Asia is 3.3% with the highest value(>4%)for the South Asia re⁃gion.
Various examples of the cost-benefit of various road safety measures have been presented including on speed control,infrastructure,vehicle regulations,enforcement,road user behavior,helmet wearing,use of public trans⁃port,work related road accidents and ITS applications.These examples are helpful to prioritize governmental budgets.It should be realized however that many of the cost benefit studies have been carried out in Europe and the US,which may limit the applicability to other parts of the world.
The implementation of quantified road safety targets and the use of performance indicators to measure the progress against these targets are crucial in any effective road safety program.In Asia for the year 2010 the total costs of fatalities and serious injuries in Asia was estimat⁃ed to 735 billion US$or 3,3% of GDP.When the SDG target 3.6 would have been reached,the burden on the economy would have bene reduced with more than 350 billion US$per year,or equivalent to a growth in GDP of more than 1,5%.A brief overview of the status of a number of road safety measures in Asia is has been pre⁃sented based on the information in WHO Global road safety reports and taking performance indicators from the UNESCAP“Regional Road Safety Goals,Targets and In⁃dicators for Asia and the Pacific 2016-2020”,as the ba⁃sis.This overview showed that in many countries in Asia the actions proposed in the WHO Decade of Action plans are not met yet.
One possible future road safety measure which has not been addressed in our study is the impact of future Connected and Automated Transportation(CAT)and Au⁃tomated Vehicles(AV).Single systems assisting the driv⁃er in a specific situation(e.g.adaptive cruise controls)are commercially available,while fully automated vehi⁃cles,where traditional steering wheels or driver controls may be obsolete,are still in development and require more research and development to reach maturity.It is widely expected that CAT has a potential to contribute to increase the safety and efficiency of the transport system.Removing the human element from vehicle operation may have benefits in lowering crash rates and severity since a part of accidents caused by human error may be prevented.
Despite the numerous activities and discussions around CAT and AV the practical impact will not be no⁃ticeable until sufficient portions of the vehicle fleet andthe infra-structure are equipped with the associated tech⁃nologies and intelligent transport systems respectively.Even if the price of automation technologies decreases over time,the cost level may still be a barrier for a signifi⁃cant penetration for quite some time.In a thought exer⁃cise,using India as an example of low and middle-in⁃come countries,Mohan suggested that autonomous vehi⁃cles may not have big impacts directly in India,in terms of replacing private vehicles use in the near future.It can be questioned whether in high density urban areas in Asia with a strong mix with NMT,introduction of AV’s replacing private cars ever will become practical,except for specific kinds of public transport as discussed by Mo⁃han.
This paper concludes with the following recommen⁃dations:
(1)In order to get reliable estimates for the costs of road accidents it is recommended to take into account all cost components in a country so both the direct costs(medical,property damage and administrative costs)and indirect costs(production loss and human costs).For the human costs the use of the Willingness To Pay(WTP)ap⁃proach is the recommended method resulting in the Val⁃ue of Statistical Life(VSL).If VSL data are not available in a country or cannot be determined it is recommended,to use the iRAP method which estimated the benefit for each fatality and serious injury that can be saved due to a measure,based on a fixed multiplication factor on the country’s GDP/capita.If in a country VSL estimates from existing studies in environmental,health and trans⁃port policy are available it is recommended to consider the use of a procedure developed by OECD to transfer the data for road safety analyses(see[71]).
(2)Our estimates for the % of GDP loss due to road accidents results for most Asian countries in higher esti⁃mates than the data available in the WHO 2015 global status report.The difference would even become larger if also the direct cost components(medical,property dam⁃age and administrative)would have been considered in our estimates.It is recommended that a further analysis of these differences is carried out,which may lead to rec⁃ommendations for a global harmonization of the methodol⁃ogy to be used for the valuation of the economic impact of traffic accidents.
(3)For reliable impact assessment of measures and priority setting,accurate reliable accident data concern⁃ing the number of casualties and the causes of the acci⁃dents in a country are needed.Such accident data sys⁃tems are also needed for monitoring the progress of the ef⁃fect of measures.The establishment recently of the Asia Pacific Road Safety Observatory(APRSO)as the regional forum on road safety data,policies and practices is very welcomed in this respect(see[72]).
(4)In this paper a number of examples have been given of measures with a high benefit to cost ratio.Mea⁃sures with high benefit to cost ratio’s,include the 5 risk factors identified in the Plan for the Decade of Action 2011-2020(safe speed,drunk-driving,not wearing mo⁃torcycle helmets,not wearing seat-belts and not using child restraints in cars).Measures concerning these risk factors can often be introduced quite fast and relatively easily and do not require extensive cost-benefit analyses.It is recommended to implement laws concerning such risk factors in each country(if not done yet)and intro⁃duce and maintain a strict enforcement policy concerning such measures.Also other measures in the field of infra⁃structure,safe vehicles and post-crash care show high cost to benefit ratios and therefore should be considered.
(5)Most of the people killed in accidents in low and middle-income countries are pedestrians and cyclists mixing with motorized transport,while walking or cycling along the road and when crossing roads.An iRAP study presented that more than 90% of serious injuries and fa⁃talities among pedestrians walking along the road can be prevented by highly cost-effective infrastructure mea⁃sures.So,investments in this area are strongly recom⁃mended.If such measures cannot simply be implemented in existing infrastructures,where vulnerable road users mix with motorized transport,strict speed measures with speeds below 30 km/h should be introduced.
(6)It is recommended that in the stage of road net⁃work and public transport planning road safety is consid⁃ered from the beginning and therefore in any cost benefit analysis,next to mobility and environmental aspects,the costs and benefit of road safety should be included in the analysis.
(7)Since safe public transport is much safer per km travelled then other forms of private motorized and nonmotorized transport,it is recommended that the effect of mode shifts from less safe to safer forms of transport are considered in cost benefit analyses of new public trans⁃port systems.
(8)It is recommended to perform detailed analyses of accidents in Asia.Such analyses may reveal that also other road safety measures are needed than what so far have been addressed in the Plan for the Decade of Action and the UNESCAP targets and indicators.An example is most likely the safety of trucks in accidents with other road users(like compatibility issues and limited truck driver vision due to blind spots),which was shown in Eu⁃rope to represent a significant problem.
(9)Most of the cost-benefit data presented in this paper are based on studies in high-income countries and in particular based on data in Europe.It is recommended to take care with the use of such data in other regions and in particular in low-and middle-income countries,since corrections may be needed to use them in quite different environments or new cost benefit studies may have to be carried out in the country.
(10)ITS applications have high potential to im⁃prove road safety,but reliable cost benefit studies are limited up to know for Asia.It is highly recommended to perform such studies,as well as considering a higher de⁃gree of these new technologies when planning physical and digital infrastructures.Note that ITS applications on their own are not a solution for the road safety problem.ITS implementation has to be accompanied by better road infrastructure,better drivers,better enforcement of traffic laws,safer vehicles fulfilling adequate safety stan⁃dards etc.
9 Acknowledgments
The study that formed the basis for this paper was pre⁃sented at the 10th Regional EST Forum in Asia,14—16 March 2017,Vientiane,Lao PDR and was funded by the United Nations Centre for Regional Development(UN⁃CRD).The authors wholeheartedly acknowledge the fol⁃lowing persons for their contribution to this work:Ingrid Skogsmo,Selpi Sepi,Marie Thynell,Gunnar Lindberg,Anna Nilsson-Ehle,and Anders Lie.
Prof.Dr.Jac Wismans In 2008 Prof.Dr.Jac Wismans founded SAFETEQ,a consult⁃ing company in automotive safety in the Netherlands,after more than 30 years’experience in several R&D and management po⁃sitions at TNO in the Netherlands and as visiting Professor in vehicle safety at the Eindhoven University of Technology,he was also a guest professor at Chalmers University.
Pro.Dr.Fang Chen
Professor Fang Chen’s main research area includes cognitive science,interactive design and human-machine interaction,with theoretical background involving physiology,behavioral psychology,visual and auditory interaction.Her researches were widely applied in multimedia system usability,automatic control,aviation and automobile driving control,public safety and crisis management which adopted by the EU as the basis for the formulation of relevant standards for transportation and vehicles.As the expert in interaction design,she serving as a member and consultant to several international academic re⁃search institutions and enterprises like Huawei and FAW,pub⁃lished hundreds of papers in international journals and confer⁃ences.