
Mining favorable alleles for five agronomic traits from the elite rapeseed cultivar Zhongshuang 11 by QTL mapping and integration
2021-12-10 12:23:56XinmingZhouLihongDiPengfeiWngYingLiuZhoqiXieHiynZhngQingXinLiliWnLiyongYngGungshengYngDengfengHong
The Crop Journal 2021年6期
Xinming Zhou,Lihong Di,Pengfei Wng,Ying Liu,Zhoqi Xie,Hiyn Zhng,Qing Xin,Lili Wn,Liyong Yng,Gungsheng Yng,Dengfeng Hong,*
a National Key Laboratory of Crop Genetic Improvement,Huazhong Agricultural University,Wuhan 430070,Hubei,China
b Institute of Crops,Wuhan Academy of Agricultural Sciences,Wuhan 430065,Hubei,China
c Shanghai Academy of Agricultural Sciences,Shanghai 201403,China
Keywords:
A B S T R A C T Zhongshuang 11(ZS11)is an elite inbred rapeseed(Brassica napus L.)cultivar widely planted in the Yangtze River basin for its favorable characteristics including high seed oil content(SOC),low seed glucosinolate content(SGC),long siliques,and stable yield.To transfer the ideal traits from ZS11 into 195-14A,a Polima(pol)-type cytoplasmic male sterile line with high general combining ability,a doubled haploid population derived from the cross of ZS11 and 195-14A was developed.Based on this population,a high-density genetic linkage map covering 2553 cM with an average marker interval of 0.81 cM,was constructed using the Brassica 60K SNP array and simple sequence repeats.In seven environments,64,29,35,37,and 33 QTL were identified for silique length,seeds per silique,seed density per silique,SOC,and SGC,respectively.Most favorable alleles were from ZS11.Seventy-one consensus QTL were identified by a QTL meta-analysis,eight of which(cqSL–A9–2,cqSL–C7,cqSGC–C2,cqSOC–A5–2,cqSOC–A5–3,cqSPS–A6–2,cqSPS–A7–2,and cqSDPS–A9–2)were assigned as major QTL.Comparative genomics and expression analysis predicted 72 candidate genes underlying the 21 consensus QTL for the five traits.These findings suggest the genetic basis of the superior performance of ZS11 and suggest favorable alleles for development of cultivars with improved yield and quality.These results will assist in cloning these promising alleles in the future.
1.Introduction
Rapeseed(Brassica napusL.,AACC,2n=38)is the second largest growing oil crop in the world,and rapeseed oil is one of the favored vegetable oils in China[1].Over the past few decades,improving seed yield has remained the most important target for rapeseed breeders.However,because rapeseed is used mainly to produce edible oil and animal protein feed,improvement of seed quality,including total seed oil content(SOC)and seed glucosinolate content(SGC),has also gained increasing attention in breeding programs.
Rapeseed yield depends on three factors:silique number per plant(SN),seed number per silique(SPS)and thousand-seed weight(TSW)[2].The silique is both the primary source organ for photosynthetic products and an important sink organ for carbohydrates in the late stage of seed maturity[3].Altering silique traits will lead either directly or indirectly to yield variation.For this reason,breeders must always consider silique traits,including SPS,silique length(SL),and seed density per silique(SDPS).Because negative correlations are usually observed among silique traits owing to the genetic trade-off between competing demands,it is especially important to balance these traits in rapeseed breeding[4].
For seed oil production,an increase in SOC of 1% is considered equivalent to a 2.3%–2.5%increase in rapeseed yield[5].Glucosinolate(GSL)is a secondary sulfur-containing metabolite peculiar to cruciferous crops and present mainly in the reproductive organs[6].Although the presence of GSL has no adverse effects on the crops themselves,high intake of GSL,and its subsequent degradation products,can damage the liver,kidney,and thyroid of animals[7],greatly limiting the wide use of cake meals as an animal protein feed.Accordingly,an increase in SOC and a reduction of SGC have been two major directions for improvement in rapeseed quality.
Most rapeseed agronomic traits are complex quantitative traits controlled by multiple genes and readily influenced by the environment,including silique and seed-quality traits.In addition to genome-wide association analysis based on linkage disequilibrium,quantitative trait locus(QTL)mapping is an effective method for dissecting complex traits[8].The availability of high-quality genetic maps determines the efficiency and accuracy of QTL detection[9].In early years,owing to the limited availability of DNA markers,restriction fragment length polymorphisms,amplified fragment length polymorphisms,and simple sequence repeats(SSRs)were widely used in genetic linkage map construction[2,3,10–12].In recent years,with the rapid development of nextgeneration sequencing technology,high-quality genetic maps based on single-nucleotide polymorphism(SNP)markers,which have the advantages of high throughput,low cost,high resolution,and greater QTL detection ability,have been used for mapping many agronomic traits in rapeseed,such as plant height,flowering time,seed yield,oil content,and silique traits[1,13–17].
QTL controlling SL,SPS,and TSW are distributed on almost all chromosomes,though major QTL have been found mainly on chromosomes A3,A6,A7,A9,and C9[3,12,18–20].Only a few candidate genes underlying these QTL have been validated and characterized.Two genes,BnaA.ARF18.aandBnaA9.CYP78A9,located on chromosome A9 and simultaneously controlling SL and TSW,were cloned by map-based cloning[21,22].A major QTL for SPS,qSS.C9,was fine-mapped and further characterized[23,24].There has been little research on SDPS,which is the ratio of SL to SPS.For seedquality traits,many QTL for SOC have been localized on all rapeseed chromosomes[5,25–29];however,none have been cloned because most QTL associated with SOC make minor genetic contributions and SOC is highly sensitive to environmental conditions(temperature,rainfall,and light)[30].As for SGC,it is generally accepted that the variation in this trait is controlled by a few major and many minor QTL.Four major loci on A02,C02,A09,and C09 are considered the main determinants of SGC variation[6].Although the synthesis and metabolic pathways of glucosinolates inA.thalianahave been well studied,and genes associated with these pathways are considered candidate genes for SGC QTL,few have been confirmed in rapeseed.Identifying more QTL or genes associated with silique and seed-quality traits is expected to accelerate rapeseed yield and quality improvement.
ZS11 is a semi-winter,inbred cultivar registered in 2008.It has displayed a series of excellent characters,including extra-high SOC(generally≥49%)and extremely low SGC,strong resistance to lodging underSclerotinia sclerotioruminfection and to pod shattering,including long and thick siliques,unusually high TSW,and stable yield.Consequently,ZS11 is widely accepted not only by farmers,but also by rapeseed breeders who use it as a source for favorable alleles for seed yield and quality in hybridization or heterosis breeding.With the release of a high-quality genome reference map for ZS11[31,32],its breeding potential has increased because of its high value in constructing diverse populations for QTL identification and cloning or marker-assisted breeding.
Here,to identify the potential favorable alleles in ZS11,we developed a double haploid(DH)population from a cross of ZS11 and 195-14A.We performed QTL analysis of the three siliquerelated traits(SL,SPS,and SDPS)and two seed quality traits(SOC and SGC)and evaluate the potentials of promising alleles in improving our elite parental line 195-14A.These results lay a solid foundation for further gene cloning and reveal the genetic mechanism underlying the five agronomic traits,and the QTL information provided here will be useful for improving yield and seed quality in rapeseed.
2.Materials and methods
2.1.Plant materials
Two semi-winter,B.napusinbred lines,ZS11 and 195-14A,were used as parents.ZS11 was provided by the Oil Crops Research Institute,Chinese Academy of Agricultural Science,whereas 195-14A,a temperature-sensitive,Polima CMS line,which has been successfully used as the maternal line of several commercial hybrids,was bred by Huazhong Agricultural University.Clear differences in SL and SDPS were observed in 195-14A and ZS11.A DH population consisting of 135 lines was developed from the F1cross between ZS11 and 195-14A by microspore culture.
2.2.Field experiment and trait measurement
The 135 DH lines together with their parental lines(ZS11 and 195-14A)were sown in the field at four locations;Wuhan,Jiangling,and Ezhou in Hubei province,and Zhangye in Gansu province,during the growing seasons of 2013–2014,2014–2015,and 2015–2016.All the lines were grown in experimental fields in a randomized complete block design with two replications of two rows per plot,consisting of 24 plants.Twelve plants were grown in each row,with 20 cm between plants and 25 cm between rows.Seven natural environments,named 13WH(Wuhan,2013–2014),14ZY(Zhangye,2014),14JL(Jiangling,2014–2015),14WH-1(Wuhan,2014–2015),14WH-2(Wuhan,2014–2015),15WH(Wuhan,2015–2016),and 15EZ(Ezhou,2015–2016),were included in the trials.In Wuhan in 2014,trial 14WH-1 was prepared with a high and trial 14WH-2 with a low soil fertility level.The seeds were sown in semi-winter rapeseed growing areas,including Wuhan,Jiangling,and Ezhou in October,and in the spring rapeseed growing area,Zhangye,in May.Field management followed standard agricultural practice.
The DH lines and their parental lines were open-pollinated to ensure fertilization.For SL and SPS measurements,10 plants selected from each DH line and parental line were used for analysis at the mature stage.Ten siliques,selected following Zhang et al.[12],were harvested from each plant.SL and SPS were estimated as the means of the 10 siliques for each line.For seed oil and glucosinolate content measurement of each plant,seeds were harvested for near-infrared reflectance spectroscopy.SOC and SGC were estimated as means of 10 well-developed plants randomly selected from each genotype,with the exception of those grown at the edge of the field.
2.3.Construction of genetic linkage map
Genomic DNA of parental and DH lines was extracted from young leaf tissue by the modified CTAB method[33].SSR and SNP markers were used to genotype the parents and DH lines.The markers used in this study with prefixes SSR were obtained from Zhang et al.[12],but other SSR markers were designed using the SSRHunter v1.3[34].Polymorphic loci revealed by the same SSR marker were distinguished by a letter following the marker name.All SNP markers were derived from the Illumina 60K SNP array[35].SNP array data were then clustered and visualized for further analysis using Genome Studio software(Illumina Inc.,San Diego,CA).Each SNP was rechecked manually to avoid errors during clustering.SNPs with any of the following conditions were discarded:SNP with no polymorphism between the parents,high heterozygous proportion(>5%),low minor allele frequency(MAF<0.01),and high amounts of missing data(>20%).The remaining 266 SSR and 2884 SNP markers were used to construct a genetic linkage map using MSTmap software[36].All the loci were handled by MSTmap,and they were grouped at a 6.0 logarithm of the odds(LOD)threshold.The order of the map was checked manually to ensure optimal placement of all loci.Genetic distances were calculated from recombination fractions with the Kosambi mapping function[37].
2.4.Data analysis and QTL mapping
Phenotypic differences between the two parents were estimated using Student’st-tests.Basic statistical analysis was performed using SPSS 18.0 software(SPSS Inc.,Chicago,IL,USA).Phenotypic correlation coefficients among the five traits were calculated using the CORR procedure in SAS(SAS Institute Inc.,Cary,NC,USA).Broad-sense heritability was calculatedwhereis genetic variance,is the variance of the interaction between genotype and environmentis error variance,nis the number of environments,andris the number of replicates.
QTL analyses for all traits were performed by composite interval mapping(CIM)using Windows QTL Cartographer V2.5(https://brcwebportal.cos.ncsu.edu/qtlcart/WQTLCart.htm). The LOD threshold for detection of significant QTL was first determined by permutation analysis with 1000 repetitions based on a 5%experiment wise error rate[38].The walking speed was set to 1 cM.However,because this threshold rejected some QTL that had been identified in other studies,a less stringent LOD threshold of 2.5 was adopted.QTL detected at an LOD≥2.5 were considered identified QTL.To avoid false-positive QTL due to the less-stringent LOD threshold,all of the identified QTL obtained in different environments were integrated into consensus QTL by a QTL metaanalysis using BioMercator 4.2[39].These consensus QTL were divided into two groups:major QTL consisting ofR2≥20%,orR2≥10% in two or more environments,and the rest of the QTL,considered to be minor.During QTL meta-analysis,first QTL for the same trait detected in different environments were integrated and then consensus QTL with overlapping confidence intervals(CIs)for different traits were further integrated into the unique QTL.
2.5.Identification of candidate genes and analysis of their expression patterns
All the sequences of annotated genes from the candidate regions were downloaded from theB.napusreference genomes,Darmorbzh(http://www.genoscope.cns.fr/brassicanapus/)or ZS11(http://cbi.hzau.edu.cn/bnapus/index.php)and were aligned against the genome sequence ofArabidopsisby local BLAST analysis.Genes fromB.napuswith highest sequence similarity to genes inArabidopsiswere assigned as orthologous genes.Then,theArabidopsisgenes annotated as associated with silique or seed-quality traits were retrieved.Finally,theirB.napushomologs within the CIs of target QTL were assigned as putative candidate genes for the QTL.
Expression data for candidate genes were retrieved from theBrassicaExpression Database(BrassicaEDB;https://biodb.swu.edu.cn/brassica/).The expression levels in 10 major tissues were used to identify the expression patterns of the candidate genes.A heat map was constructed using the R package(https://CRAN.Rproject.org/),based on the normalized expression values of candidate genes.
2.6.QTL integration
To integrate QTL in the present and previous studies,QTL information on rapeseed published in recent decades was collected,including information for five traits(SPS,SL,SDPS,SOC,and SGC),mapping populations,the sizes of populations,QTL names,QTL positions on chromosomes,and the information of markers associated with QTL.Sequences of the flanking markers for each QTL were then aligned to the reference genome of Darmor-bzhto define a physical interval.When the sequences of flanking markers were unknown,a region of 1 Mb centered on a marker near the QTL peak was taken as the physical interval,following Raboanatahiry et al.[40].QTL were defined as overlapping if their physical intervals overlapped with those of QTL identified in previous studies.
3.Results
3.1.Phenotypic variation of the parents and DH lines
ZS11 showed higher phenotypic values for SL and SOC,but lower phenotypic values for SPS,SDPS,and SGC,than 195-14A(Table 1;Fig.1).Among the DH population,the frequency distributions of the four traits(SL,SPS,SDPS,and SOC)approached normality in the seven environments(Table 1;Fig.S1),suggesting a polygenic inheritance pattern.However,SGC showed a bimodal distribution around the value 28.00 μmol g-1(Fig.S1C),suggesting that the SGC variation was determined by a few major loci in the population.A wide range of genetic variation for all traits was observed,and many DH lines showed phenotypic values outside the parental lines.
The heritability and phenotypic correlations of the five traits in the DH population are summarized in Table S1.A significant negative correlation was observed between SL and SDPS(-0.77),but SPS was significantly and positively correlated with SDPS(0.62).SL and SPS were positively correlated with SOC.There was no significant correlation between SL and SPS,although correlation was observed in previous studies[12,17].The broad-sense heritability(h2)of SL,SPS,SDPS,and SGC showed high values of 94.4%,86.1%,96.4%,and 94.1%,respectively,indicating that they were stable and environmentally insensitive.SOC had a lowerh2value of 73.6%,suggesting that it was relatively sensitive to environmental conditions.
3.2.High-density genetic linkage map construction
The 266 SSR markers polymorphic between the parental lines were unevenly distributed across the 19 linkage groups with marker numbers varying from 5 to 31 and a low mean marker density(Table S2).To increase the marker density,a commercial 60K SNP array containing 52,157 SNP loci was used.After filtering,2884 SNP markers polymorphic between the two parents were assigned to chromosomes(Figs.2,S2).On this map,the numbers of markers in different linkage groups ranged from 51 to 341 and the length of these linkage groups varied from 55.8 to 249 cM.Markers on each linkage group showed high consistency between their genetic and physical locations(Fig.S3).The final map covered 2553 cM with a mean marker interval of 0.81 cM.
3.3.QTL mapping for SL,SPS,SDPS,SOC,and SGC
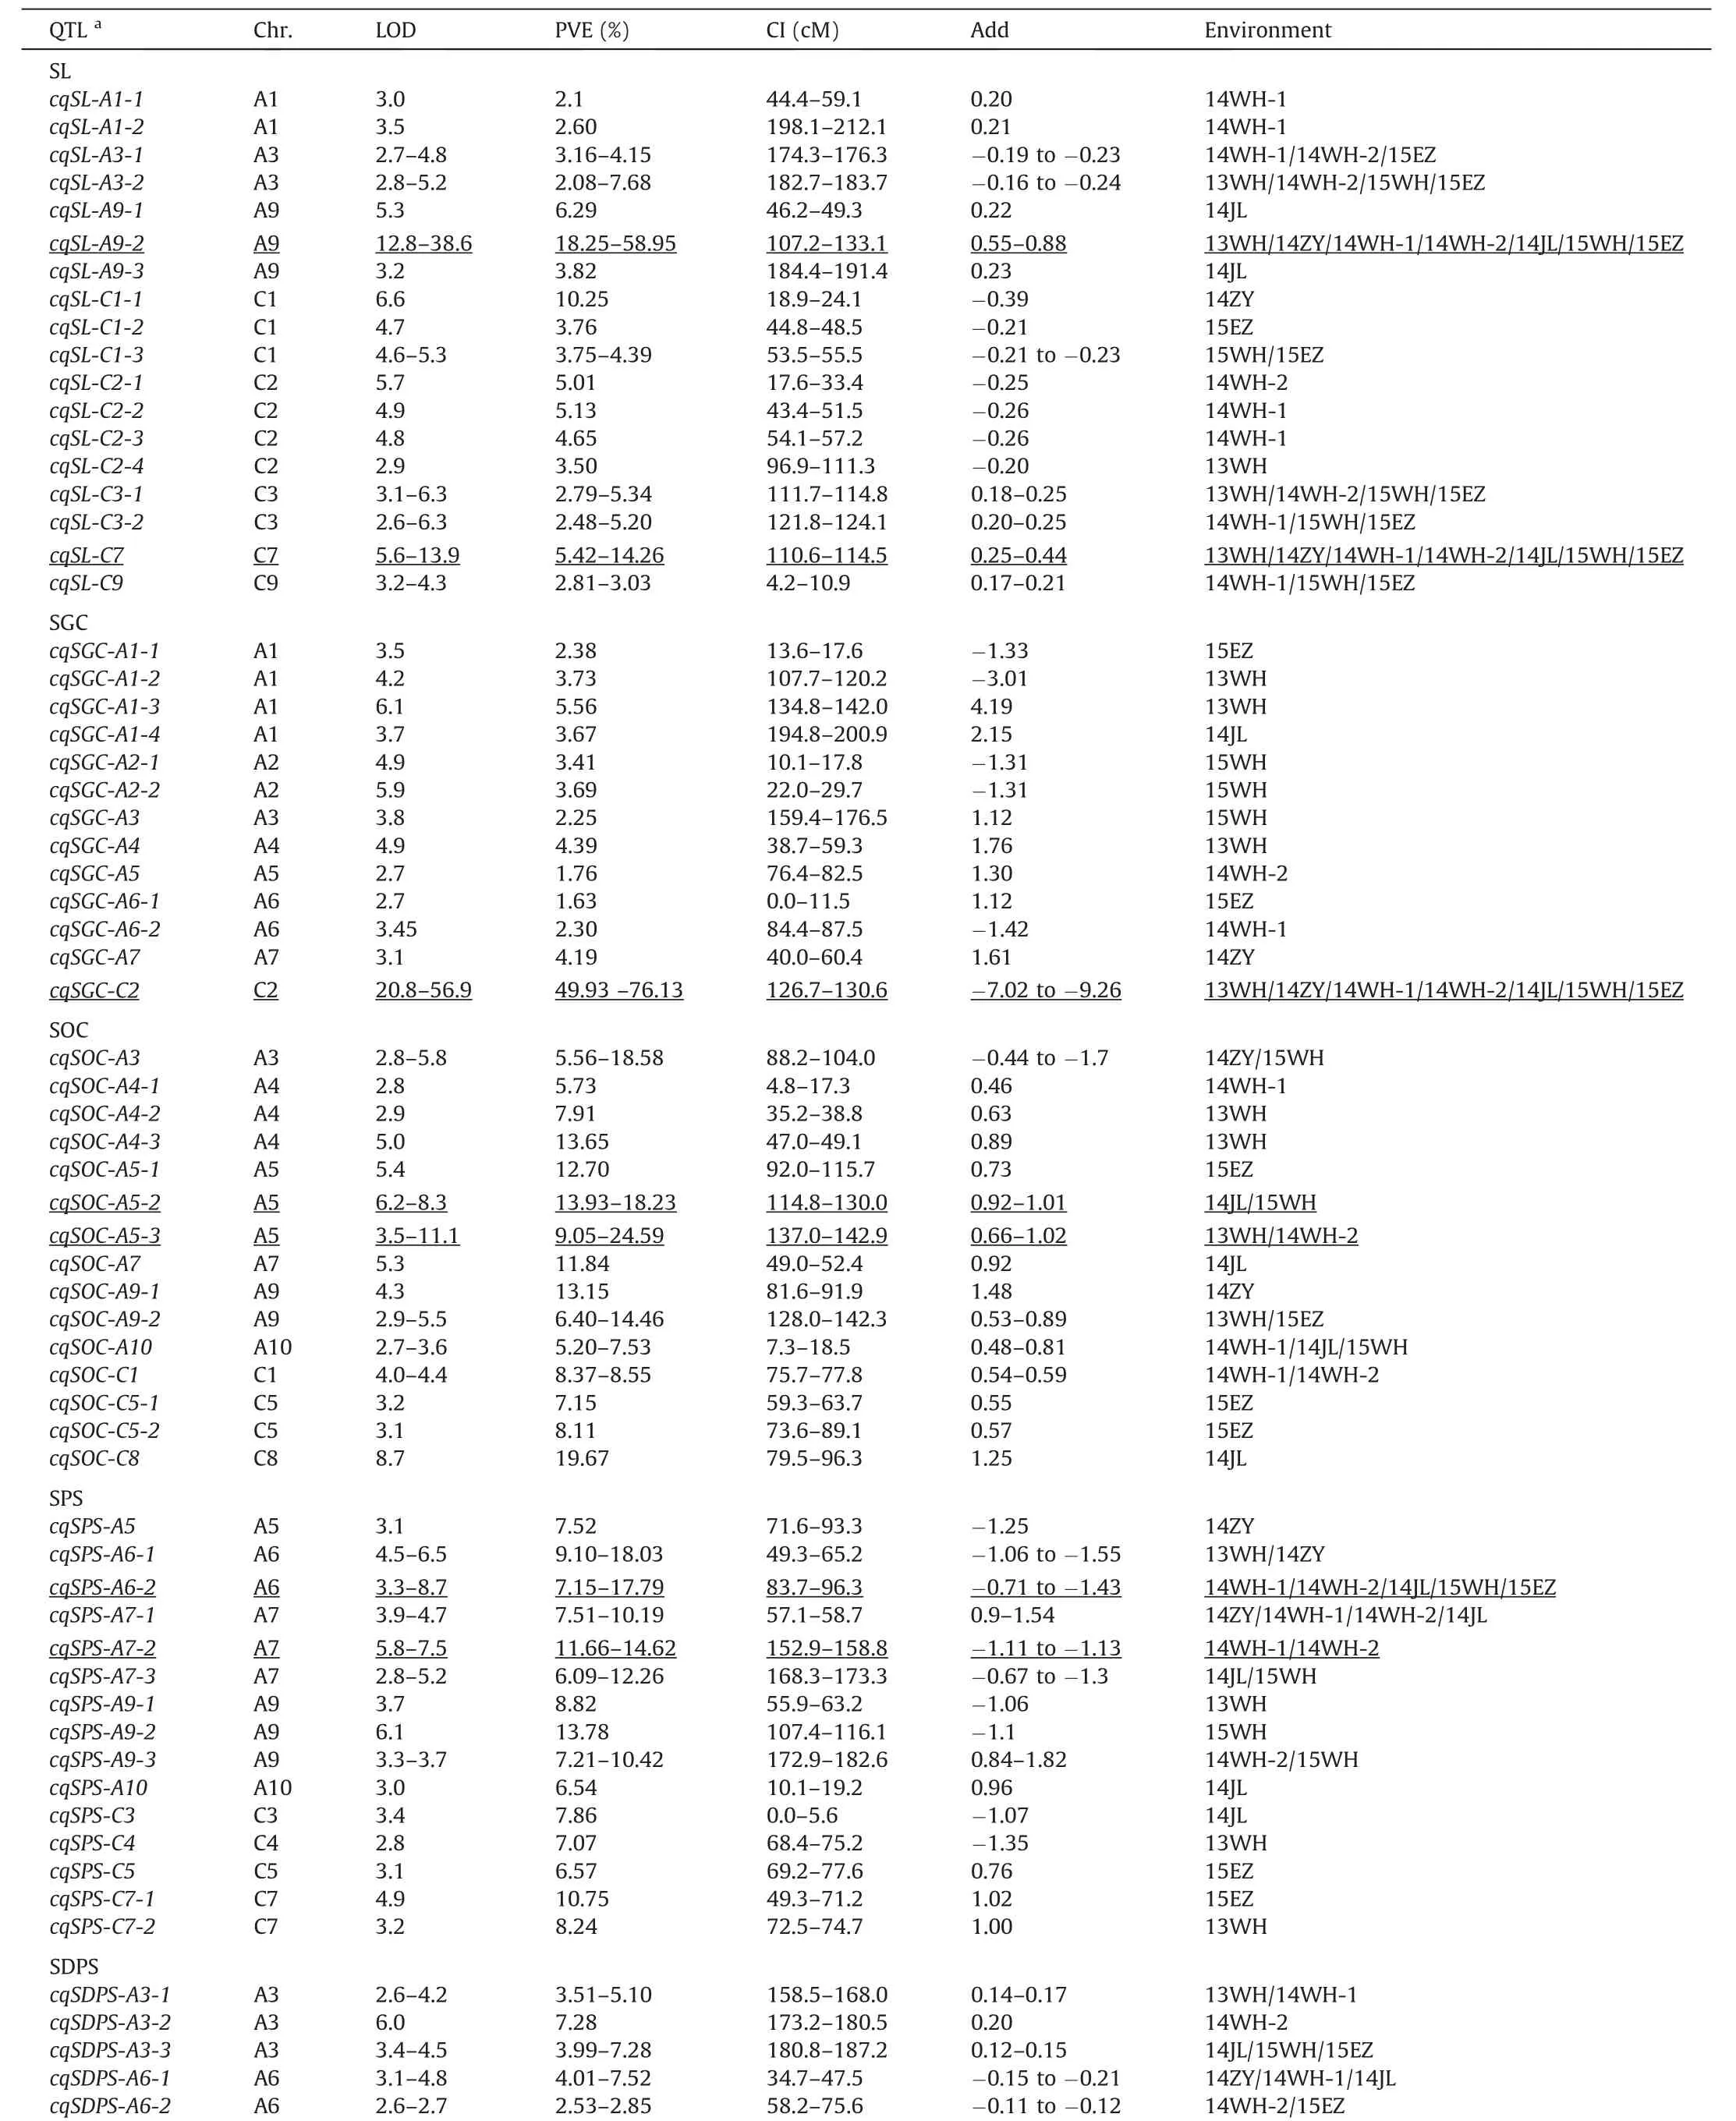
The QTL analysis for SL,SPS,SDPS,SOC,and SGC identified 198 QTL on all chromosomes but A8 and C6(Fig.3F;Table S3).Almost one-third of these were associated with SL,and QTL located on chromosome A9 accounted for the largest proportion(Fig.S4;Table S4).The identified QTL were integrated into 71 consensus QTL,including 18,13,15,15,and 10 for SL,SGC,SOC,SPS,and SDPS,respectively(Table 2).At least one major consensus QTL was detected for each trait.
For SL,64 QTL were detected,with phenotypic variation explained(PVE)ranging from 1.90% to 58.95%(Fig.3A;Table S3).Twenty-one QTL,accounting for the largest proportion of SL QTL,were identified on chromosome A9 and the rest on chromosomes A1,A3,C1,C2,C3,C7,and C9.Among these QTL,qSL-A9.6bshowed the largest PVE of 58.95%and the highest LOD value of 38.55.These QTL were integrated into 18 consensus QTL.Two consensus QTL,cqSL-A9-2andcqSL-C7,were detected in all seven environments,with PVE ranging from 18.25% to 58.95% and 5.42% to 14.26%,respectively,and were assigned as major QTL(Fig.3A;Table 2).
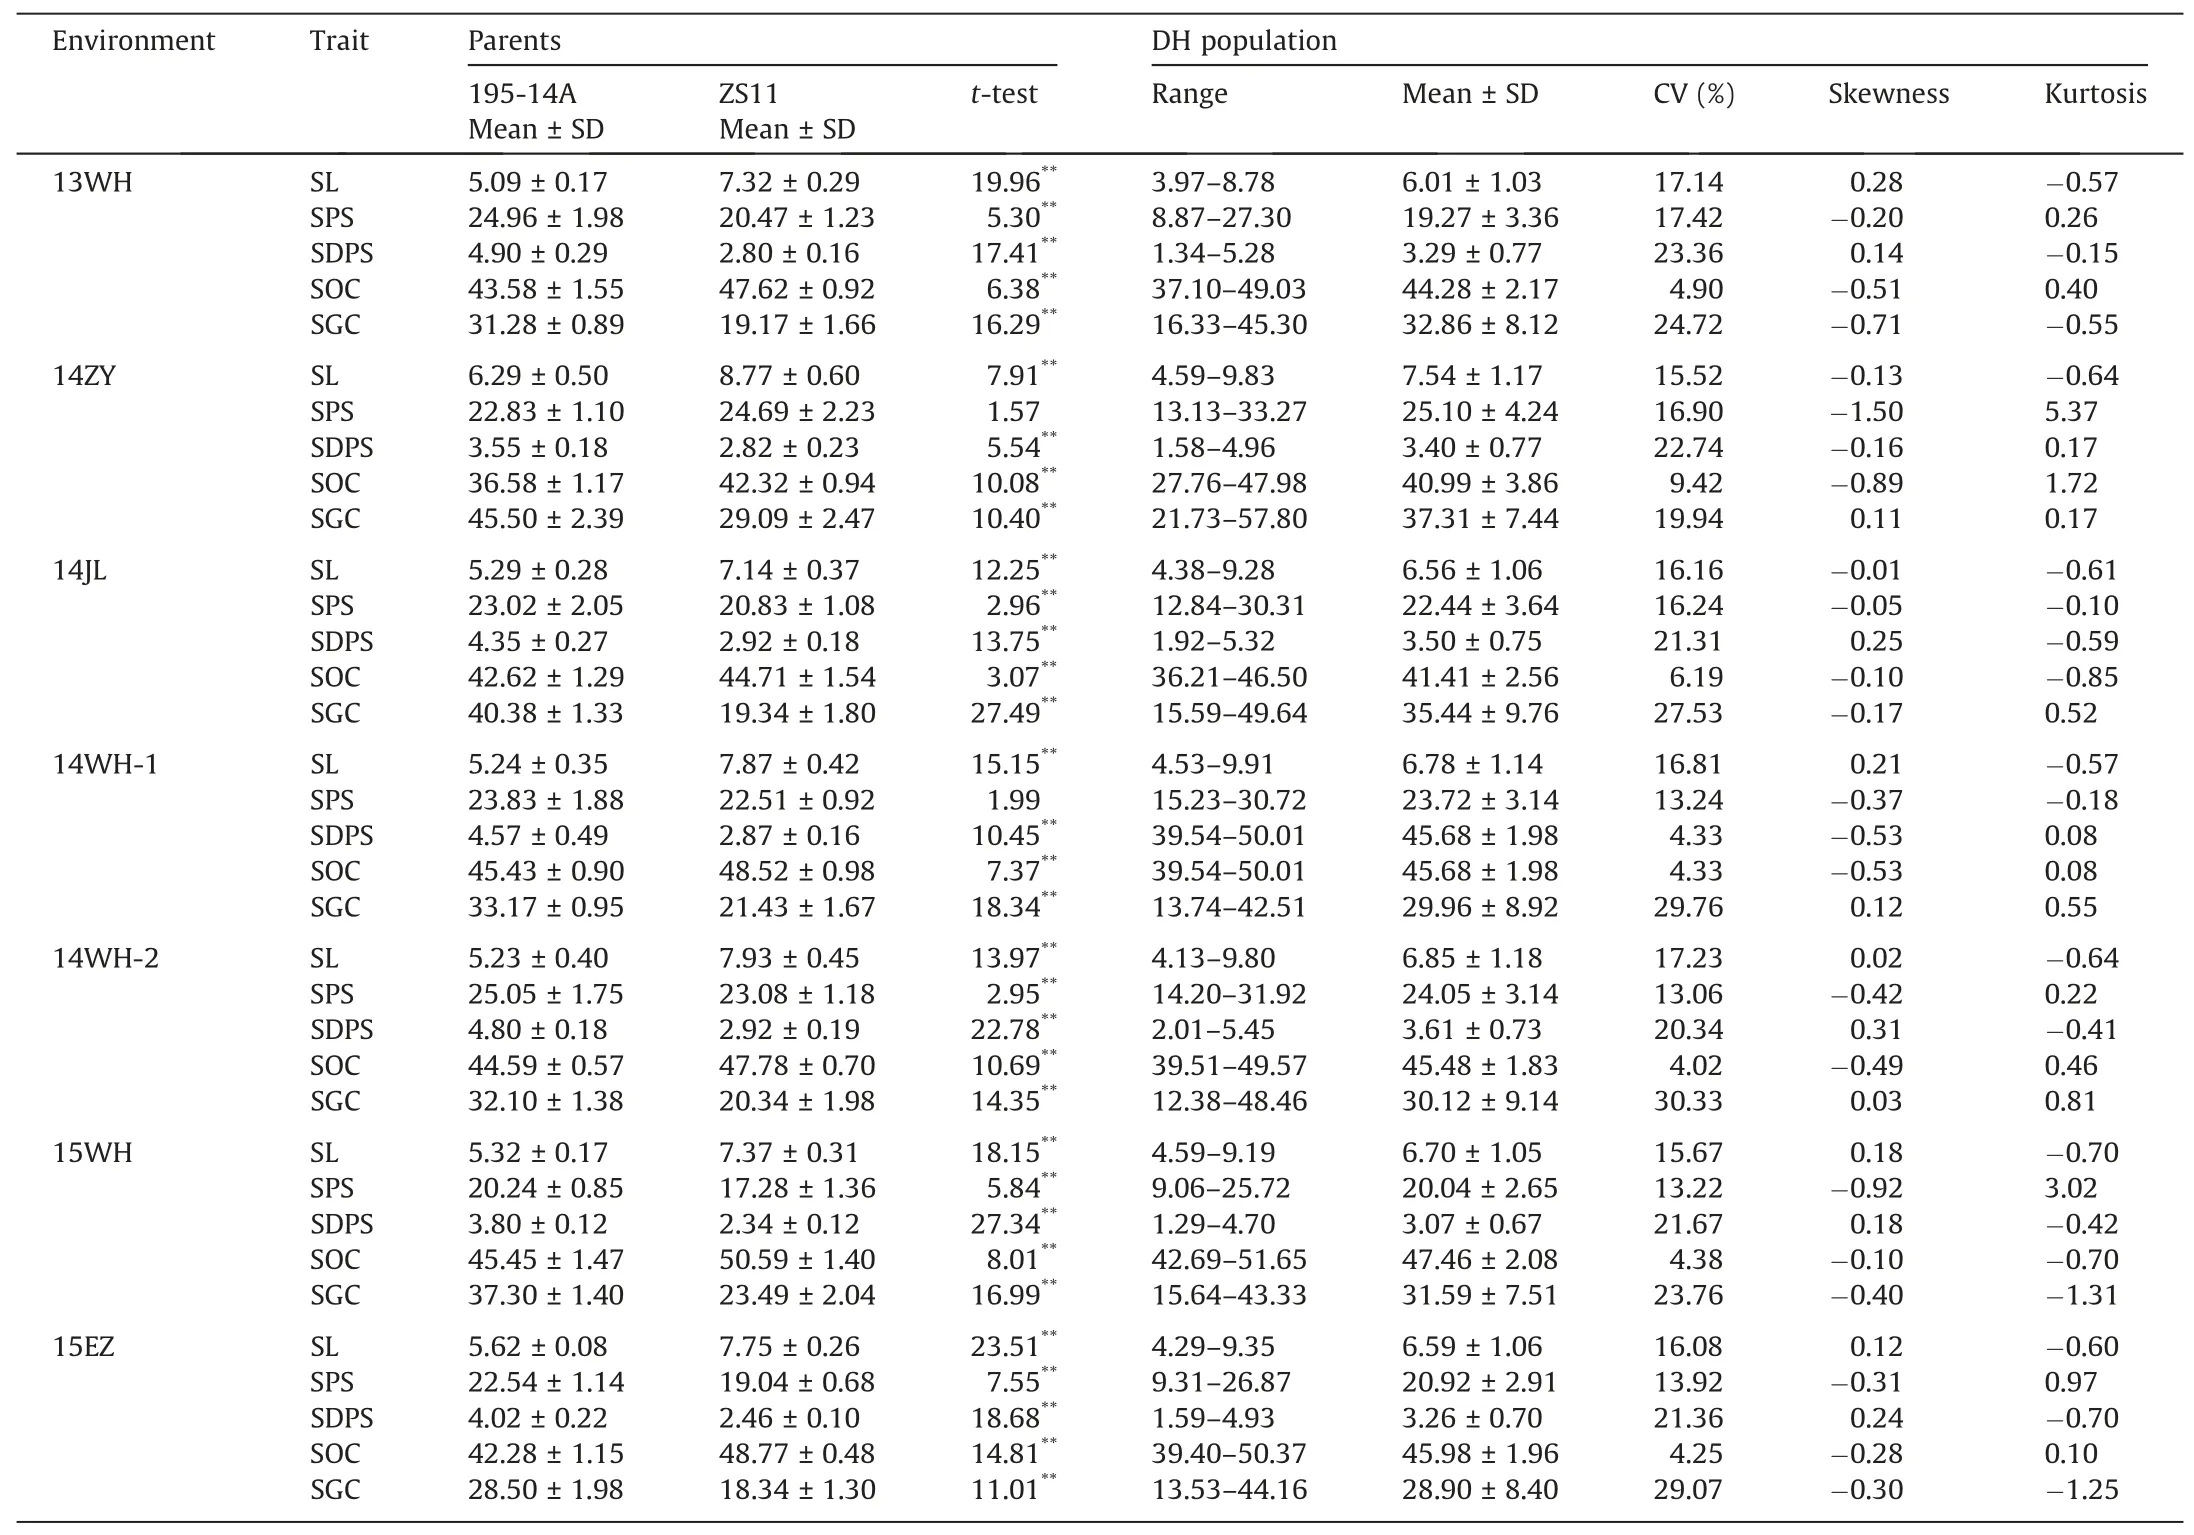
Table 1Phenotypic variation of SL,SPS,SDPS,SOC,and SGC for DH lines and their parents in seven environments.
For SPS,37 QTL were identified,with PVE ranging from 6.09%to 20.37%,and were integrated into 15 consensus QTL(Fig.3B;Table S3).Nine were environment-specific and the rest stable QTL.Two consensus QTL(cqSPS-A6-2andcqSPS-A7-2)with PVE values in the ranges 7.15%–17.79% and 11.66%–14.62%,detected in five environments(14WH-1/14JL/14WH-2/15WH/15EZ)and two environments(14WH-1/14WH-2),respectively,were identified as major QTL(Fig.3B;Table 2).
In total,33 SDPS QTL with PVE values ranging from 2.53% to 51.51%were identified in all environments(Fig.3C;Table S3).These QTL were integrated into 10 consensus QTL,and onlycqSDPS-A9-2was assigned as a major QTL(Table 2).The QTLcqSDPS-A9-2explained 33.86%–51.51% of phenotypic variation with an LOD value ranging from 16.32 to 31.13 and was detected consistently across all the environments(13WH/14JL/14ZY/14WH-1/14WH-2/15WH/15EZ;Table S3).
Thirty-five QTL for SOC were detected in multiple environments(Table S3).These QTL were integrated into 15 consensus QTL(Fig.3D;Table 2).Among them,six could be repeatedly detected in different environments,and two(cqSOC-A5-2andcqSOC-A5-3)with PVE in the ranges 13.93%–18.23% and 9.05%–24.59% were assigned as major QTL.
A total of 29 QTL that influenced SGC in different environments were detected,with LOD and PVE in the ranges of 2.59–56.86 and 1.63%–76.28%,respectively(Table S3);13 consensus QTL integrated by these identified QTL were obtained(Fig.3E;Table 2),all of which were environment-specific,exceptcqSGC-C2,which was detected in more than one environment.The major QTL,cqSGC-C2,with PVE ranging from 49.93% to 76.13% and an LOD value ranging from 20.84 to 56.86,showed a negative additive effect(-7.02 to-9.26),indicating that the allele underlyingcqSGC-C2for decreasing SGC was derived from parent ZS11.
In summary,more than one third of the consensus QTL for the five traits were detected in two or more environments.Among these,2,1,2,2,and 1 major QTL were obtained for SL,SGC,SOC,SPS,and SDPS,respectively.Four major QTL(cqSL-A9-2,cqSL-C7,cqSDPS-A9-2,andcqSGC-C2)were stably detected across all seven environments.
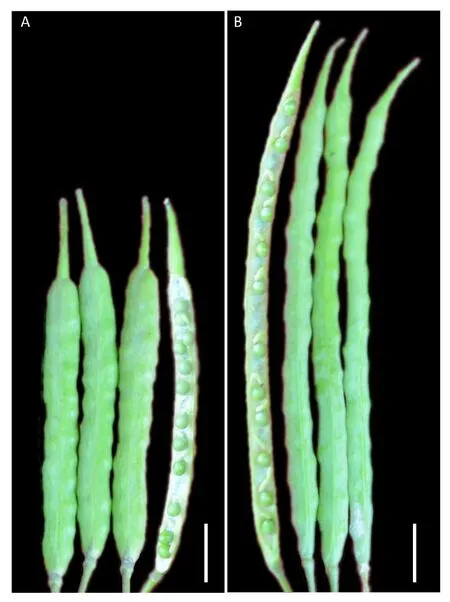
Fig.1.Silique and seed phenotypes of the two parents.The short silique parent 195-14A(Scale bar,10 mm).(B)The long silique parent ZS11(Scale bar,10 mm).
3.4.Detection of pleiotropic unique QTL
Significant phenotypic correlations were observed among the five traits(SL,SPS,SDPS,SGC,and SOC)(Table S1),a finding also reflected by the genomic location and the effects of the identified QTL.Seventy-one consensus QTL were integrated into 17 pleiotropic unique QTL in the second round of QTL meta-analysis,and all these unique QTL controlled at least two traits(Table S5).Among these QTL,four(uqA9-1,uqA9-2,uqA9-3,anduqA9-4)were distributed on chromosome A9,controlling SL,SPS,SDPS,and SOC(Fig.S5),indicating that the genome region of these unique QTL harbored a gene cluster controlling silique traits and oil content.A unique QTL,uqA9-1,was integrated from three consensus QTL(cqSL-A9-1,cqSPS-A9-1,andcqSDPS-A9-1)with a similar CI.For the parent ZS11,the QTLcqSL-A9-1showed a positive effect,whereas the additive effects of QTLcqSPS-A9-1andcqSDPS-A9-1at the same locus were negative.This result might explain the positive correlation between SPS and SDPS and the negative correlation between SL and SDPS.
3.5.Prediction of candidate genes
To identify candidate genes for overlapping and major QTL,genes distributed on reference genomic sequences located within QTL confidence intervals were selected and aligned with theArabidopsisgenome.In the genomic region where the reference genome of Darmor-bzhshowed relatively low assembly quality,the genomic sequences from the recently released reference genome of ZS11 were used instead,to avoid missing candidate genes[31].Finally,72 homologous genes inArabidopsiswere assigned as candidate genes for the overlapping QTL or major QTL identified(Table S7).
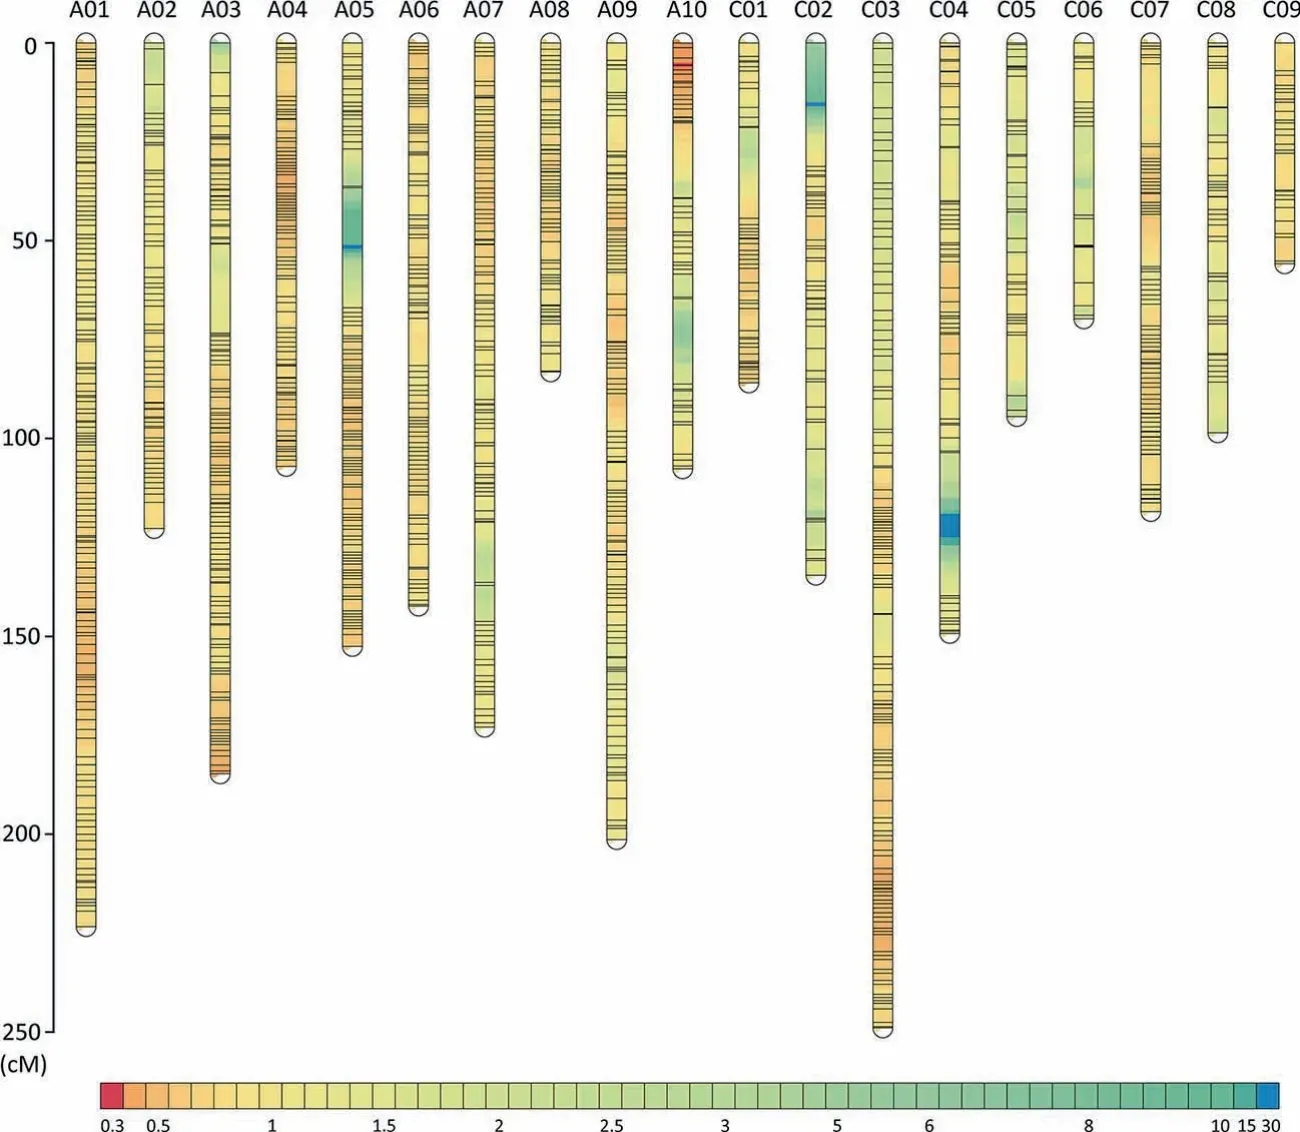
Fig.2.Genetic linkage map of DH population.High-density genetic linkage map derived from the DH population.The name of each linkage group is shown above it.The ruler on the left indicates the genetic position in centimorgans(cM).The color scale at the bottom represents the density of markers(cM locus-1).

Fig.3.Distribution of SNPs in the linkage map and information of QTL for five traits in seven environments.(A–E)QTL information for five traits,SL,SPS,SDPS,SOC,and SGC.The SNP markers in each linkage group were aligned to the corresponding positions in the physical map(from the outermost circle to the second outer circle).The black blocks on the third to ninth circles represent QTL identified in the 15WH,15EZ,14WH-1,14WH-2,14JL,14ZY,and 13WH environments,respectively.The red blocks in the tenth circle represent the consensus QTL integrated by QTL meta-analysis.The ranges of the blocks represent the CI of each QTL.(F)The number of QTL for the five traits and their location distribution.SL,silique length;SPS,seeds per silique;SDPS,seed density per silique;SOC,seed oil content;SGC,seed glucosinolate content.
In the QTL CIs ofcqSPS-A5,cqSPS-A6-2,andcqSPS-A7-2,several orthologous genes in these pathways were identified.Among them,OVA3,OVA2,andSDG8were involved in ovule development,which is closely related to seed number per silique.Mutations inOVA3andOVA2lead to ovule abortion,causally reducing the seed number per silique[41].According to the expression files,these genes were expressed mainly in seeds and embryos,indicating that they were the most likely candidate genes.Several genes were predicted as candidate genes forcqSL-A9-2,which is a major QTL detected repeatedly in several studies.Among them,BnaA09g55580D(ARF18)andBnaA09g55530D(CYP78A9),which participate in the auxin signaling pathway,have been cloned by map-based cloning[21,22];however,whetherBnaA09g41380D(FLA3)is the target gene of a QTL for SL remains to be determined[42].The gene expression pattern further showed that five genes:BnaA09g38680D,
BnaA09g55530D,BnaA09g55580D,BnaA09g39680D, andBnaA09g41180D,were expressed mainly in silique pericarps(Fig.S6).These five genes were accordingly selected as the most likely candidate genes forcqSL-A9-2.
A large number of candidate genes were predicted for SOC and SGC.For SOC,many candidate genes,includingLTP12,LTPG4,ACBP6,TGD2,andTED4,were involved in lipid transport(Table S7).In the CI ofcqSOC-A5-2,three orthologs of knownArabidopsisgenes(ATOBL1,GLIP4,andDALL4)controlling seed oil content were found.Similarly,the CI ofcqSOC-A5-3contained five homologs ofArabidopsisgenes controlling seed oil content:FAD7,CYP77A6,AHB2,SDP6,andPAH1.FAD7encodes an enzyme responsible for the synthesis of 16:3 and 18:3 fatty acids,which is involved in fatty acid biosynthesis[43];SDP6encodes a FAD-dependent,glycerol-3-phosphate dehydrogenase,and is possibly involved in stored lipid catabolism and glycerol assimilation[44].An ortholog ofACBP6was also identified in the candidate region ofcqSOC-C5-2,encoding a cytosolic,acyl-CoA-binding protein and conditions SOC inArabidopsis[45].The expression of these candidate genes varied among tissues;however,most of the genes were expressed in anthers,seeds,and embryos(Fig.S6;Table S8).For SGC,three genesBnaA03g45730D,BnaA04g12790D,andBnaCnng43220D(which are individually homologous toGSH1,CYP79B3,andMYB28,which are involved in glucosinolate biosynthesis inArabidopsis),were located within the CIs ofcqSGC-A3,cqSGC-A4,andcqSGC-C2,respectively(Table S7).Among them,MYB28is the master regulator of aliphatic glucosinolate biosynthesis[46],whereasCYP79B3encodes a cytochrome P450 protein as a precursor of indole glucosinolates inArabidopsis[47].These candidate genes were expressed preferentially in roots,leaves,cotyledons,stems,and silique pericarps,but not in seeds.This result suggested that glucosinolates were synthesized mainly in vegetative organs in rapeseed,in agreement with findings inArabidopsis[48].
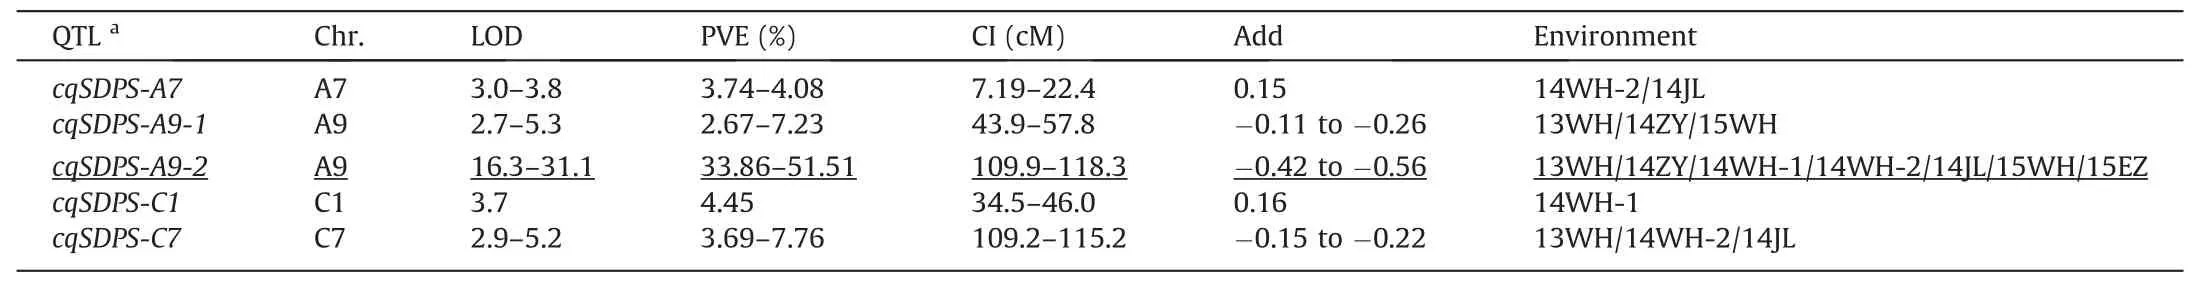
Table 2(continued)
?
4.Discussion
4.1.QTL integration is an efficient strategy for the identification of consensus and novel QTL
In the present study,by QTL integration analysis,many QTL were successfully aligned to the reference genome of Darmor-bzh(Table S6).Many overlapping QTL in this study were identified by comparison with published QTL in defined physical intervals(Table 3).A major QTL,cqSL-A9-2,was repeatedly detected in different populations,indicating that there was wide allelic variation for this QTL among cultivars.Another major QTL,cqSL-C7,detected across all the environments here,but not in previous studies,was identified as a novel QTL for SL.It is likely thatcqSL-C7results from a novel mutation,and more natural accessions should be examined to determine whether it represents a rare mutation and could be exploited to increase silique length.Although a few QTL associated with SPS,includingcqSPS-A5,cqSPS-A7-2,cqSPS-A9-2,cqSPS-A9-3,andcqSPS-C4,were identified as overlapping with previous ones,the other ten(including the major QTL,cqSPS-A6-2)were novel.These observations suggest that the genetic basis of SPS is complex and that the increase in SPS may be dependent on the accumulation of multiple favorable alleles with minor effects.In breeding projects,SDPS is regarded as an important trait,and higher SDPS is targeted,as it would maintain a better balance between seed number per silique and silique number per plant.As SDPS is a composite trait derived from the ratio of SPS to SL,QTL responsible for SDPS variation are rarely analyzed individually,and are expected to be associated with SL or SPS.As expected,the QTL,cqSDPS-A9-2,residing in almost the same CI across the seven environments,can be integrated into the unique QTLuqA9-2together withcqSLA9-2andcqSPS-A9-2.The additive effects of all the identified QTL that were integrated intocqSL-A9-2were consistently positive in multiple environments,whereas the additive effects of those QTL integrated intocqSPS-A9-2andcqSDPS-A9-2were always negative in all environments.We speculate that a gene with multiple effects simultaneously regulating SL,SPS,and SDPS is present in the QTL region ofuqA9-2,rather than a gene cluster tightly linked to regulate these traits in this QTL region.Fine mapping or even gene cloning could test this speculation.Two neighboring major SOC QTL,cqSOC-A5-2andcqSOC-A5-3,distributed on the A5 chromosome with a 0.58 Mb gap,probably corresponded to the QTLqOC.A5reported in a previous study[26].The alleles with positive additive effects for all SOC QTL(except forcqSOC-A3andcqSOC-A7-2)were from the parental line ZS11(Table 2),explaining the genetic basis of the extra-high SOC of ZS11.For SGC,four present QTL detected on A1,A3,and A4[6,26,29]overlapped with previous QTL,including the major QTL,cqSGC-C2,which was entirely bracketed in the QTL region of the previousqGSL-C2[6].BothcqSGC-C2andqGSLC2showed high values of PVE,and the favorable alleles were all derived from low-SGC parents.Thus,QTL integration analysis distinguished conserved and novel QTL and will facilitate the use of these QTL by breeders.
4.2.A comprehensive approach to accelerated candidate gene prediction in complex,allotetraploid B.napus
Based on the QTL integration and comparative analysis,eight candidate genes were predicted forcqSL-A9-2.Among them,BnaA09g55580D,an auxin response factor,was shown[21]to regulate silique wall development via an auxin-related response pathway;another gene,BnaA09g55530D,encoding a cytochrome p450 monooxygenase,was shown[22]to positively regulate silique elongation by acting in the auxin metabolism or biosynthesis pathways.The previously identified QTLqSL_ZR_A09,which overlapped withcqSL-A9-2,was assigned as a novel QTL with a physical region near the two cloned genes(BnaA.ARF18.aandBnaA9.CYP78A9).BnaA09g41380D(FLA3)was the most promising candidate gene underlying this locus[49].Interestingly,all of these genes were included in the five most promising candidate genes forcqSL-A9-2according to the expression analysis,suggesting that an efficient approach to predicting likely candidate genes is combination of QTL integration,comparative genomics,and gene expression pattern analysis.
The differences in SGC between parents were regulated mainly by a major QTL and multiple minor QTL.The major SGC QTL,cqSGCC2,was repeatedly detected in the DH[6]and natural populations[26].The expression analysis showed that all the candidate genes for SGC were expressed mainly in the roots,leaves,cotyledons,stems,and silique pericarps,although their expression in seeds was minimal.This finding is similar to the results of a similar analysis[48]inArabidopsisthat suggested that glucosinolates are synthesized mainly in vegetative organs.BnaCnng43220D(MYB28),which is a key factor in the regulation of aliphatic sulfide biosynthesis inA.thaliana[46],was the most likely target gene forcqSGC-C2.Based on the gene prediction,several candidate genes involved in lipid transport,fatty acid metabolic process,and lipid metabolic process were identified as potential target genes for SOC QTL(Table S7).Although the expression of candidate genes varied among tissues,three genesBnaA09g32100D(LTP12),BnaC05g32380D(SVL3),andBnaC05g27860D(ATG6)were expressed specifically in seeds and are thus likely to be the target genes for SOC QTL.Thus,QTL integration can effectively narrow the target interval of a QTL,comparative genomic analysis can quickly predict candidate genes,and expression analysis can identify the most likely candidate genes for further functional verification.This strategy for analyzing complex crop genomes such as that ofB.napuswill not only narrow the candidate gene scope but increase the accuracy of candidate gene prediction.
4.3.Favorable alleles from ZS11 are expected to be mined for rapeseed cultivar improvement
Compared with 195-14A,ZS11 exhibited long siliques,high oil content,and low glucosinolate content,an ideal phenotype for cultivar improvement.Among the QTL identifed for these traits,the most favorable alleles were from ZS11,including all the majorQTL(cqSL-A9-2,cqSL-C7,cqSOC-A5-2,cqSOC-A5-3,andcqSGC-C2).As the favorable alleles of the two major QTL,cqSL-A9-2andcqSL-C7,were derived from ZS11,we speculated that ZS11 could be used as a donor to transfer the favorable alleles of these loci into recipient material by hybridization and recurrent backcrossing,so that the silique of the recipient could reach an ideal length.For SOC,almost all the favorable alleles were from ZS11,and they could be gradually introgressed into 195-14A by backcrossing combined with marker selection to increase its oil content.The high-SGC parent 195-14A(35.46±1.47 μmol g-1)already possessed moderate to low levels of glucosinolate content.Introgression of the favorable allele derived from ZS11 responsible forcqSGC-C2(with additive effect ranging from–7.02 to–9.26)could further reduce SGC.This locus would thus be useful for reducing SGC in accessions with slightly higher SGC than required by the variety registration standard.These findings together explain the genetic basis of silique and seed-quality traits of the elite cultivar ZS11,and the favorable alleles associated with these traits will provide abundant resources for subsequent improvement of the high general combining ability(GCA)line 195-14A and other rapeseed accession(Table S9).
5.Conclusions
We constructed a DH population from the F1cross between ZS11 and 195-14A and identified 198 QTL associated with three silique traits and two seed-quality traits.These QTL were integrated into 71 consensus QTL,and 72 candidate genes underlying 21 of the consensus QTL were identified.Most of the favorable alleles were derived from ZS11,especially for SL,SOC,and SGC.These findings shed light on the genetic basis of silique and seed-quality traits of the elite parent of ZS11 and indicated that ZS11 can be used to improve other high-GCA rapeseed lines like 195-14A by marker-assisted breeding.
CRediT authorship contribution statement
Xianming Zhouperformed most of the experiments,including DH construction,data analysis,and QTL mapping.Lihong Dai,Zhaoqi Xie,Ying Liu,and Haiyan Zhangparticipated in phenotypic and genotypic analyses of the DH population.Pengfei Wangparticipated in the data analysis.Xianming Zhouwrote the manuscript.Qiang Xin,Lili Wan,Liyong Yang,and Dengfeng Hongreviewed the manuscript.Guangsheng Yang and Dengfeng Hongconceived and supervised the project.All authors approved the final version of the manuscript.
Declaration of competing interest
The authors declare that they have no known competing financial interests or personal relationships that could have appeared to influence the work reported in this paper.
Acknowledgments
This research was supported by National Key Research and Development Program of China(2017YFD0101702),Key Projects in Shanghai Agricultural Science(2014,No.7-1-1),and partly supported by the Open Funds of the National Key Laboratory of Crop Genetic Improvement(ZK201909).
Appendix A.Supplementary data
Supplementary data for this article can be found online at https://doi.org/10.1016/j.cj.2020.12.008.
- The Crop Journal的其它文章
- WheatGene:A genomics database for common wheat and its related species
- A gain-of-function mutation of OsMAPK6 leads to long grain in rice
- Genetic dissection of rice appearance quality and cooked rice elongation by genome-wide association study
- The importance of aboveground and belowground interspecific interactions in determining crop growth and advantages ofpeanut/maize intercropping
- Genetic gains with genomic versus phenotypic selection for drought and waterlogging tolerance in tropical maize(Zea mays L.)
- BSA-seq-based identification of a major additive plant height QTL with an effect equivalent to that of Semi-dwarf 1 in a large rice F2 population