
Genetic gains with genomic versus phenotypic selection for drought and waterlogging tolerance in tropical maize(Zea mays L.)
2021-12-10 12:23:40RshmiRniDsMhumlThyilVinynKliymoorthySthrmMnishPtlRmshKumrPhgnShymBirSinghJiPrkshShhiAkshiSrmNgnrSrmBruRmnBuPrvzHirZii
The Crop Journal 2021年6期
Rshmi Rni Ds,Mhuml Thyil Vinyn,Kliymoorthy Sthrm,Mnish Ptl,Rmsh Kumr Phgn,Shym Bir Singh,Ji Prksh Shhi,Akshi Srm,Ngnr Srm Bru,Rmn Bu,Prvz Hir Zii,*
a International Maize and Wheat Improvement Center(CIMMYT),ICRISAT Campus,Patancheru 502324,Hyderabad,India
b Main Maize Research Station,Anand Agriculture University,Anand 388001,Gujarat,India
c ICAR-Indian Institute of Maize Research,Ludhiana141001,Bihar,India
d Institute of Agricultural Sciences,Banaras Hindu University,Varanasi 221005,Uttar Pradesh,India
e Assam Agricultural University,Jorhat 785013,Assam,India
Keywords:
A B S T R A C T Erratic rainfall often results in intermittent drought and/or waterlogging and limits maize(Zea mays L.)productivity in many parts of the Asian tropics.Developing climate-resilient maize germplasm possessing tolerance to these key abiotic stresses without a yield penalty under optimal growing conditions is a challenge for breeders working in stress-vulnerable agro-ecologies in the region.Breeding stress-resilient maize for rainfed stress-prone ecologies is identified as one of the priority areas for CIMMYT-Asia maize program.We applied rapid cycle genomic selection(RCGS)on two multiparent yellow synthetic populations(MYS-1 and MYS-2)to improve grain yield simultaneously under drought and waterlogging conditions using genomic-estimated breeding values(GEBVs).Also,the populations were simultaneously advanced using recurrent phenotypic selection(PS)by exposing them to managed drought and waterlogging and intermating tolerant plants from the two selection environments.Selection cycles per se(C1,C2,and C3)of the two populations developed using RCGS and PS approach and their test-cross progenies were evaluated separately in multilocation trials under managed drought,waterlogging,and optimal moisture conditions.Significant genetic gains were observed with both GS and PS,except with PS in MYS-2under droughtandwith GS in MYS-1 under waterlogging.Realizedgenetic gains from GSwere relatively higher under drought conditions(110 and 135 kgha- 1year -1)compared to waterlogging(38 and113 kg ha-1 year -1)in both MYS-1 and MYS-2,respectively.However,under waterloggingstress PSshowedatpar or better than GS as gainper yearwithPS was80 and90 kg ha -1,whereas withGSit was90and43kg ha- 1 for MYS-1 and MYS-2,respectively.Ourfindingssuggested thatcarefulconstitution of a multiparent population by involving trait donors for targeted stresses,along with elite highyielding parents from diverse genetic background,and its improvement using RCGS is an effective breeding approach to build multiple stress tolerance without compromising yield when tested under optimal conditions
1.Introduction
Maize is largely grown as a rainfed crop in the Asian tropics and is prone to the vagaries of monsoon rains.As such,maize production is affected by an array of abiotic and biotic constraints.Climate variability,together with erratic/uneven distribution of monsoon rainfall,has been identified as one of the key factors responsible for year-to-year fluctuations in maize production in the tropics[1,2].Developing and delivering improved maize cultivars that can withstand drought and waterlogging stress without yield penalties under optimal moisture conditions is critical for attaining resilience in maize-based system[3].
While there is a vast amount of research focusing on breeding for tolerance to individual stress,maize crops are occasionally subjected to a combination of stresses.Breeding programs often run independent genetic improvement for a priority trait,e.g.drought tolerance,however,the progenies from improved populations are screened for targeted trait as well as other key traits relevant in the target population of environment(TPE)to select genotypes that performed well against the targeted trait and also did reasonably well for other traits relevant in TPE.Spill-over from targeted priority trait that conferred tolerance to un-targeted trait(s)has been reported in previous studies,for example,some of the progenies derived from drought tolerant population also conferred tolerance to low nitrogen[4]or waterlogging[5].However,often gene networks that control different stress combinations cannot be reliably predicted from those identified from the screens under individual stresses[6].Predicted climate change scenarios are likely to result in an increase in the combination of stresses that crops must face in the field.Climate change projections suggest massive yield losses in tropical regions,underlining the high priority that needs to be accorded to developing climate-resilient germplasm to offset these losses[6].Given that combined tolerance to multiple stresses may differ from tolerance to individual stresses,research needs to focus on stress combinations that are likely to occur in TPE and to develop new maize germplasm with improved stable performance across non-optimal and optimal environments,rather than on tolerance to individual stresses.This calls for a welldefined breeding,phenotyping and selection strategy targeted at increasing resilience for high-stable performance across variable environments.
Stress-resilient maize has been specifically bred for increased tolerance to abiotic stresses associated with a variable and changing climate,along with yield potential and defence traits[7].Historically,large gains have been made through conventional breeding that relies on extensive phenotypic screening,which is effective but slow in producing germplasm tolerant to current climatic conditions and may therefore not be ideal to improve tolerance to multiple stresses rapidly.According to Bernardo[8,9],marker-assisted selection(MAS),in which a few markers significantly associated with phenotypic traits has been widely used.Recent development of low-cost,single nucleotide polymorphism(SNP)has made the genomic-based breeding approach more attractive and useful[10].Genomic-assisted breeding(genomic selection,GS)incorporates all the marker information available simultaneously into a model to predict the genetic value of progenies for selection[11].However,GS prediction accuracy is affected by many factors,including missing rate and minor allele frequency(MAF)of genotypic data,GS models,trait features such as their heritability and genetic architecture,etc.[12].Massman et al.[13]reported that RCGS showed a superior response for stover yield,as well as for stover and grain yield indices that were 14%–50% higher than those of marker-assisted recurrent selection(MARS).Application of GS with simulation allowed the prediction of cross performance and thereby identifying candidate parents before crosses are made for pure-line wheat breeding programs targeting for both grain yield and quality traits[14].
The expected gain(ΔG)from GS per unit time is defined as:
ΔG=i×r×σA/ywhereiis the selection intensity,ris the selection accuracy,σAis the square root of the additive genetic variance,andyis the time to complete one selection cycle[15].Assuming equal selection intensities and genetic variance for both GS and PS,greater gain per unit time is expected with GS compared with PS,as the duration of the selection cycle can be shortened with GS.A simulation study on various methods of recurrent selection suggested that GS would be more useful compared to PS or MARS in case of complex traits,controlled by several QTL with small effects[16].Improved genetic gain is possible from GS for complex,quantitative traits,i.e.,traits that are conditioned by many genes and affected by environmental factors[11].Beyene et al.[17]reported that the average genetic gain per year in tropical maize grain yield using GS was three times higher than that achieved by conventional,pedigree-based PS in drought stress environments.Vivek et al.[18]also reported larger genetic gains in grain yield in two biparental populations,from genome-wide selection than from conventional PS.
In most of the previous studies prediction accuracy is achieved with RCGS using biparental populations[19,20].However,Jannink et al.[21]outlined some of the disadvantages of using GS applications in biparental populations.The problem of limited allelic diversity in one genetic background which occurs in biparental populations can be overcome using multi-parental populations with greater allelic diversity coming from different genetic backgrounds[22],along with increased polymorphism and recombination as compared to biparental populations[23].Previous studies have suggested that genomic-enabled prediction accuracy of a multi-parental populations was higher than the accuracy achieved within a single population[24,25].Das et al.[26]reported simultaneous improvement of drought and waterlogging tolerance in multiparent populations and genetic diversity of the populations did not change significantly after two cycles of rapid cycle genomic selection(RCGS).The objectives of this study were to assess genetic gains across moisture regimes with RCGS or PS for combining drought and waterlogging tolerance,and to evaluate the relative efficiency of RCGS in terms genetic gains compared to conventional recurrent PS under managed stress environment.
2.Materials and methods
Various steps involved in the constitution of the two multiparent yellow synthetic(MYS)populations and their simultaneous improvement for drought and waterlogging tolerance using PS or RCGS is presented in Fig.1,and details about the germplasm used and steps followed in constitution of various selection cycles are described as below:

Fig 1.Year-wise activities in the constitution of multiparent yellow synthetic(MYS)populations and their simultaneous improvement for drought and waterlogging tolerance using rapid cycle genomic selection and phenotypic selection.
2.1.Constitution of training population,cycle 0(C0)
The populations were constituted from 10 advanced-stage tropical maize inbred lines from each of CIMMYT’s heterotic group A(HG-A)and HG-B(Table S1).This included four drought-tolerant lines,four waterlogging-tolerant lines,and two elite highyielding lines.The drought-tolerant donor lines were derived from the 9th cycle of CIMMYT’s drought-tolerant yellow maize population(DTP–Y).Details of the germplasm involved in constitution of DTP-Y and selection and improvement procedure are described elsewhere[27,28].In brief,the population was constituted during the mid-1980s using 25 putative drought-tolerant sources,includingTuxpeno SequiaC8,Latente,Michoacán 21,Suwan 1,crosses of CIMMYT populations 22,32,62,64,and 66,landraces,Corn Belt hybrids,and germplasm from Thailand,Brazil,and South Africa.The population was improved for nine cycles for flowering-stage drought tolerance using S1recurrent selection.Lines were extracted from cycle 9 of DTP-Y,advanced to S3stage,and testcrossed to two CIMMYT testers from opposite heterotic groups,i.e.,CML-486(HG–A)and CML-451(HG–B).Based on test-cross performance,lines were grouped into two heterotic groups.Out of total eight waterlogging tolerant lines,three were derived from a waterlogging yellow(WLY)synthetic developed during 2005–2006 at the CIMMYT-Asia maize program using three lines originated from Suwan 1,five waterlogging-tolerant CIMMYT maize lines(CMLs),and three waterlogging-tolerant CIMMYT-Asia lines identified from line evaluation trials under managed waterlogging[29].Other five lines were derived from various CIMMYT-Asia maize program germplasm,including two lines from‘SW92145′,an open pollinated variety(OPV)developed out of Suwan population,and one each from EY-DMR(early yellow downy mildew resistant)population,OPV‘KTX3753′,and a bi-parental population(CML165×CL-02839).The lines were extracted at cycle 5 of WLY,advanced to S2stage and test-crossed to the same two CIMMYT testers(CML-286 and CML-451).The lines were then grouped based on their heterotic group(HG)and selected for further advancement.
The selected lines were intermated twice within the HG to constitute each population.The first intermating was done using the half-diallel mating scheme and an equal number of seeds from each harvested ear was bulked.Bulked seed for each population was planted separately in 50 rows,each 5-m long.The second intermating was done using bulk sibbing by dividing each nursery into two equal halves(25 rows each)and pollinating the 1st half with bulk pollen collected from the 2nd half(from 300 to 400 plants in each round of pollinations)and vice-versa.Bulk pollination was completed in four days to avoid outliers with respect to pollen shedding time.After two rounds of intermating,C0of the two MYS populations was formed by bulking an equal number of seeds from each harvested ear,and designated as MYS-1 and MYS–2(Fig.1).
2.2.Formation of cycle 1(C1)
Cycle 0 bulk of each population was planted in 50 rows(each 5-m long)and self-pollinated to derive S2families from each population.A total of 514 and 492 S2families derived from MYS-1 and MYS-2,respectively,were test-crossed with two CIMMYT tester lines from the opposite heterotic groups CML-286(HG-A)and CML-451(HG-B).The S2progeny test-crosses(TCs)were evaluated across moisture regimes,including three locations each under optimal moisture and managed drought and waterlogging stress(Table S2),using standard phenotyping protocols as available elsewhere[30,31].Due to poor heritability estimate trial at one location under waterlogging was rejected,and only two locations were used for further analysis.
Data on the following traits were recorded under optimal conditions,drought,and waterlogging stress at each location:plant height(PH),ear height(EH),root lodging(RL),stem lodging(SL),senescence(SN),anthesis date(AD),silking date(SD),ears per plant(EPP),and grain yield(GY)based on field weight(FW)and moisture content(MOI)at harvest in all the trials.Plant and ear height in each plot were recorded two weeks after male flowering,as the distance between the ground surface and node bearing flag leaf and between the ground surface and the node bearing uppermost ear,respectively.Observations on PH and EH were recorded on 10 plants,avoiding two plants near the alley,and averaged.Stem and root lodging were recorded between physiological maturity and harvest.The number of plants in a plot that lodged because of the stem bending/breaking at an internode above the ground but below the uppermost ear was recorded as SL,and those uprooted from the base and where the angle between the lodged plant and soil surface was less than 45°,were counted as RL,and the percentage of SL and RL per plot was calculated.Plant senescence was scored on a plot basis using a 1–10 scale,where 1=10% and 10=100% dead leaf area,starting from the base towards the top of the plants two weeks after 50% female flowering.The number of days from planting to anthesis(50% plants in a plot had extruded the first anther)and silking(50%of the plants in a plot had produced the first silk)was recorded by daily visual observations during the flowering period.The anthesis-silking interval(ASI)was calculated as the difference between the number of days to 50% silking and 50% anthesis.
At harvest,all the ears(i.e.,cobs with at least one kernel)were harvested,excluding two plants close to the alley,and EPP was calculated by dividing the total number of ears by the total number of plants per plot.Field weight per plot was recorded by weighing all ears per plot using a digital hanging balance with a sensitivity of 10 g.Simultaneously,kernel moisture content in each plot was recorded using a grain moisture meter that sampled approximately 100 kernels shelled from at least 10 ears.Grain yield per plot was calculated after adjusting the field weight to 80% shelling percentage and 125 g kg-1kernel moisture content.Data on brace roots(BR)was recorded only in the waterlogging trials by counting the number of above-ground nodes with brace roots;the observations were recorded on five representative plants per plot about two weeks after the release of stress,and mean BR per plot was computed.
Data from S2-TC trials across locations under different moisture regimes were first subjected to single-site analysis and data quality was assessed using broad-sense heritability for grain yield,which ranged from 0.49 at Godhra location under managed drought stress to 0.87 at Ludhiana location under optimal moisture conditions(data not shown).Across-sites analysis was conducted within each moisture regime,which showed highly significant genotypic variability among test entries under all three moisture regimes(Table S3).Entries within each moisture regime were ranked based on grain yield.After ranking for grain yield,the entries with undesirable traits under optimal or managed stress conditions were identified and discarded.Ranks of the entries in the three moisture regimes were averaged and the top 5%of the entries,i.e.,27 entries from MYS-1 and 24 from MYS-2,with high average ranks across moisture regimes were selected.Two separate balanced bulks were formed for MYS-1 and MYS-2 by pooling equal number of seeds from remnant seed of the female parent(S2family)of the selected 5% test-crosses,i.e.,27 entries from MYS-1 and 24 from MYS-2.A crossing nursery was planted separately for each population in 20 rows of 4.0 m using bulk seeds of each population.Each nursery was divided into two equal halves and pollen from the plants from the first half was collected to pollinate the plants in the second half of the nursery and vice-versa.At harvest,an equal number of seeds from each harvest ear was bulked to constitute cycle 1(designated as C1-PS)of MYS-1 and MYS-2(Fig.1).
2.3.Estimation of marker effects and genomic-estimated breeding values(GEBVs)
From each parental line,DNA was extracted by bulking equal amounts of leaf tissue from 20 individual plants.All the parents of both the populations were genotyped using KASPAR assays from 1256 SNPs at LGC Genomics,London(https://www.lgcgroup.com/).For MYS-1,342 polymorphic markers(Table S4)and for MYS-2,312 polymorphic markers(Table S5)were identified with maximum polymorphism information and used for genotyping the S2families.Marker effects were estimated based on genotyping and phenotyping data for grain yields of S2families using ridgeregression,best-linear unbiased prediction(RR-BLUP)method in R-software[10,32]to visualize distribution of marker effects for different traits across the genome.Genomic prediction was carried out by estimating genomic estimated breeding values using the genomic relationship matrix in C1and C2using Genomic Best Linear Unbiased Predictor(G-BLUP)model in the BGLR package[33]in R program version 3.6.1[34],to advance the populations to the next cycle without phenotyping.In C0,a 10-fold cross-validation with 500 iterations were used to generate training and validation sets to assess the predictive ability as the correlation of predicted grain yield with observed grain yield(rMP)in both the MYS populations and under all managements.In each of the 500 replications,the observations in randomly selected nine-fold were assigned as training,and the remaining observations in the rest fold were assigned as testing sets.
2.4.Formation of cycle 2(C2)and cycle 3(C3)using RCGS
Twenty rows,each 5 m long,were planted using balanced bulk seeds of C1of the two MYS populations,and 380 selected plants were genotyped using 342 and 312 polymorphic SNP markers for MYS-1 and MYS-2 respectively.The top 5%of the plants with high GEBVs for grain yield under drought and/or waterlogging stress in each population were identified,tagged,and intermated using the bulk-sibbing method.At harvest,an equal number of seeds from the ear of each selected family was bulked to constitute C2(designated as C2-GS).In the next season,20 rows of C2bulk for each population were planted separately,and 380 selected plants were genotyped using the polymorphic SNP markers for MYS-1 and MYS-2.Genomic-estimated breeding values for individual plants were estimated and the top 5% of the progenies with high GEBVs for grain yield under drought and/or waterlogging stress were tagged and intermated using the same procedure as used for C2-GS.After harvest,a balanced bulk was formed by pooling an equal number of seeds from each harvested ear to constitute Cycle 3(designated as C3-GS).
2.5.Formation of cycle 2(C2)and cycle 3(C3)using PS
Two sets of C1bulk seed of two populations were planted separately at CIMMYT’s research farm in Hyderabad,each on a plot of 50 five-meter-long rows.One set was exposed to managed drought stress at the reproductive stage and another set was exposed to managed waterlogging for seven days at the V6–7stage using the same precision phenotyping protocols as described above in the Section 2.2.The top 5% of stress-tolerant plants in drought and waterlogging stress plots were identified based on secondary traits known to be associated with stress tolerance,including ASI<5.0 days,SN score<4.0,and no SL or RL under drought stress[35,36];and ASI<5.0 days,BR>2.0 nodes,and no SL and RL under waterlogging stress[37,38].The identified stress-tolerant plants were tagged in both the stresses and intermated using bulked pollen of tolerant individuals from one stress and pollinating the tagged plants in the other stress and vice versa.At harvest,the ears with good(>80%)seed setting from amongst the inter-crossed plants were selected and an equal number of seeds from each ear were bulked to constitute C2(designated as C2-PS).Similarly,in the next season,a total of 50 rows(each 5 m long)of the two populations were planted with bulked seeds of C2-PS and exposed separately to drought and waterlogging stresses.The selected top 5%stress-tolerant individuals from each environment were identified,tagged and intermated using the same criteria and procedures as used for C2-PS,and C3(designated as C3-PS)was formed by bulking an equal number of seeds from each harvested ear from the two stress environments.
2.6.Assessment of genetic gains with RCGS and PS
During the dry season of 2017–2018,seeds of all the cycles(C1,C2-PS,C2-GS,C3-PS and C3-GS)of the two populations were multiplied at the CIMMYT research farm at Hyderabad.All the cycles were test crossed with a tester line from the opposite heterotic group-CML-286(HG-A)and CML-451(HG-B).Field trials were constituted separately for selection cyclesper seand their test cross progenies,along with check entries,using an alpha(0,1)lattice design with 2/3 replications,and a trial design was generated using Field-book software[39].The population selection cycleper setrial entries included two open-pollinated varieties and one stress-resilient single-cross hybrid.The test cross trials included five benchmark hybrids,including two internal genetic gain checks(stress-resilient hybrids from CIMMYT-Asia)and three commercial hybrids from private seed companies.Multi-location trials were conducted across moisture regimes,i.e.,optimal moisture,managed drought,and waterlogging,at carefully selected locations in different agroecological zones(Table S2).The trials were managed following the recommended agronomic practices,and desired level of stress was applied in drought or waterlogging trials at the targeted crop growth stages with the desired level of intensity and uniformity.
In all the field phenotyping trials,each entry was planted in two-row plots,each row 4 m long,using inter-row spacing of 0.75 m and intra-row spacing of 0.20 m.Plots were thinned at a later stage to achieve a plant population of 66,666 plants ha-1.Optimal moisture trials were planted in a well-drained field during the rainy season of 2018 and supported with supplemental irrigation in case of intermittent dry spells.All the recommended practices for the crop at each location were followed to keep it free from any nutrient deficiency/toxicity,and any biotic pressure(disease,insects or weeds).All the managed drought-stress trials were conducted during the dry season of 2018–2019,where reproductive-stage drought stress was imposed by managing the irrigation schedule[40].In brief,the last irrigation in droughtstress plots was applied when the number of the accumulated growing degree days(GDD)was about 550(approximately two weeks before tassel emergence).At this crop stage,irrigation was applied uniformly across the field using a sprinkler system,up to full saturation.Thereafter,irrigation was withdrawn until the field reached the permanent wilting point(PWP).Depleting soil moisture on a volumetric basis(m3m-3)was monitored at weekly intervals using soil moisture profile probe PR 2/6(https://www.delta-t.co.uk/product/pr2/).Once the average moisture content at 40-cm soil depth reached close to PWP,irrigation was resumed,and thereafter the trial was managed at optimal moisture till harvest.
Managed waterlogging-stress trials were conducted during the rainy season of 2018.Stress treatment in the waterlogging trials was applied by flooding the field with knee deep water at V5–V6growth stage.A stagnant water depth of 10±0.5 cm was maintained continuously for seven days by supplying water through need-based supplemental irrigation at a rate that exceeded infiltration and evaporation[30].Following the stress treatment,the field was completely drained and irrigation was resumed as per crop needs.Data were recorded on primary and secondary traits in the trials conducted under the three moisture regimes using standard phenotyping protocols[30,31].
2.7.Data analysis and assessing genetic gains
Single-site data were analysed separately using the residual maximum likelihood(REML)procedure in Field-book software[39].Grain yield was estimated by adjusting grain moisture content to 125 g kg-1.The best linear unbiased prediction was calculated for each entry within each site.In the across-sites analysis performed separately for each water management regime using Field-book,the genotypes were treated as random and the sites as fixed effects.A regression analysis of selection cycle means for grain yields in selection cycles(C1,C2,and C3)was used to assess genetic gains(kg cycle-1)with RCGS and PS.Annual gain per hectare was calculated based on total gains divided by four years duration,the period starting from first intermating of parental lines for constituting the base populations up to the harvesting of C3seeds(Fig.1).
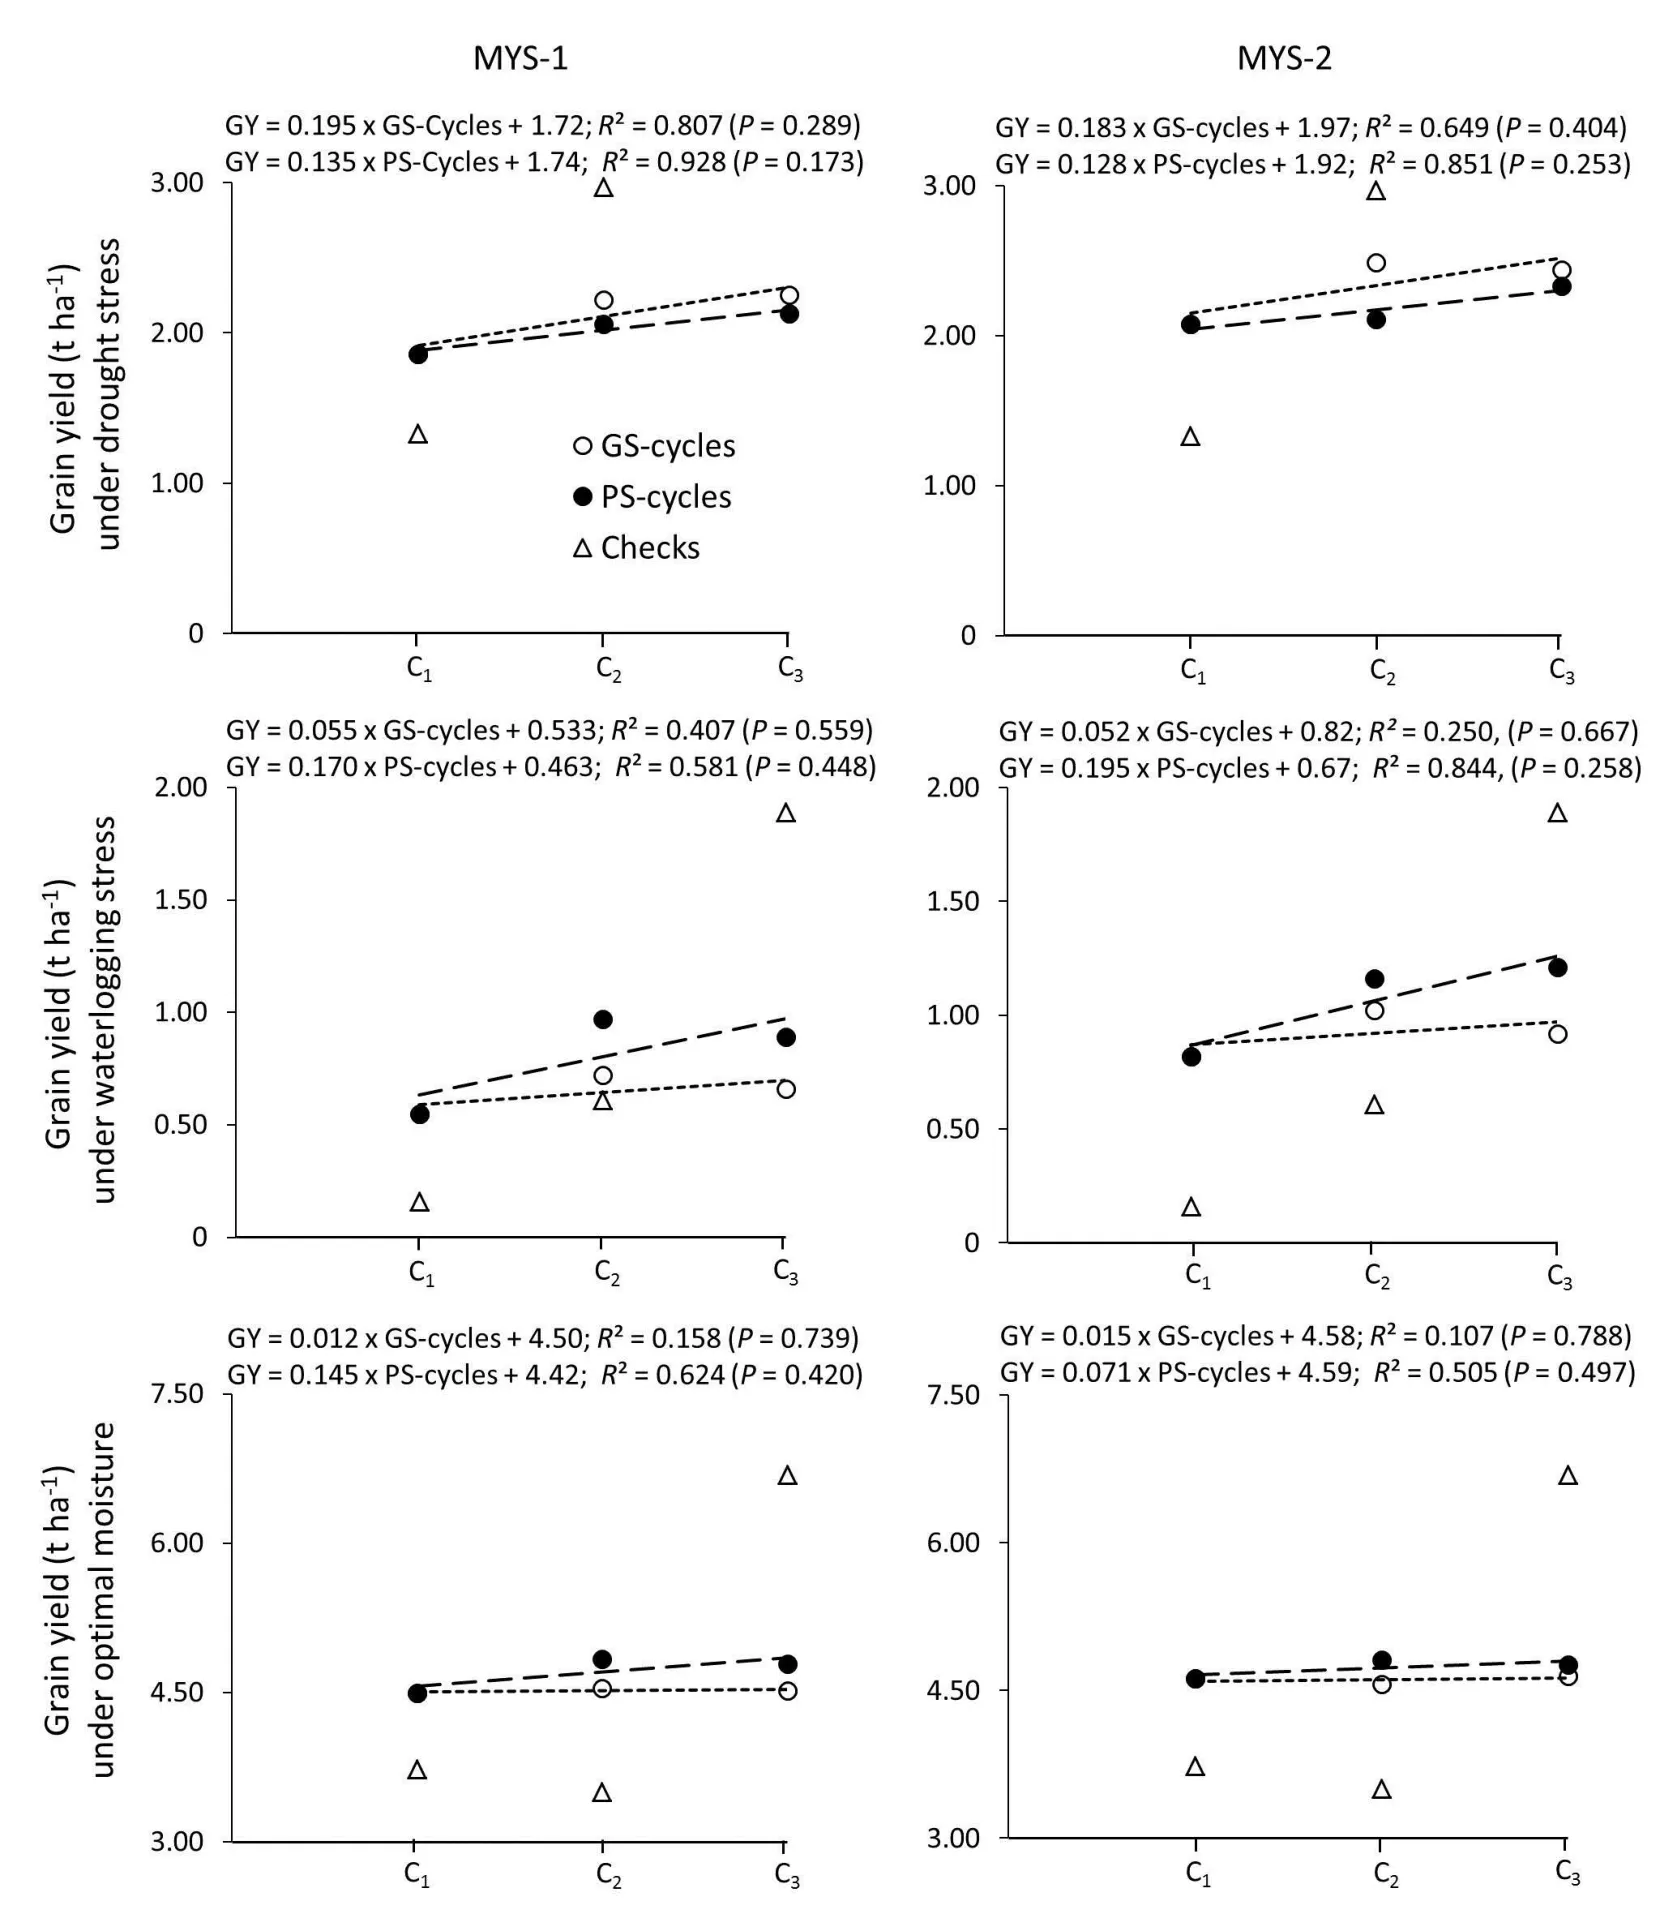
Fig 2.An assessment of genetic gains with phenotypic selection and rapid-cycle genomic selection under drought,waterlogging stress and optimal moisture,based on cycles of selection per se of multiparent yellow synthetic(MYS)populations(R2 values might be inflated because of a relatively small sample size).Symbol for checks indicated means performance of all check entries in the trial.GY,grain yield;GS,genomic selection;PS,phenotypic selection;C1,cycle 1;C2,cycle 2;C3,cycle 3.
3.Results and discussion
To assess the genetic gains with GS or PS,selection cyclesper seand their test-cross progenies were evaluated in separate trials across locations under managed drought and waterlogging stress,and optimal moisture conditions.Correlation analysis conducted using test-cross progenies showed that in case of both GS and PS the relationship between optimal condition performance was positively correlated with drought,but it was negative with waterlogging stress environment(Table S6A).In case of progenies derived PS there was no relationship between drought and waterlogging environment,while it was positive with GS progenies.This is explained with the fact that in GS while selecting the top 5% progenies for constitution next cycle the selection was based on high GEBVs for both drought and waterlogging stress,while in case of PS the individuals were selected separately under managed drought or waterlogging stress based on theirper seperformance under respective stress.Though,with both GS and PS progenies all the correlation among three environments were statistically nonsignificant.Analyses of variance for selection cyclesper seshowed that variation attributable to locations and to genotypes was significant for various secondary traits as well as for grain yield under both drought and waterlogging stress,except that the variation attributable to locations was non-significant for EPP(Table 1).A similar trend was also observed with test-cross progenies of the selection cycles where all the secondary traits and grain yield showed significant variation attributable to locations and genotypes(Table 1).However,genotype×location(G×L)interaction effects were relatively high on grain yield of test-cross progenies compared to selection cycleper seyields under drought as well as under waterlogging stress.Genotypic variability for grain yield and various secondary traits of the selection cycleper seas well as their test-cross progenies was also significant under optimal conditions,except AD and ASI of test-cross progenies.Location effects for all the traits,including grain yield,were highly significant for the test-cross progenies under optimal conditions;though the selection cycleper seshowed non-significant effects for most of the traits,except PH and AD.
The question that we set out to answer through this study was whether progenies derived from the populations improved using RCGS were superior to those developed through phenotypic selection across stress and non-stress environments.Bernardo[8]suggested that gains per cycle might not necessarily be greater with marker-based selection,but markers could increase the gains per unit cost and time.In our study,since simple recurrent PS was conducted,gains per year might not be a decisive factor for comparing realized genetic gains from GS and PS.The predictive ability of the GS scheme was estimated from the 10-fold cross validation study in Cycle C0in MYS-1 and MYS-2 under different managements.In MYS-1,rMP values of 0.52,0.45 and 0.59,and in MYS-2,rMP values of 0.54,0.51 and 0.56 were observed under drought water logging and optimal managements,respectively.Also,therg^gestimated as rMP/✓h2,another measure used for estimating prediction accuracy[9],was high:0.83,0.91 and 0.79 for MYS-1 and 0.87,0.97 and 0.80 for MYS-2 for drought,water logging and optimal managements,respectively.The predictive abilities for grain yield under waterlogging was found to be comparatively lesser than drought stress and optimal management in both the populations[26].The predictive ability was similar to earlier studies on maize grain yield under optimal management conditions[32].
3.1.Changes in mean of plant height,flowering and barrenness
While the main criteria of selection in both GS or PS was grain yield under stress(drought or waterlogging),observations were also recorded on various agronomic traits and used in acrosssites data analysis within each type of moisture regime.Though these traits were not used as criteria during selection cycle advancement.Across-sites results for selection cyclesper seunder optimal moisture conditions showed that there was no significant change in PH,AD,ASI,and EPP after two cycles of GS or PS with respect to their average values in the initial cycle(C1),except PS produced taller plants in the advanced generation(C3)of MYS-2(Table 2).Under drought or waterlogging stress as well,with afew exceptions,such as increase in PH under drought with GS in MYS-1 and reduction in EPP in MYS-1 with both GS and PS,most of the non-targeted traits were maintained under optimal moisture in both the populations after two cycles of GS or PS.Similar trends of non-significant changes in unselected traits under optimal moisture were also observed with selection cycle test-cross(TC)results,except plants were relatively shorter in MYS-1 with PS(Table 3).Under drought stress as well,PH of MYS-1 TC was reduced significantly after two cycles of PS,but no significant change was observed in MYS-2 with GS or PS and in MYS-1 with GS.However,under waterlogging stress,there was no significant change in PH of the selection cycle TCs after two cycles of GS or PS.Days to 50%anthesis of the advanced cycle(C3)of both the populations under drought as well as under waterlogging stress was at par with initial cycle(C1),indicating that maturity group of both the populations was maintained after two cycles of GS or PS.These findings are in accordance with previous studies,where no significant change was found in plant height and anthesis date under drought[17]or under optimal moisture[32]with RCGS.Under optimal moisture,ASI of both populations was maintained.However,under drought,ASI was reduced significantly in both populations after two cycles of GS or PS;though the reduction was relatively higher and significant with GS in both populations.There was a significant decrease in ASI of MYS-1 under waterlogging with two cycles of GS or PS,whereas in the case of MYS-2,it increased with both PS and GS,though the increase was significant only with PS.Reduction in ASI under drought stress was also observed in previous studies with GS or PS in tropical maize[17,18].Under both drought stress and waterlogging stress,there was no significant change in EPP of the two populations with PS,but a significant increase in EPP was observed after two cycles of GS.Correlation analysis among various traits showed that ASI and EPP were significantly correlated with grain yield under drought and waterlogging stress,where the relationship was non-significant under optimal conditions(Table S6B).On the other hand,plant height and days of anthesis was significantly correlated with grain yield under optimal but it was nonsignificant under both stresses.The findings agree with previous studies in maize under drought[28,41]and waterlogging stress[42],and explain the need of managed stress environment for selection and improvement for drought or waterlogging stress,as genotypic variability for the stress-adaptive traits,such as ASI,EPP etc.are not expressed under optimal moisture conditions.
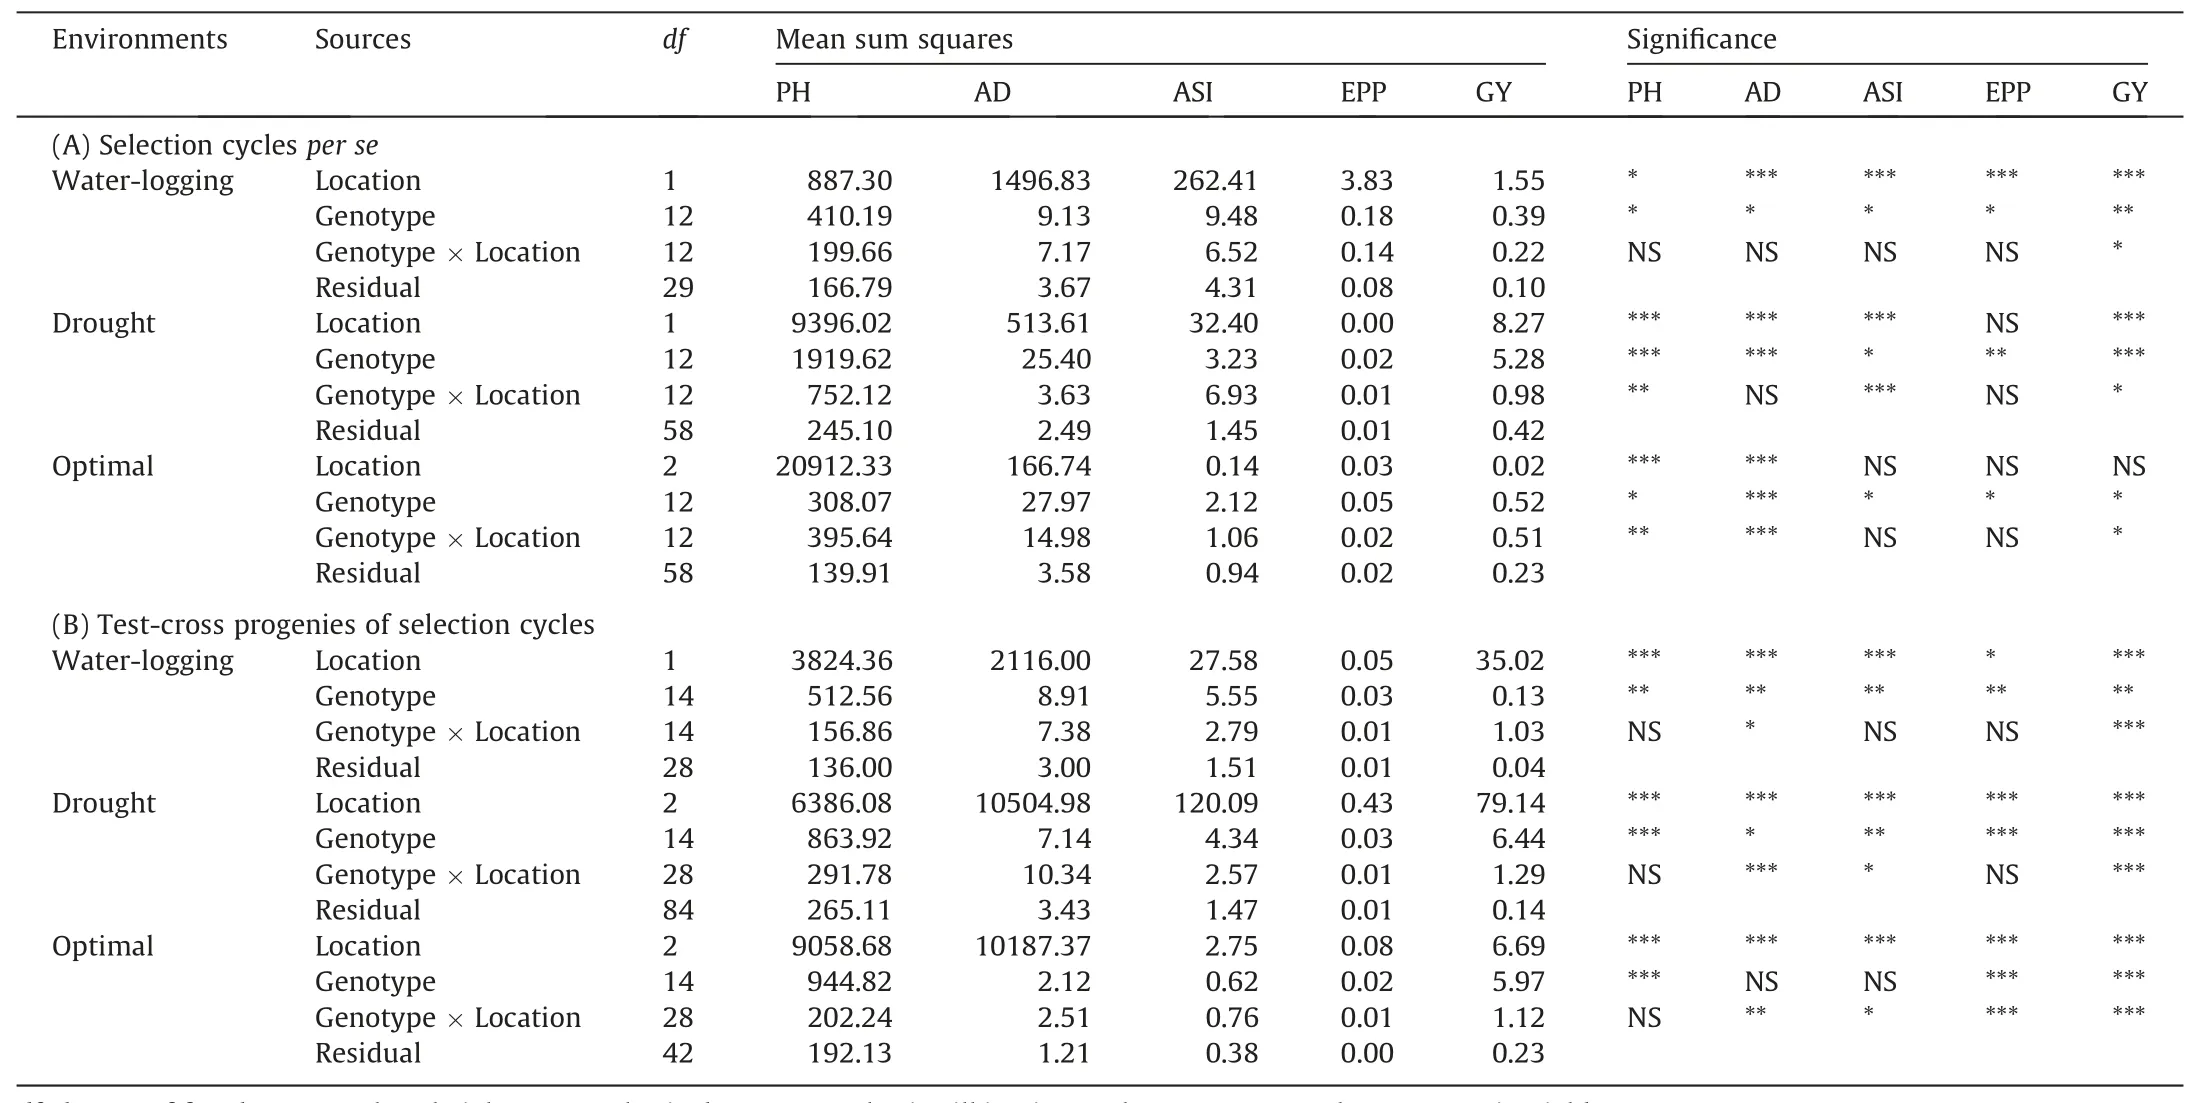
Table 1Analysis of variance for a cross-sites performance of(A)selection cycles per se and(B)test-cross progenies of selection cycles of MYS-1 and MYS-2 evaluated under managed waterlogging and drought stress,and optimal moisture.
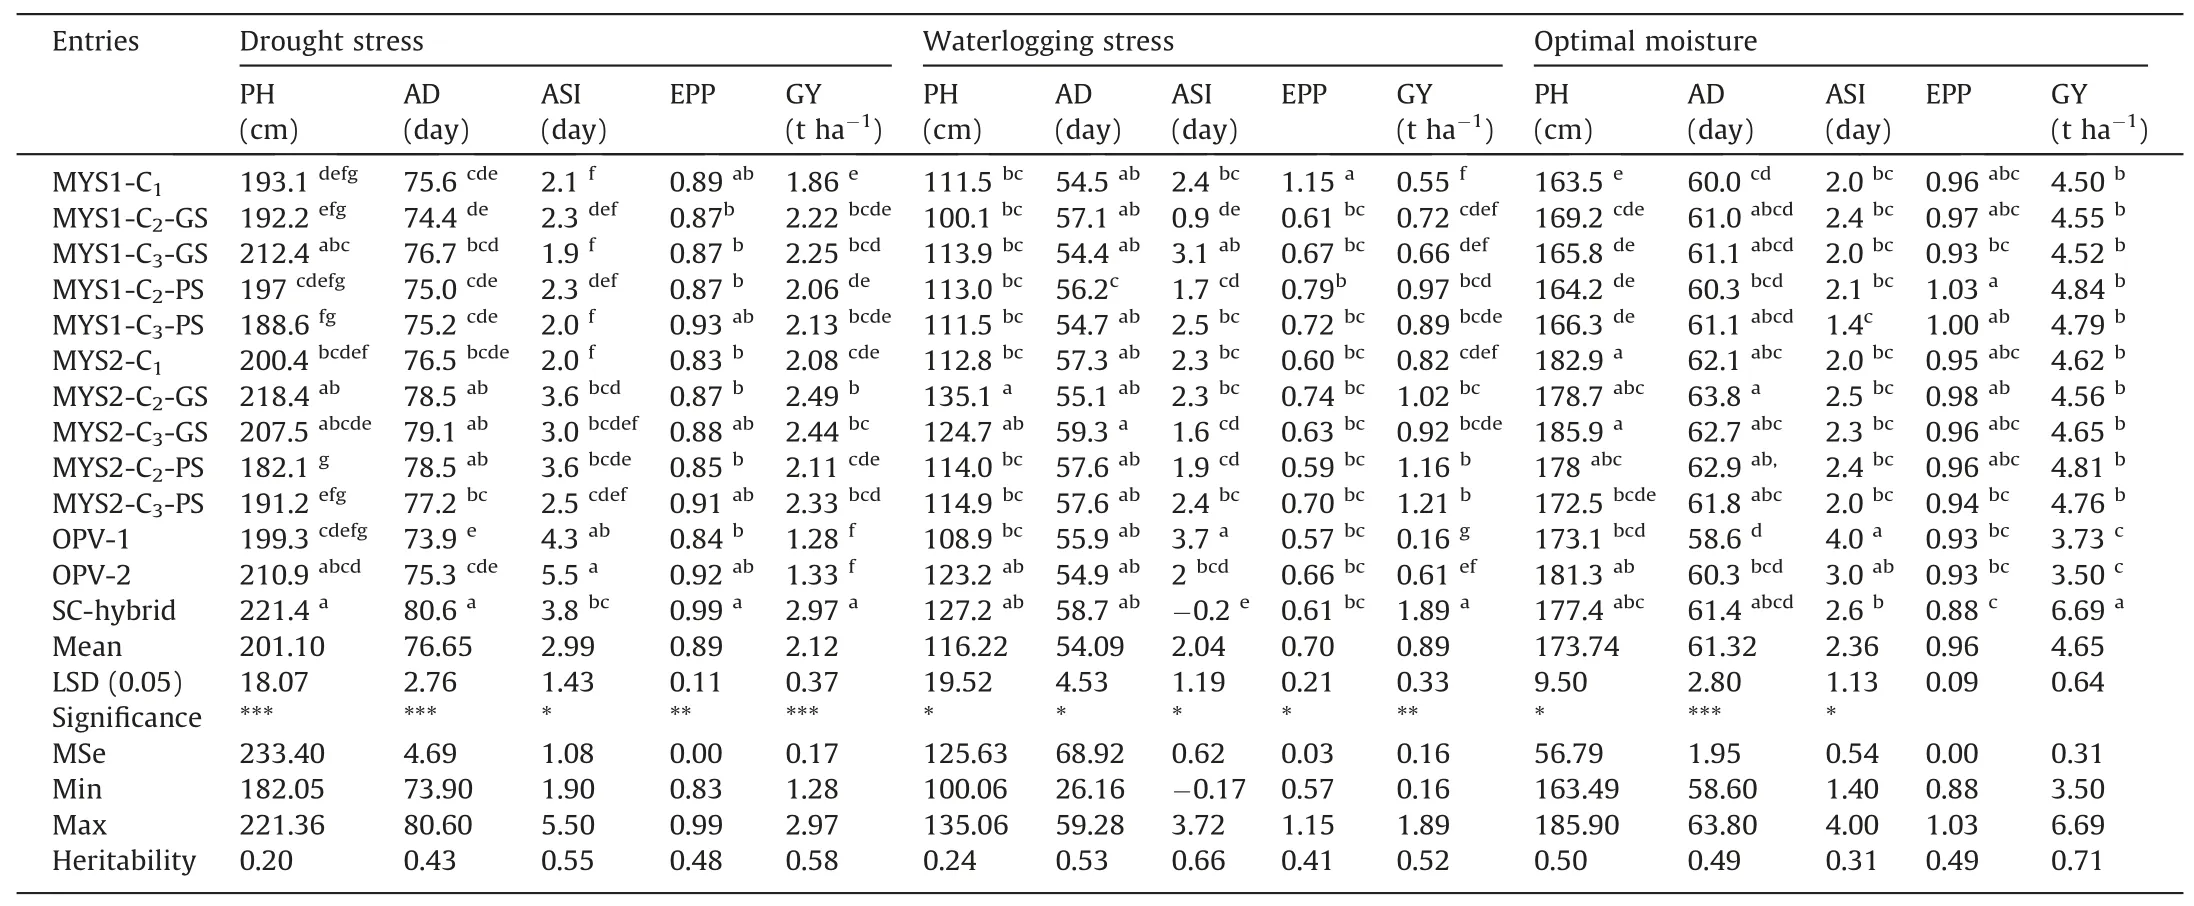
Table 2Across-sites performance of MYS population cycles per se under managed drought,waterlogging,and optimal moisture.
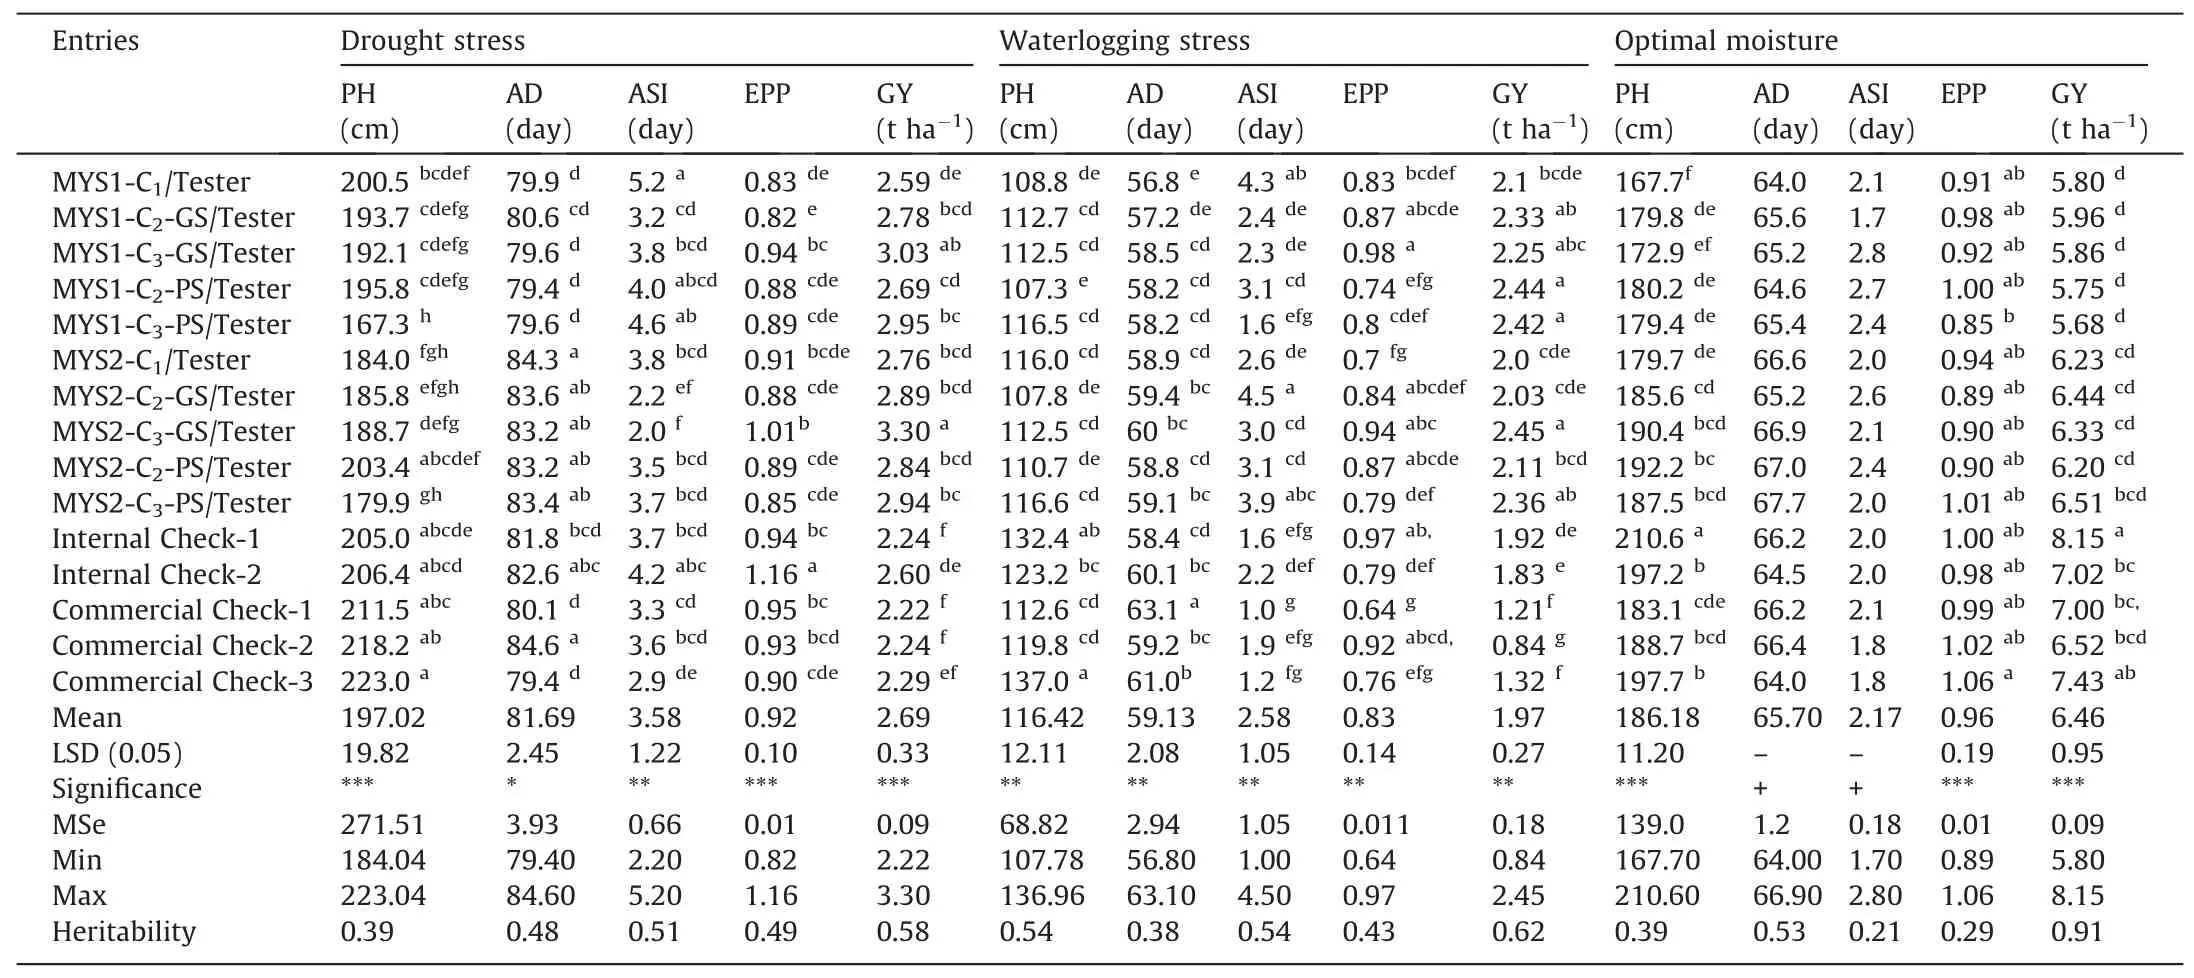
Table 3Across-site performance of test-crosses of selection cycles under managed drought,waterlogging,and optimal moisture.
3.2.Changes in grain yields under different moisture regimes:
Results of evaluating the selection cyclesper seunder drought stress showed that grain yield of both populations increased after two cycles of GS or PS,though the increase was statistically significant only with GS(Table 2).In contrast to drought,both populations showed a significant increase in grain yield under waterlogging stress with two cycles of PS and a relatively small and nonsignificant increase with GS.Under optimal moisture,an increase in grain yield of both populations was observed with two cycles of GS as well as of PS,but the observed increases were statistically nonsignificant.In general,the performance of the initial cycle(C1)of both populations was at par with or better than that of the OPV checks under all the moisture regimes.However,the grain yields of advanced cycle(C3)of both GS or PS were significantly higher than those of the OPVs checks.Also,none of the entries,including selection cycles for two populations and OPV checks,could outperform the hybrid check under optimal or stress conditions.
Evaluation of the test-cross progenies of the selection cycles of the two populations showed that both populations recorded an increase in yield under drought following two cycles of GS or PS,though the increase in grain yield of MYS-2 with PS was statistically nonsignificant(Table 3).Under waterlogging stress as well,there was an increase in grain yield of C3of the two populations compared with their yields in C1.Though the increase was relatively higher and significant with PS in both populations,GS showed a significant increase only in MYS-2.Under optimal moisture,there was no significant change in grain yields of selection cycle TCs of both populations with GS or PS.Under both drought and waterlogging stresses,the TCs of the improved selection cycle(C3)of the two populations outperformed the check hybrids in the trial.These commercial checks were among the best hybrids available to farmers in the region.Under optimal moisture,the performance of commercial check hybrids was at par or superior to that of TCs of improved cycles of both populations.
3.3.Genetic gains with GS or PS in grain yields across moisture regimes
Assessment of gain in grain yield based on the selection cycleper se(Fig.2)or test-crosses of different selection cycles of GS or PS(Fig.3)showed varied responses under different moisture regimes.Regression analyses of mean grain yields of selection cyclesper seon a number of selection cycles under drought stress or waterlogging stress indicated that both populations responded almost similarly to GS as well as to PS for both stresses(Fig.2).In contrast,TCs of selection cycles showedat paror higher gains with GS compared with PS under both drought and waterlogging stresses,with the exception of MYS-1,which showed relatively higher gains under waterlogging stress with PS(Fig.3).The two populations responded differently to GS,as MYS-2 showed relatively better gains than MYS-1 for both drought stress and waterlogging stress tolerance(Fig.3).These findings suggested that response to GS varied with the constitution of the base population and the strength of the trait donors involved[28,43].Lian et al.[44]stated that they were unable to precisely predict a genotypic value for each population and that the outcome of genome-wide selection decisions would be poor if genotypic value happened to be low in a particular test population.
Data on test-cross progeny of selection cycles showed that,except for PS in MYS-2,both GS and PS showed relatively larger gains per cycle under drought stress as compared with waterlogging stress(Fig.3).The trend was slightly different with selection cycleper seevaluation results,where gains were larger under waterlogging with PS,whereas under drought stress,both populations showed relatively higher gains with GS(Fig.2).More gains under drought stress compared with waterlogging stress can be explained by the fact that CIMMYT’s drought tolerance breeding program is comparatively much stronger and mature than its waterlogging tolerance breeding program.Four decades of research on improving drought tolerance in maize resulted in constitutive changes in improved maize populations and inbred lines derived from these populations[36].The magnitude of genotypic variance for drought tolerance[5]and,therefore,the scope for selection and improvement using the GS or PS approach are relatively higher for drought stress than for waterlogging stress.The low response to GS for waterlogging tolerance may be attributed to a relatively narrow genetic base and,therefore,genotypic variability and constitutive changes in stress-adaptive traits are relatively small in waterlogging trait donors[41]in comparison to drought lines.This explains the low predicted genotypic accuracy for grain yield under waterlogging stress.
Analyses of genetic gains using selection cyclesper seas well as their test-crosses showed that under waterlogging stress,gains with PS wereon parwith or better than those with GS.Under managed waterlogging stress,phenotypically superior plants were selected based on secondary traits associated with waterlogging tolerance[43,45]along with grain yield at harvest,whereas in the case of GS,it was based only on relatively high GEBVs for grain yield under stress.The selected waterlogging tolerant plants were directly used in developing inter-cross progenies with selected drought tolerant plants and in constituting the next cycle;therefore,gains were relatively larger with PS under waterlogging.Drought tolerance in maize is a polygenic trait for which additive genetic variance and narrow-sense heritability are moderate to high for yield under managed drought[46,47].Dominance genetic variance was equally important and needed to be considered in selection programs for improving yield under drought stress.Zaidi et al.[48]found that both additive and nonadditive genetic effects were important for waterlogging tolerance in tropical maize.However,additive effects were comparatively more important,and along with heterosis,significantly contributed to waterlogging tolerance.
Annual genetic gain per hectare was calculated considering the four years starting from the first intermating of parental lines for constituting the base populations up to the harvesting of C3seeds(Fig.1).The realized genetic gain with selection cycleper sefor drought stress was 98 and 91 kg ha-1year-1with GS,and 67 and 64 kg ha-1year-1with PS in MYS-1 and MYS-2,respectively.However,except for MYS-2 with PS,the realized genetic gains for TC under drought stress were relatively higher,i.e.110 and 135 kg ha-1year-1with GS,and 90 and 43 kg ha-1year-1with PS in MYS-1 and MYS-2,respectively.Similarly,under waterlogging stress,the selection cycleper seevaluation showed 28 and 85 kg ha-1year-1gain in MYS-1,and 25 and 98 kg ha-1year-1in MYS-2 after two cycles of GS and PS,respectively.When the analysis was conducted using TC progenies of selection cycles derived through GS,the gains under waterlogging stress were relatively higher,i.e.38 and 113 kg ha-1year-1in MYS-1 and MYS-2,respectively.However,in the case of PS,the realized genetic gains with selection cycleper seor their TC evaluation wereat par,i.e.80 and 90 kg ha-1year-1in MYS-1 and MYS-2,respectively.Beyene et al.[17]reported a gain of 70 kg ha-1year-1in grain yield with RCGS for drought stress tolerance in biparental populations.Our study showed comparatively larger gains under drought stress,which is explained by the different types of populations used in the two studies.Previous studies have also suggested that genomic-enabled prediction accuracy of a multiparent population was higher than the accuracy achieved within a single population[24,25].Relatively more gains might also be contributed by the greater allelic diversity in multiparent population[22],along with increased polymorphism and recombination as compared to biparental populations[23],where plants may be able to adopt multiple tolerance mechanisms to cope with stress conditions[49].
Genetic gains in grain yields were not consistent between different selection cycles and also under different evaluation environments(Figs.2,3).Zhang et al.[32]also observed inconsistent gains in grain yield in different selection cycles in multiparent populations subjected to four cycles of RCGS.Analysis of test-cross progenies showed a linear gain in grain yield with GS or PS from C1to C3under both stresses(Fig.3),though both populations showed relatively larger gains from C2to C3in comparison with C1to C2,with the exception of MYS-1 under waterlogging.The linear gain from C1to C3indicated the contribution of the common tester used in developing TCs of all the selection cycles(C1,C2,and C3)of PS or GS.The relatively higher gains in C3can be explained by the fact that C2was constituted based on one round of selection of recombinants in C1,and the targeted selection of new recombinants in C2to constitute C3,which resulted in increased desirable allele frequency for stress tolerance[17].Simulation studies have also shown that after multiple cycles of GS,gains were slightly larger if selection in first cycle was based on phenotypic values instead of a combination of phenotype and a marker index[50].The selection cycle per se evaluation results showed more gains in grain yield from C1to C2,although there was a reduction in grain yield from C2to C3in MYS–2 with GS for drought and waterlogging tolerance and in MYS-1 with both GS and PS under waterlogging stress.These contrasting trends between selection cycles per se and their test-cross evaluation can be explained by the fact that initial cycle(C1)was more heterozygous/heterogeneous and it gradually reduced in advanced cycles(C2and C3)with two rounds of recombination using sib-mating.More homozygous/homogeneous advanced cycle(C3)showed increased heterosis compared with initial cycle(C1),which resulted in relatively high yields of C3test-crosses and therefore relatively more gain from C2to C3than from C1to C2.These findings suggested that selection cyclesper seor their test-cross progenies can be used to estimate genetic gains.However,the choice depends on the type of final product(hybrids vs.OPVs)that a breeding program is targeting.If they are targeting hybrid-oriented products,then test-cross progenies of selection cycles would be more appropriate for genetic gain analysis;otherwise,selection cycle per se evaluation would be good enough,if the targeted final products are OPVs.
There were small and non-significant yield gains under optimal moisture,along with significant gains for targeted traits,i.e.,grain yield under drought and waterlogging stress(Figs.2,3).Under optimal moisture,both selection cycleper seand TC evaluation results showed relatively more gains with PS than with GS,except in the case of MYS-1 test crosses,where there was a nominal reduction in grain yield after two cycles of PS.Relatively greater gains with PS can be explained this way:while selecting for stress-tolerance,breeders do not ignore good plant type and other key agronomic traits that eventually contribute to grain yield under optimal moisture.Zhang et al.[32]reported a gain of 100 kg ha-1year-1with RCGS for grain yield under optimal moisture using multiparent populations,which may not be comparable to the realized gains in our study,as we have targeted GS for grain yield under drought and waterlogging stress.
4.Conclusions
Developing stress-resilient maize germplasm with combined tolerance to two polygenic traits is challenging but not impossible.Multiparent populations developed using promising lines with good combining ability,including trait donors for targeted traits,along with productive parental lines of high-yielding hybrids,are a suitable option as a base population to develop maize germplasm with high stable performance across stress and non-stress environments.However,the differential response to RCGS in two populations suggested that further study is required to develop a mathematical model that can predict the efficacy of base populations and discard relatively poor responding population(s)at an early stage of RCGS to save cost on genotyping,field evaluation for genetic gains etc.Genetic gains were realized with both GS and PS,with relatively greater gains with GS under drought stress,whereas under waterlogging,PS was eitherat paror superior to GS.Realized genetic gains per year across moisture regimes demonstrated the strength of GS-assisted selection and recombination to simultaneously improve for drought and waterlogging tolerance without compromising yields under optimal conditions.Results of this study would be useful to maize or other crop breeding programs targeting high yielding genotypes with enhanced resilience to cope with multiple stresses,such as variable moisture regimes in TPE within same season.
CRediT authorship contribution statement
Pervez Haider Zaidi,Madhumal Thayil Vinayan,and Raman Babuconceptualized and planned the experiments;Reshmi Rani Das and Kaliyamoorthy Seetharamexecuted the experiments and analysed data;Manish Patel,Ramesh Kumar,Shyam Bir Singh,Jai Prakash Shahi,Akashi Sarma,and Nagendra Sarma Baruahelped in generating across location phenotyping data.
Declaration of competing interest
The authors declare that they have no known competing financial interests or personal relationships that could have appeared to influence the work reported in this paper.
Acknowledgments
The authors thank funders BMZ/GIZ,Germany for the financial support to the project‘‘Climate-resilient maize for Asia”(Project No.15.7860.8-001.00).Financial support from the CGIAR Research Program MAIZE towards supporting part of staff time through W1/2 is duly acknowledged.
Appendix A.Supplementary data
Supplementary data for this article can be found online at https://doi.org/10.1016/j.cj.2021.03.012.
- The Crop Journal的其它文章
- WheatGene:A genomics database for common wheat and its related species
- A gain-of-function mutation of OsMAPK6 leads to long grain in rice
- Genetic dissection of rice appearance quality and cooked rice elongation by genome-wide association study
- The importance of aboveground and belowground interspecific interactions in determining crop growth and advantages ofpeanut/maize intercropping
- Mining favorable alleles for five agronomic traits from the elite rapeseed cultivar Zhongshuang 11 by QTL mapping and integration
- BSA-seq-based identification of a major additive plant height QTL with an effect equivalent to that of Semi-dwarf 1 in a large rice F2 population