Effect of fasting on protein metabolism in muscle tissue of Larimichthys crocea revealed by transcriptome and proteome*
Yu ZHANG ,Weiliang SHEN , ,Juan LI ,Baoxiao ZHENG ,Zhengjia LOU ,Mohammad Aslam HOSAIN ,Baoying QIAN ,,Liangyi XUE ,
1 College of Marine Sciences, Ningbo University, Ningbo 315832, China
2 Ningbo Institute of Marine and Fisheries, Ningbo 315103, China
3 School of Life Science, Taizhou University, Taizhou 318000, China
Abstract The large yellow croaker (Larimichthys crocea) is an important mariculture fish in China.Farmed large yellow croaker undergo periods of fasting to adapt to the environment or to improve meat quality.To better understand the physiological responses of their muscle tissues to fasting stresses,we analyzed the transcriptomes and proteomes of both normally-fed and fasting fish groups and identified 7 578 differentially expressed genes (DEGs) and 297 differentially expressed proteins (DEPs) among them.Gene ontology and KEGG analysis showed that the enriched biological pathways were mainly involved in various synthetic and catabolic pathways,especially the protein metabolism.Based on the omics data,nine DEGs related to muscle composition (CAN3,MYL3,and TNNC2),growth (MSTN and MYF5),autophagy (TSC2 and ULK1),and the ubiquitin proteasome pathway (PRS6B and UCHL3) were examined using qPCR.In response to fasting stress,MYL3 and TNNC2 were significantly downregulated,while genes associated with autophagy and the ubiquitin proteasome pathway were significantly upregulated.In response to fasting stress,MYL3,TNNC2,and MYF5 positively correlated with muscle growth were significantly downregulated,while inhibiting growth MSTN and genes associated with autophagy and the ubiquitin proteasome pathways were significantly upregulated.These results clarify the effects of fasting on metabolic changes in their muscle components and growth at the molecular level.
Keyword:Larimichthys crocea;fasting;transcriptome;proteome;muscle
1 INTRODUCTION
Accurate sensing of and responding to nutrientderived signals is a fundamental challenge faced by all living organisms.Food is the source of energy for the body,and in the event of its deprivation,the body immediately triggers a variety of physiological responses in order to survive and maintain balanced growth,initiating various substance metabolisms and energy consumption techniques (Takahashi et al.,2011).These responses further affect the structures of important tissues and organs.
Protein-associated processes,including synthesis and degradation,are pivotal for various metabolisms;the protein metabolism mediates animal growth and is affected by fasting.Muscles,which are the largest protein storage reservoir,provide amino acids for catabolism and are also the main location for metabolic activities.Thus,muscles consume large amounts of energy (Taillandier et al.,2004;Lecker et al.,2006).The major proteolytic systems in the muscle include the calpains (Goll et al.,1992),the ubiquitin-proteasome system (Solomon and Goldberg,1996),and the autophagy-lysosome system (Ilian and Forsberg,1992).Previous studies have shown that protein synthesis (KS) decrease markedly in the muscles of the Arctic charr (Salvelinusalpinus) after 36 d of food deprivation (Cassidy et al.,2016),and that the ubiquitin proteasome pathway in fish is affected by food availability (Seiliez et al.,2008,2013;Yang et al.,2019).In addition,fasting leads to structural changes in muscles.For example,muscle fibers inPleuronectesamericanuswere smaller and had reduced cross-sectional areas after starvation(Maddock and Burton,1994).
The large yellow croaker (Larimichthyscrocea) is one of the most economically important marine fish species in China.In fact,China produces larger yellow croaker than any other marine fish (Wang et al.,2016;Sun et al.,2017).Due to changes in environmental conditions and food availability,cage-cultured fish may experience periodic food shortages (Aranda et al.,2001).In winter,large yellow croaker would undergo fasting for almost three months.Previous reports of the effects of fasting on large yellow croaker have primarily focused on meat quality,antioxidants,fatty acid metabolism,and serum biochemical parameters(Zhang et al.,2008;Qian et al.,2016).Relatively fewer studies have investigated the effects of fasting on the muscle protein metabolism.The available studies have shown that protein mobilization and turnover occur during teleost fasting and refeeding(Black and Love,1986;Mommsen,2004;Rescan et al.,2007;Salem et al.,2007).
Recent studies have reported the transcriptome and proteomes of several aquatic animals,including the Japanese eel (Anguillajaponica) (Tse et al.,2013),marine polychaetes (Annelida) (Neave et al.,2012),rainbow trout (Oncorhynchusmykiss) (Long et al.,2015),andTrachidermusfasciatus(Ma et al.,2018).To further understand and explore metabolism pathways in muscle of large yellow croaker in response to fasting,label-free quantitative proteomics in combination with the Illumina HiSeq TM 2500 sequencing technology was used.Moreover,realtime quantitative PCR (qPCR) was used to analyze the effects of fasting on the expression levels of genes associated with the protein metabolism and muscle growth.Our results provided new information on the molecular mechanism underlying the fasting response of the protein metabolism in large yellow croaker muscles.
2 MATERIAL AND METHOD
2.1 Experimental animal
We randomly selected 204 large yellow croakers(initial mean weight:308.33±6.67 g) from Xiangshan Bay,Ningbo,Zhejiang Province,China,all originating from the Minyou No.1 strain.They were evenly assigned into six cages (1.5 m×1.5 m×2.0 m) and acclimated to the experimental conditions for 7 d,during which they were fed suffi ciently at 5∶00 am and 17∶00 pm every day.After the acclimation period,fish in three cages (experimental group) were fasted for 21 d and those in the remaining three cages (control group) were continued to be fed as before.All cages were maintained at a temperature of 22 °C and a salinity of 24.At the end of the experiment (21 d),five fish were randomly selected per cage and their muscle tissues were collected.All the samples were snapfrozen in liquid nitrogen and were stored at -80 °C.
2.2 RNA isolation,Illumina sequencing,and data analysis
Total RNA was extracted from 30 mg of each muscle tissue sample (from the 21-d fasted and nonfasted fish) using tissue RNA kits (Omega,China)following the manufacturer’s instructions.The purity,integrity,and concentration of each total RNA sample were determined using a Kao K5500 Spectrophotometer(Kao,Beijing,China),1% agarose electrophoresis,and Agilent 2100 RNA Nano 6000 Assay Kits (Agilent Technologies,CA,USA),respectively.The mRNA was enriched using magnetic beads with Oligo (dT)and then used to synthesize double-stranded cDNA.The purified double-stranded cDNA was used to construct sequencing libraries.The sequencing library generated from the muscle tissues of 21-d fasted fish were designated“M7E”,while control libraries were designated“M7C”.The constructed libraries were sequenced using Illumina HiSeq 2500.Furthermore,TopHat (Langmead et al.,2009) and Bowtie2(Langmead et al.,2009) were used to compare the sequences of each group with the reference genome.Reads per kilobase of exon model per million mapped reads (RPKM) (Wagner et al.,2012) were used to estimate the expression levels of genes in each group.DEGseq was used to identify differentially expressed genes (DEGs),i.e.,the genes that are considered differentially expressed when ǀlog2Ratioǀ is ≥1 andqvalue is <0.05 (Wang et al.,2010).These DEGs were annotated using databases such as NCBI,Ensemble,GO,and KEGG to obtain detailed description.Blast2GO was used to obtain the GO terms corresponding to each gene,and a hierarchical clustering analysis of the DEGs was performed using R Ver.3.1.1.A directed acyclic graph (DAG) was used to visualize the GO enrichment of the DEGs.The Kyoto Encyclopedia of Genes and Genomes pathway annotations were generated using the KEGG database.
2.3 Protein extraction and digestion
Total protein was extracted from 100 mg of each muscle tissue sample (from the 21-d fasted and nonfasted fish) using the TRIZOL method.Next,200-μg total protein from each sample was mixed with 200 μL of UA buffer (8-mol/L urea (Sigma,U5128) in 0.1-mol/L Tris-HCl,pH 8.5).Subsequent steps were performed following a previous study (Long et al.,2015),with minor modifications.For example,the centrifugal speed in our study was 12 000×gbut not 14 000×g;then,formic acid,at a volume ratio of 100∶1 NH4HCO3∶formic acid,was added to the filtrate and lyophilized.Finally,20-μL 0.1% formic acid was dissolved and desalted for treatment.
2.4 Label-free LC-MS analyses
Label-free liquid chromatograph-mass spectrometer(LC-MS) was performed using an Easy-nanoLC 1000(Thermo Scientific,Waltham,MA,USA),following a previous study (Hu et al.,2017) but with a modified gradient.Here,mobile phase A was ddH2O with 0.1%formic acid and mobile phase B was acetonitrile(ACN) with 0.1% formic acid.The gradients were as follows:0–5 min,3%–8% B;5–45 min,8%–25% B;45–52 min,25%–32% B;52–55 min,32%–90% B;and 55–60 min,90% B.The column flow was 250 nL/min.Raw MS data were analyzed by using Thermo Scientific Proteome Discoverer Ver.1.4 to identify,characterize,and quantify proteins.DAVID 6.7 (Huang et al.,2008,2009) was used to perform the GO annotation and KEGG pathway analysis of the DEPs between the muscle tissues of the 21-d fasted fish and the control fish.All figures were plotted using R Ver.3.0.We also analyzed the relationships and trends between the DEGs and DEPs based on the results of differential expression analysis.
2.5 cDNA synthesis and qPCR
Total RNA was extracted from 30 mg of the muscle tissue samples (from the 21-d fasted and non-fasted fish) using tissue RNA kits (Omega,China),following the manufacturer’s instructions.First-strand cDNA was synthesized using the PrimeScript RT Reagent Kit(TaKaRa,Japan),following the manufacturer’s instructions.qPCRs were then performed using an ABI 7500 Fast (Applied Biosystems,USA) with SYBR Premix Ex Taq II (TaKaRa,Japan),following the manufacturer’s instructions.As a reference control,levels ofβ-actinwere quantified in parallel with the target genes.The mRNA expression levels of26S proteasome regulatory subunit 6B(PRS6B),serine/threonineprotein kinase ULK1(ULK1),calpain-3(CAN3),tuberoussclerosiscomponent2(TSC2),myostatin(MSTN),ubiquitin carboxy-terminal hydrolase 3(UCHL3),myosinlightchain3(MYL3),troponinC-skeletalmuscle(TNNC2),andmyogenicfactor5(MYF5) were assessed using real-time fluorescent quantitative PCR.All samples were evaluated in triplicate.Normalization and fold change values were calculated using the 2-ΔΔCtmethod.Primers for all amplified genes using qPCR are listed in Table 1.GraphPad Prism 6 (GraphPad Software Inc,San Diego,CA,USA) was used to analyze all data.Values were considered statistically significant whenP<0.05.
3 RESULT
3.1 Illumina sequencing and label-free identification
The transcriptome sequencing of the control group(M7C) and the 21-d fasted group (M7E) generated 48 106 982 and 52 531 884 raw reads,respectively.The raw data files were submitted to the NCBI Sequence Read Archive (SRA),under accession number SRP063956.Raw read data were cleaned via several processes,including removing low-quality sequences and de-junction contamination,to obtain 44 088 640 and 47 939 876 clean reads for M7C and M7E,respectively.Using the selection criteria ǀlog2Ratioǀ≥1 andq-value<0.05,a total of 7 578 DEGs were identified (5 122 up-regulated and 2 456 downregulated).These DEGs were visualized using a volcano plot (Fig.1) and clustered based on RPKM values (Fig.2).
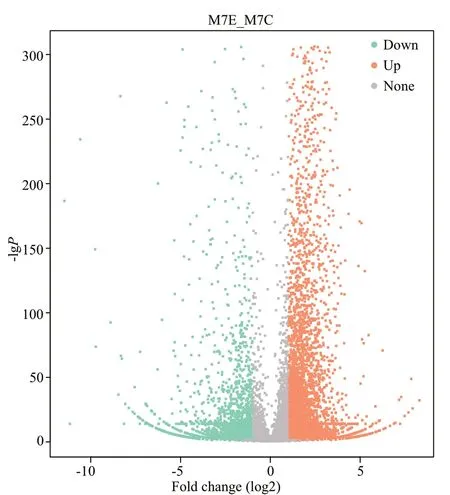
Fig.1 Volcano plot showing the genes in M7C and M7E
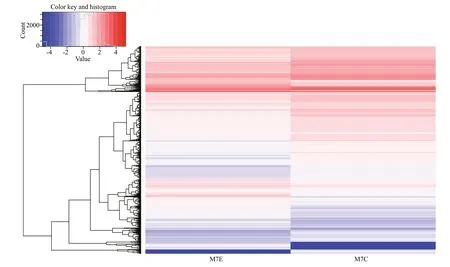
Fig.2 Heat map of the differentially expressed gene clusters
DEPs were quantitatively identified based on analysis of the proteomic data using Scaff old.In total,297 significant DEPs were identified (where ǀfoldchangeǀ ≥2 andq-value <0.05):179 up-regulated,and 121 down-regulated.The DEPs mainly included myosin heavy chain,myosin light chain,40S ribosomal protein,26S protease regulatory subunit,calciumtransporting ATPase,proteasome subunit,eukaryotic translation initiation factor,and ubiquitin carboxylterminal hydrolase (Supplementary Table S1).
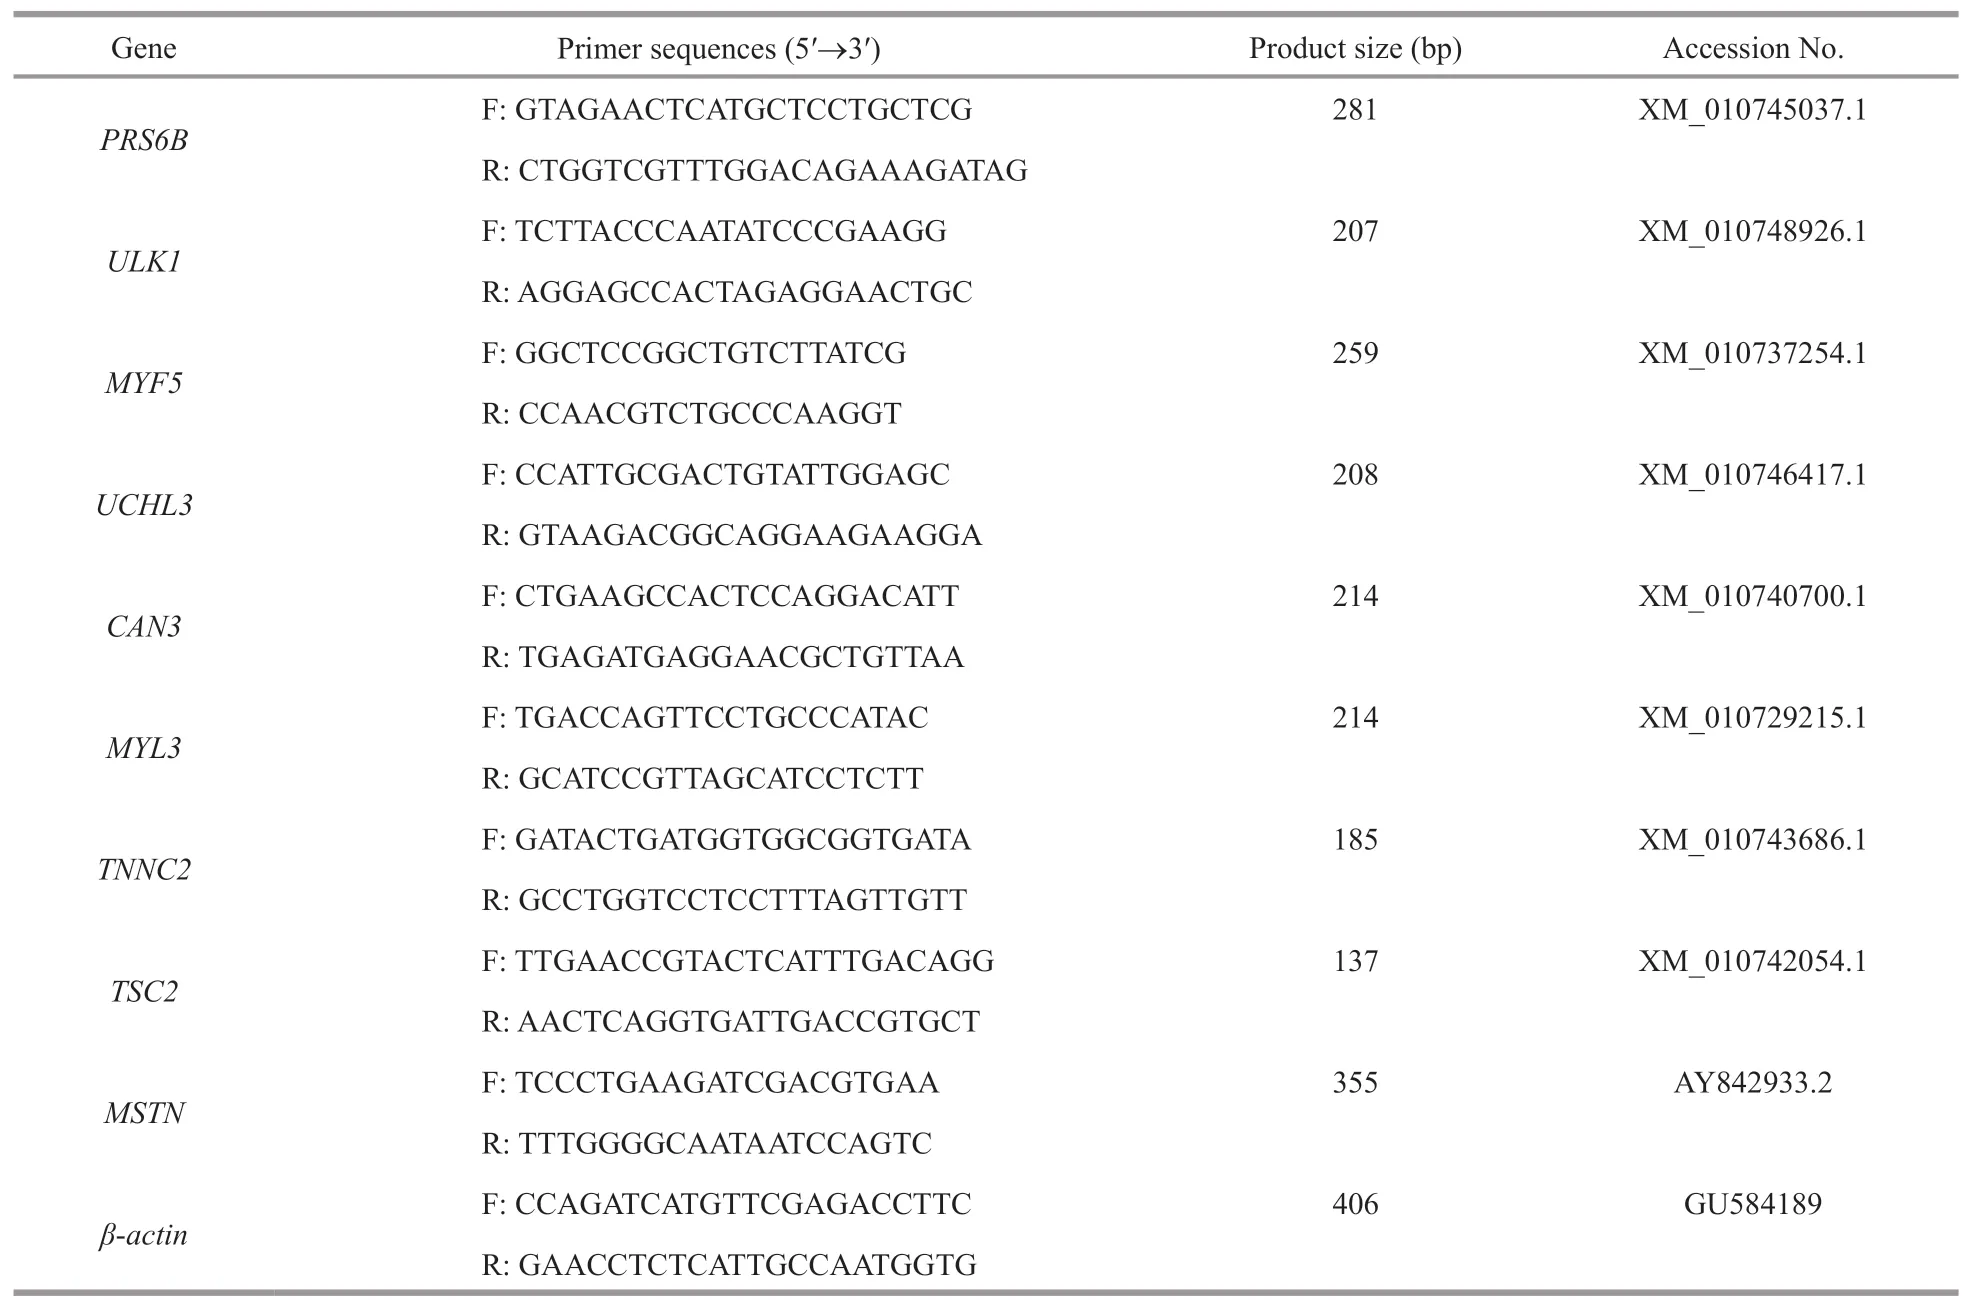
Table 1 Primers used for qPCR
3.2 GO analysis of differentially expressed transcripts and proteins
To determine whether DEGs and DEPs were significantly enriched in certain functional types,weused GO,an international standardized gene functional classification system,to annotate them.
The biological process (BP) terms most highly enriched in the DEGs included ribosomal biogenesisassociated protein complexes,various RNA processing and metabolisms,and the cellular amino acid metabolism,while the cellular component (CC)terms the most highly enriched in the DEGs included the ribosome proteasome complex,proteinaceous extracellular matrix,eukaryotic translation initiation factor 3 complex,troponin complex,and proteasome regulatory particle.The molecular function (MF)terms most highly enriched in the DEGs included structural constituent of ribosome,RNA binding,tRNA binding,and aminoacyl-tRNA ligase activity.
Only CC and MF terms were overrepresented in the 297 DEPs;BP terms were not significantly enriched.Proteins in the control group were only overrepresented in MF terms,including ribonucleotide binding,purine ribonucleotide binding,purine nucleotide binding,and nucleotide binding.In contrast,proteins in the fasting group were enriched in both MF terms (e.g.,ATP binding,adenyl ribonucleotide binding,adenyl nucleotide binding,and motor activity) and CC terms (e.g.,cytoskeletal part,myosin complex,and cytoskeleton;Fig.3).
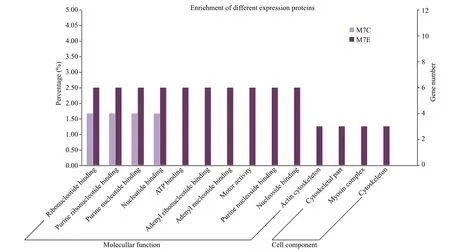
Fig.3 Gene ontology (GO) analysis of the 297 proteins differentially expressed in response to fasting
3.3 KEGG functional annotation
KEGG analysis indicated that the DEGs were mainly associated with ribosomes,aminoacyl-tRNA biosynthesis,oxidative phosphorylation,proteasomes,actin cytoskeleton,tumor necrosis factor (TNF)signaling pathway,and phosphocreatine inositol metabolism (Supplementary Table S2).Most of the DEGs associated with ribosomes,aminoacyl-tRNA biosynthesis,oxidative phosphorylation,and proteasomes were upregulated (Fig.4),while most of the DEGs associated with the regulation of the actin cytoskeleton pathway were downregulated (Fig.5).In addition,many DEGs associated with autophagy regulation (Fig.6) and the mTOR signaling pathway was upregulated,but these two pathways were not significantly enriched.
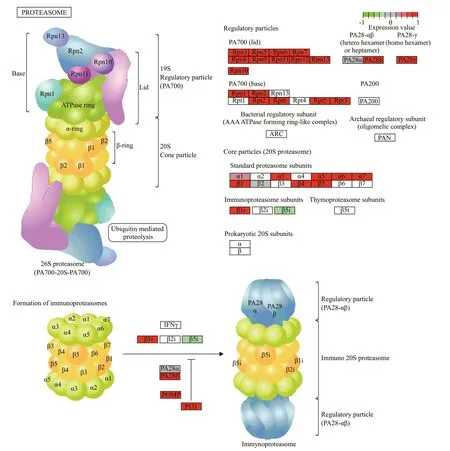
Fig.4 Significant DEGs in the proteasome pathway
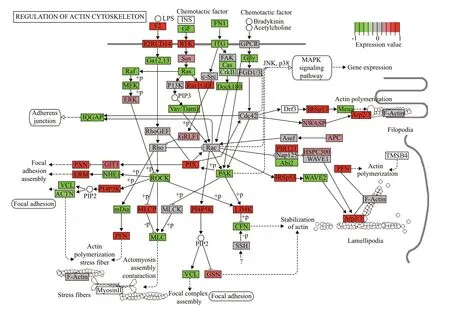
Fig.5 Significant DEGs in the actin cytoskeleton pathway
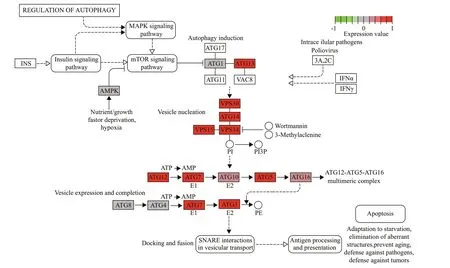
Fig.6 Significant DEGs in the autophagy regulation pathway
The DEPs were mainly associated with metabolic pathways,secondary-metabolite biosynthesis,the microbial metabolism in diverse environments,and antibiotic biosynthesis.However,the pathway enrichment analysis showed that KEGG pathways were not significantly enriched.
3.4 Associations between the transcriptome and proteome data
We identified 297 differentially expressed proteins in the proteome and analyzed 25 of them as well as their corresponding genes.We found that 13 of the 25 protein/gene pairs were upregulated in both the transcriptome and proteome,including 26S protease regulatory subunit 6B,ubiquitin carboxyl-terminal hydrolase,40S ribosomal protein S13,60S ribosomal protein L7a,and NAD(P)H-hydrate epimerase.In contrast,six of the 25 protein/gene pairs were both downregulated,including creatine kinase M-type,fructose-bisphosphate aldolase B,and myosin light chain 3 (Supplementary Table S3).
3.5 qPCR analysis of the DEGs
We used qPCR to validate the expression levels of nine of the DEGs detected using RNA-seq analysis:PRS6B,ULK1,CAN3,TSC2,MSTN,UCHL3,MYL3,TNNC2,andMYF5.Of these genes,two encoded myofibrillar proteins (MYL3 and TNNC2),two encoded proteins involved in muscle growth (MYF5 and MSTN),and four encoded proteins closely related to protein degradation (PRS6B,ULK1,TSC2,and UCHL3).The final protein,CAN3,plays a key role in the degradation of myofibrillar proteins.The transcript levels of these nine candidate genes were significantly(P<0.01) different between the control and 21-d fasted fish.The upregulated genes werePRS6B,ULK1,CAN3,TSC2,MSTN,andUCHL3,while the downregulated genes wereMYL3,TNNC2,andMYF5(Fig.7).Moreover,the qPCR results were consistent with those obtained from transcriptome analysis.
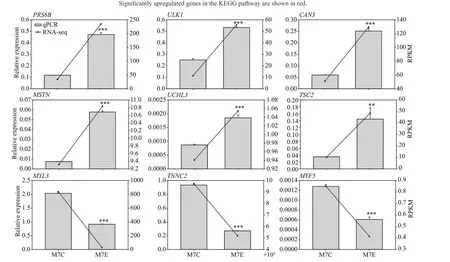
Fig.7 RNA-Seq and qPCR results,showing the relative expression levels of nine DEGs
4 DISCUSSION
In this study,we used detailed polyomic analyses to explore the effects of fasting on protein metabolism in the muscle tissue of the large yellow croaker.We used label-free proteomics and RNA-seq to quantity protein and mRNA expression levels,respectively,in fasted and control fish.Our results showed that more DEPs and DEGs were upregulated than downregulated.GO analysis of the DEGs showed that the most enriched BP,CC,and MF terms were B ribosomes,translation,and RNA processing,respectively.KEGG pathway enrichment analyses showed that the ribosome,aminoacyl-tRNA biosynthesis,and oxidative phosphorylation pathways were significantly enriched in the DEGs.The conversion of mRNA into protein requires ribosomal proteins,which are critical integral components of the ribosome(Mélèse and Xue,1995).Ribosomal protein not only stabilize rRNA structure,but also regulate the transport of mRNA and tRNA during translation(Cukras et al.,2003).In addition,most of the genes involved in ribosomes,aminoacyl-tRNA biosynthesis and oxidative phosphorylation were upregulated in both the transcriptome and the proteome,including 40S ribosomal protein S13,60S ribosomal protein L7a,and NAD(P)H-hydrate epimerase.These results indicated that extensive rewiring of translation and RNA processing occurs with energy consumption in response to fasting.This was consistent with a previous study inCaenorhabditis elegans(Harvald et al.,2017).GO functional enrichment analysis of the DEPs indicated that fasting affected CCs in the muscle,including the cytoskeletal part,myosin complex,and cytoskeleton.Moreover,KEGG pathway enrichment analysis showed that the proteasome,actin cytoskeleton,and phosphocreatine inositol metabolism pathways were significantly enriched in the DEGs.A previous study in pacu(Piaractusmesopotamicus) showed that long-term fasting led to changes in the muscle proteome,especially in proteins related to the cytoskeleton,muscle contraction,and metabolic processes (da Silva-Gomes et al.,2019).
Many of the DEPs (Supplementary Table S1) and DEGs were related to the myofibril network,which is responsible for the motor function of the muscle.Important proteins making up the muscle myofibrils are actin alpha-skeletal muscle (ACTS),tropomyosin alpha-1 chain (TPM2),tropomyosin alpha-3 chain(TPM3),troponin T-fast skeletal muscle isoforms(TNNT3),troponin C-skeletal muscle (TNNC2),and myosin light chain 3 (MYL3).MYL3 plays an important role in fish muscle growth and contraction(Zhou et al.,2010).TNNC2 is attached to the protein tropomyosin and lies within the grooves between actin filaments in muscle tissue (Moses et al.,1999).Troponin T and tropomyosin are known to confer Ca2+sensitivity to muscle actomyosin ATPase activity for muscle contraction (Piec et al.,2005;Gelfi et al.,2006).These genes were downregulated in the transcriptomes of the 21-d fasted fish.MYL3 was also downregulated in the proteome.These results indicated that fasting affected the synthesis of proteins in the muscle.Calpains,including calpain-1 (CAN1),calpain-3 (CAN3),and calpain-5 (CAN5),play an important role in the degradation of myofibrillar proteins.In vitro,calpains initiate the digestion of individual myofibrillar proteins,including tropomyosin,troponin T,troponin I,and titin.However,calpains do not degrade α-actin,α-actinin,or myosin heavy chain (Solomon and Goldberg,1996;Purintrapiban et al.,2003).Calpains are activated by fasting or changes in nutritional status in mammals(Ilian and Forsberg,1992;Goll et al.,2003) and fish such as sea bream (Sparusaurata) (Salmerón et al.,2013).Calpain mRNA concentrations increased markedly during fasting (Ilian and Forsberg,1992),consistent with the results of this study.These results suggested that fasting may cause the degradation of myofibrils in the muscle.
Protein metabolism dynamics reflect changes in biotic and abiotic conditions (Fraser and Rogers,2007;Johnston et al.,2011).For example,both mammals (Hershko and Ciechanover,1982;Mommsen,2004;Finn and Dice,2006) and fish(Martin et al.,2002;Seiliez et al.,2008,2013) initiate a proteolytic process to accelerate the metabolism in response to food scarcity.Proteolysis can provide amino acids,which are critical for fish growth during fasting.Therefore,specific protein metabolisms are critical for fish growth (Lavajoo et al.,2020).Two proteolytic pathways,the lysosomal system and the ubiquitin-proteasome system,are upregulated in the muscles of fasted trout to fuel the metabolism (Rescan et al.,2007).During fasting inS.alpinus,the ubiquitin proteasome pathway is activated,and muscle proteins are primarily degraded via the lysosomal proteolysis pathway (Cassidy et al.,2016).In an ATP-fueled reaction,damaged proteins are recognized and degraded by the 26S proteasome protease complex,a key component of the ubiquitin-proteasome system(Ciechanover et al.,1984;Hershko and Heller,1985).In this study,26S protease regulatory subunit 6B(PRS6B) and ubiquitin carboxy-terminal hydrolase 3(UCHL3) were upregulated in both the proteome and the transcriptome.Both of these proteins are associated with the ubiquitin proteasome pathway.These results implied that this phenomenon was widespread in mammals and fish.
Autophagy,which may increase under metabolic,genotoxic,or other stress conditions,is an adaptive mechanism that is essential for cell survival.Autophagy is most important for the starvation response.In starving mice,autophagy is more pronounced in fast-twitch muscles as compared to other organs (Mizushima et al.,2004).Tuberous sclerosis component 2 (TSC2) is a major marker of nutrient deprivation and is an inhibitor of mTOR function in trout (Rescan et al.,2007).ULK1 (serine/threonine-protein kinase) is an important regulator of the autophagy pathway,helping to stimulate or inhibit a variety of kinases (Bach et al.,2011).Inhibition of the ULK1 protein complex suppresses staphylococcus-induced autophagy and cell death(Radhi et al.,2019).In addition,a previous study showed that ULK1 and ULK2 were ubiquitously expressed or formed autophagosomes in response to nutrient deprivation (Ganley et al.,2009).Here,TSC2andULK1were significantly upregulated in the transcriptome,which implied that these two genes might play a role in response to fasting.However,in the proteome,TSC2 and ULK1 expression levels did not differ significantly between the experimental group and the control group.The reasons why there was no significant difference in protein level need to be further studied.
Studies have shown that fasting may inhibit muscle growth in fish (Tian et al.,2010;Kuniyoshi et al.,2019;Yang et al.,2019),but the associated regulatory mechanisms are not well understood.Two genes associated with growth regulation,MYF5andMSTN,were significantly differentially expressed in our study.MYF5was significantly downregulated after starvation treatment,whileMSTNwas significantly upregulated.Previous studies have shown that MYF5 promotes muscle growth in fish (Codina et al.,2008;Guo et al.,2009),while MSTN inhibits muscle growth(Xu et al.,2003).These results suggested that both positive and negative regulators played a role in inhibiting muscle growth in response to fasting.
5 CONCLUSION
In this study,transcriptomic,proteomic,and realtime PCR techniques were used to comprehensively analyze the molecular mechanisms underlying the effects of fasting stress on the protein metabolism in large yellow croaker muscle tissues.Our results show that genes associated with muscle composition and muscle growth were downregulated,while genes associated with proteolysis were upregulated.Thus,fasting may affect muscle metabolisms and their growth-related proteins.Our data indicate that combined analyses,measuring gene,transcript,and protein expression levels can help to clarify the mechanisms regulating the fasting response in fish.
6 DATA AVAILABILITY STATEMENT
The transcriptome datasets are deposited in the NCBI’s Sequence Read Archive (SRA) database under the accession number SRP063956 and these data’s have been submitted to the NCBI GEO database under the series record is GSE73291.
 Journal of Oceanology and Limnology2021年5期
- Journal of Oceanology and Limnology的其它文章
- Screening of stable internal reference genes by quantitative real-time PCR in humpback grouper Cromileptes altivelis*
- Comparison of fungal community composition within different intestinal segments of tilapia and bighead carp*
- Mitochondrial phylogenomics reveal the origin and adaptive evolution of the deep-sea caridean shrimps (Decapoda:Caridea)*
- C17-fengycin B,produced by deep-sea-derived B acillus subtilis,possessing a strong antifungal activity against Fusarium solani*
- Relationship between morphospecies and microcystinproducing genotypes of Microcystis species in Chinese freshwaters*
- Size-dependent spatio-temporal dynamics of eukaryotic plankton community near nuclear power plant in Beibu Gulf,China*
