
Design of optical wedge demodulation system for fiber Fabry-Perot sensor
2021-10-10 09:46:18ZHANGXiongxingLVWentaoZHANGTianyangKOUWanyingCHENQingqingWANGWei
中国光学 2021年5期
ZHANG Xiong-xing,LV Wen-tao,ZHANG Tian-yang,KOU Wan-ying,CHEN Qing-qing,WANG Wei
(School of Optoelectronics Engineering, Xi’an Technological University, Xi’an, Shannxi 710021, China)
* Corresponding author,E-mail: wangwei@xatu.edu.cn
Abstract: In order to realize the demodulation of the cavity length of the fiber-optic FP sensor, a new optical wedge-type non-scanning correlation demodulation system is proposed, and the characteristics and structure of the devices used in the system are analyzed and studied. First, by simulating the light sources with different spectral distributions and the optical wedges with different surface reflectivities, the correlation interference signals are analyzed and the optimal structure parameters of the system components are given. Then by comparing the light intensity distribution characteristics of the Powell prism and cylindrical lens on the linear array CCD, more uniform spectral distribution is achieved. Finally, the specific implementation scheme and data processing method of the demodulation system are given. The experimental results show that when the light source spectrum has a Gaussian distribution and large spectral width and the reflectivity of the wedge surface is R=0.5, the characteristics of the correlation interference signal are obvious and convenient for demodulation. Finally, the demodulation system achieves the demodulation effect with an error of less than 0.025% within the cavity length range of 60 μm-100 μm. This optical wedge-type non-scanning correlation demodulation method can realize the sensing demodulation of the fiber-optic FP cavity and improve the power adaptability of different types of fiber-optic FP sensors.
Key words: fiber-optic FP sensor; non-scanning correlation demodulation; optical wedge; Powell prism; linear array CCD
1 Introduction
As an important branch of optical fiber sensing,the technology of optical Fiber-optic FP sensor is developing rapidly. It is characterized by high precision, small size and anti-interference, and is widely used in aerospace, civil engineering, medical treatment and other fields[1-3]. The changes in external physical quantities will affect the cavity length of a FP sensor. By demodulating the cavity length information, different physical quantities such as pressure, temperature and strain can be measured[4-5].
Fiber-optic FP sensors are divided into intrinsic type and non-intrinsic type. The intrinsic fiber FP sensor is an internal cavity structure composed of optical fibers. It can sense the changes of external information by using the sensing of optical fiber.The non-intrinsic type, however, is an external cavity structure generally filled with air or vacuum and formed by hollow-core fiber, capillary, elastic membrane or other sensitive elements. These sensitive elements are used to sense the changes of physical quantities, while the optical fiber is only used for signal transmission[6-7]. Fiber-optic FP sensors can be fabricated by MEMS, chemical etching, direct welding, laser processing and other methods. With a simple structure and wide range of applications,they are of great significance for structural status detection under harsh working environment[8-10].
Due to the application advantages of FP sensors, the demodulation techniques for these sensors have also developed rapidly, mainly including intensity demodulation and phase demodulation[11]. Intensity demodulation is relatively traditional, and is easily interfered by external factors and optical device performance, which may result in low demodulation accuracy[12]. Phase demodulation is to calculate the cavity length according to the phase information of the obtained interference spectrum signal. It is less affected by the light intensity,so the demodulation accuracy is higher[13]. Correlation demodulation is to introduce a dynamic reference cavity into the demodulation system in accordance with the principle of cavity length matching,and then obtain the cavity length information through the correlation operation between the output signal of FP sensor and the reference cavity signal. According to the control mode of reference cavity, the demodulation techniques can be divided into scanning demodulation and non-scanning demodulation. In the scanning demodulation system,piezoelectric ceramics or a mechanical moving part is generally used to control the length of the reference cavity. In this scheme, the introduction of dynamic tuning signal and mechanical part often leads to low demodulation rate and low accuracy. The non-scanning demodulation system, however, is based on Fizeau interferometer with optical wedge and FP sensor as correlation components, so it has high structural stability and has been widely used[14-16].
The key of the non-scanning correlation demodulation system of fiber-optic FP sensor is to obtain the correlation interference signal with evident characteristics, and then search for the signal peak to obtain the sensor cavity length. The demodulation system is generally the combination of a broadband light source, a large-aperture fiber collimator, a cylindrical lens, an optical wedge and a CCD. The spectral distribution of light source and the surface reflectivity of optical wedge will also affect the contrast of correlation interference signals[17-19]. The effects of triangular, rectangular and Gaussian broadband light sources with different spectral distributions and of the optical wedges with different surface reflectivities on the correlation interference signals were simulated and analyzed. In the structural design of the demodulation system, the correlation module is generally the combination of a large-aperture fiber collimator and a cylindrical lens. The optimization of this design is also ongoing. Because the cylindrical lens can cause non-uniform light intensity distribution, the demodulation difficulty will be increased. In order to solve this problem, the demodulation system is optimized in this paper by proposing a new optical wedge demodulation system based on Powell prism, which can eradicate the problem of non-uniform light intensity distribution and eliminate the phenomenon of central hot spot and fading edge of Gaussian beam during demodulation.
2 Demodulation principle
The non-scanning correlation demodulation method is shown in Figure 1. The length of the reference FP cavity introduced by this method varies with space, which is realized by changing the optical wedge thickness. The optical wedge has different thicknesses at different positions. These different wedge thicknesses can be regarded as multiple FP fiber sensors with different cavity lengths. The structure diagram of optical wedge is shown in Figure 2.
As can be seen from Figure 1, the demodulation system is composed of a broadband light source, an optic fiber coupler, a fiber-optic FP sensor and a correlation module. The outgoing light of the broadband light source is transmitted via the optical fiber coupler to the fiber-optic FP sensor,where the two-beam interference occurs. Then the return light carrying the cavity length information is transmitted to the correlation module, also via the optical fiber coupler. The correlation module includes a fiber collimator, a Powell prism, an optical wedge, and a linear array CCD. The fiber collimator shapes the light returning from the fiber into parallel beams, which, in turn, travel to the Powell prism and are converted into linear beams. Then the linear beams enter the optical wedge, where the multiple beam interference occurs on two surfaces.After being modulated by the wedge, the light travels to the CCD. Finally, the signal is processed to get the cavity length information.
The intensity of the interference light generated by the fiber-optic FP sensor, denoted asIr, can be expressed as:

whereRis the reflectivity of the end face of the fiber-optic FP cavity,nis the refractive index of the cavity of the fiber sensor,lis the length of the FP cavity, λ is the wavelength of the light wave, andIiis the intensity of the light entering the demodulation system.
The light source used in the non-scanning correlation demodulation method is a broadband light source. When calculating the total light intensity of the correlation interference signals, the light intensity values of the correlation interference signals generated by all wavelengths should be added to obtain the total light intensity of the signals output through the fiber-optic FP sensor and optical wedge, as shown:whereR1represents the reflectivity of the wedge surface, θ represents the wedge angle, andxrepresents any position on the long side of the right triangle.

The analysis of the correlation interference signals in Equation (2) shows that, in the non-scanning correlation demodulation method, when the maximum correlation signal is observed, the wedge thickness corresponds to the cavity length of the fiber-optic FP sensor, namelyxtanθ=l. This phenomenon is called cavity length matching. Thus, the cavity length of the fiber-optic FP sensor can be demodulated.
3 Characterization of demodulation devices
3.1 Light source
In practical applications, the spectral distribution of a light source is not completely uniform. In order to analyze the influence of different spectral distributions on the demodulation signal, three spectral distribution curves with different shapes,namely Gaussian shape, triangle and rectangle, were chosen in this paper, as shown in Figure 3 (Color online). Among them, the Gaussian and triangular spectra were used to simulate the spectrum of SLED light source, while the rectangular spectrum was used to simulate the spectrum of erbium-doped fiber laser source. The 3 dB bandwidths and central wavelengths of the three light sources were all the same. Since the spectral response range of linear array CCD was 400 nm−1100 nm, the central wavelengths of the three spectral curves were assumed to be 850 nm. As can be seen from the figure, when the spectral curves of the three broadband light sources have the same 3 dB bandwidth, the effective spectral width of the Gaussian light source is the largest, while that of the rectangular light source is the smallest.
Considering the spectral distribution characteristics of the light source and the spectral distribution characteristics of the light traveling in space,the mathematical model of correlation interference signals can be obtained according to equation (2):

wherexpis the position of the central wavelength,xis the length of the distance fromxp,Bxis the FWHM of the Gaussian distribution function of the light traveling in space, andf(λ) is the mathematical model of the spectral distribution of different light sources.
To obtain the spectral distribution curves of the three light sources, the central wavelength of the simulated light source was assumed to be 850 nm,the 3 dB bandwidth was 60 nm, the length of the fiber-optic FP cavity was 80 μm, the thickness of the optical wedge was between 50 μm and 100 μm,and the length of the optical wedge was 0.03 m.Through simulation, the intensity distribution curves of the optical wedge were obtained under the spectral distributions of different light sources (Fig. 4).
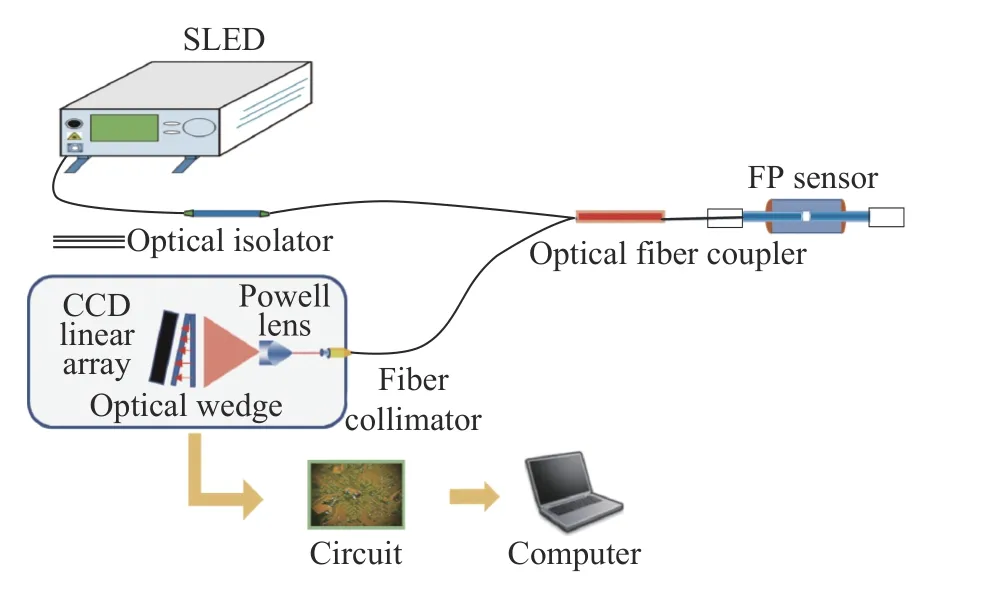
Fig. 1 Schematic diagram of optical wedge demodulation system for fiber-optic FP sensor图 1 光纤法珀传感器光楔式解调系统示意图
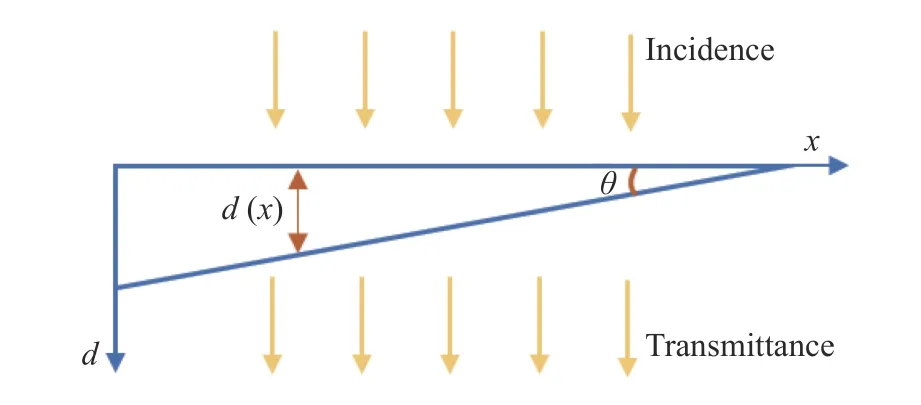
Fig. 2 Schematic diagram of optical wedge structure图 2 光楔结构示意图
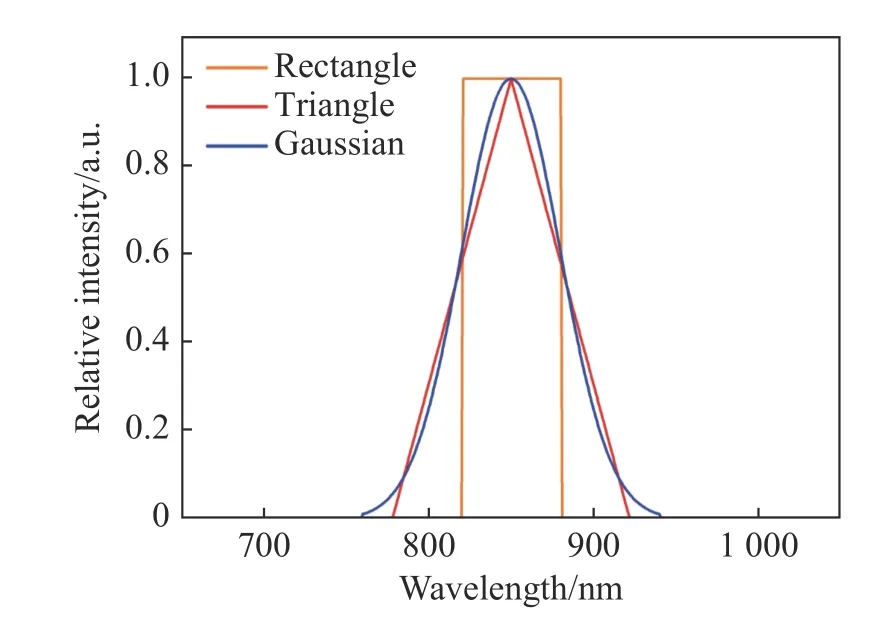
Fig. 3 Three kinds of spectral distribution curves图 3 3种光谱分布曲线

Fig. 4 The output light intensity distribution of correlation interference signal under different spectral distributions图 4 不同光谱分布下相关干涉信号输出分布
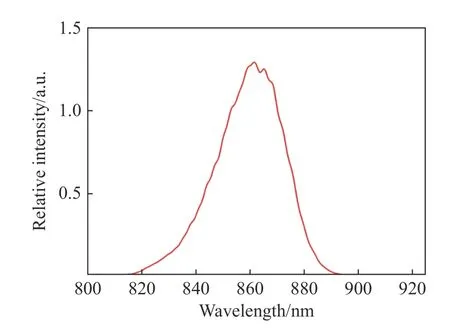
Fig. 5 Output spectrum of SLED图 5 SLED输出光谱
Fig. 6 Light intensity distributions of (a) cylindrical lens and (b) Powell prism图 6 (a)柱透镜和(b)鲍威尔棱镜光强分布效果图

Fig. 7 Light intensity distributions of the background signals from cylindrical lens and Powell prism detected by CCD图 7 柱透镜和鲍威尔棱镜光强分布经CCD探测基底信号图

Fig. 8 Comparison of correlation interference signals obtained by the optical wedges with different surface reflectivities图 8 不同表面反射率的光楔的相关干涉信号对比图

Fig. 9 Optical wedge structure of fiber-optic FP sensor demodulation system. (a) Schematic diagram of optical wedge fabrication; (b) combination of CCD and optical wedge图 9 光纤法珀传感器解调系统的光楔结构。(a)光楔制作示意图;(b)CCD结合光楔实物图
Fig. 10 Schematic diagram of fiber-optic FP sensor图 10 光纤法珀传感器示意图

Fig. 11 Experimental optical wedge demodulation system for the fiber-optic FP sensor. (a) Overall structure; (b) detailed picture of the sensor; (c) internal structure of dark box图 11 光纤法珀传感器光楔式解调实验系统。(a) 整体结构 (b) 传感器细节图 (c) 暗盒内部结构
It can be seen from the comparison that, when the 3 dB bandwidths and spectral ranges of all the spectra are the same, the curve of the light intensity distribution under the action of Gaussian spectrum has less background signal noise and higher output signal contrast than those of triangular and rectangular spectra to facilitate accurate peak-finding and high-precision demodulation. Influenced by the characteristics of Gaussian spectrum itself, the integral spectral range of Gaussian spectrum is larger than that of triangular or rectangular spectrum.However, when the spectral range is larger, different groups of correlation interference fringes are superimposed on each other, leading to more sparse correlation interference signal fringes, higher fringe contrast and greater light intensity. In addition, the wide-spectrum light source has a suppression effect on the noise, mainly because it has a small coherence, which reduces the coherence error introduced by the noise. According to the analysis, a SLED with a 3 dB bandwidth of 60 nm was selected as the broadband light source, whose spectrum was shown in Figure 5.
3.2 Powell lens
In the optical wedge non-scanning correlation demodulation method, the correlation module is generally the combination of a large-aperture fiber collimator, a cylindrical lens, an optical wedge and a CCD. The light passes through the fiber collimator to the cylindrical lens. The cylindrical lens converts the light into linear beams, which, in turn, shine on the optical wedge. Then the wedge outputs the correlation interference signals. The CCD collects the optical signals and converts them into electrical signals. For the correlation module of this structure, it was found in the experiment that for the lens reason,the DC bias distribution of the obtained correlation interference signals was not uniform, which affected the demodulation of the cavity length. Therefore, the fiber collimator and the cylindrical lens were optimized. The size of the fiber collimator was reduced and the cylindrical lens was changed into a Powell prism, so as to greatly reduce the system size and eliminate the influence of non-uniform bias distribution.
Different from cylindrical lens, Powell prism can convert the light very well, so that the light is distributed evenly within the fan angle of Powell prism, rather than more in the middle and less at the edge in a cylindrical lens. The light intensity distributions of the cylindrical lens and Powell prism are shown in Figure 6. The beam distribution formed after the light passes through the cylindrical lens is shown in Figure 6(a). It can be found that, the light intensity is mainly concentrated in the middle and decreases with the distance from the center, as seen in the Gaussian distribution. The beam distribution formed after the light passes through the Powell prism is shown in Figure 6(b). After passing through the Powell prism, the light energy is evenly distributed within the fan angle. This distribution effectively eliminates the defect that the light intensity is stronger in the middle and weaker at the edge.
In an experiment, the combination of a largeaperture collimator and a cylindrical lens was compared with the combination of a small-aperture collimator and a Powell prism, and a linear array CCD was used to detect the two groups of signals. The results are shown in Figure 7, where the abscissa represents the CCD pixel serial number and the ordinate represents the relative intensity. The results show that the background signal distribution obtained by Powell prism is more uniform than that obtained by cylindrical lens, so the use of Powell prism as the beam-shaping structure is more beneficial to signal demodulation.
3.3 Optical wedge
Optical wedge is the key device to realize the demodulation in the system. It directly determines whether the correlation operation can be implemented. Therefore, optical wedge is very important for the whole demodulation system. The design and selection of optical wedge need to consider the cavity length range of the sensor. The initial cavity length of the fiber-optic FP sensor used in the experiment was about 80 μm. In order to expand the measurement range as much as possible, the wedge thickness range was roughly set as 50 μm−100 μm. According to Equation (2), the reflection coefficient of the wedge can affect the light intensity of the correlation interference signal. In order to better determine this relationship, the light intensity distribution of the correlation interference signal was simulated when the reflection coefficientRwas 0.1, 0.3, 0.5,0.7 and 0.9.
The simulation results are shown in Figure 8(Color online). As can be seen from the figure, the light intensity of the correlation interference signal decreases gradually with the increase of the reflectivityR, and the contrast of the correlation interference signal reaches its maximum atR=0.5.Therefore, it was determined that the outer surface of the wedge should be coated with an antireflection film covering the entire spectral range, while the inner surface should be coated with a semi-reflection semi-transmission film covering the entire spectral range.
The wedge width should be consistent with the CCD width. Two glass sheets were used to fabricate the optical wedge. At first, two clean glass sheets of suitable length were chosen, with one side coated with an anti-reflection film and the other side coated with a semi-reflection semi-transmission film. Two film shims, 50 μm and 100 μm thick respectively, were prepared. Then the semi-reflection semi-transmission surfaces of the two glass sheets leaned against each other. The 50-μm thick shim was sandwiched at one end between the glass sheets and the 100-μm thick shim at the other end. Finally,an optical wedge was formed by bonding the ends of the two glass sheets with ultraviolet glue. Then,the finished optical wedge was pasted on the CCD with ultraviolet glue, as shown in Figure 9.
4 Experimental verification
Non-intrinsic fiber-optic FP sensor is typically fabricated by inserting single-mode fibers into a hollow glass tube (Figure 10). At first, two segments of single-mode fibers with flat ends and one segment of hollow glass tube are prepared. Then the two fibers are inserted into the glass tube from both ends to form a FP cavity in tube with air as the medium.Usually, the joints between the glass tube and the fibers are fixed with UV glue in order to obtain a stable cavity structure. Alternatively, the fiber sections can be coated with film to improve the reflectivity and form a non-intrinsic fiber-optic FP sensor with high fineness.
The non-scanning correlation demodulation system for fiber-optic FP sensor was built, as shown in Figure 11. The system was composed of a SLED
light source with the central wavelength of 850 nm and the 3 dB bandwidth of 60 nm, a 2×1 fiber coupler, a fiber-optic FP sensor, a fiber collimator, a 30-mm long Powell prism, an optical wedge (50 μm−100 μm thick), a linear array CCD and a data processing unit. Among them, the fiber collimator, the Powell prism, the optical wedge and the CCD were fixed in a dark box.
An fiber-optic FP sensor with an initial cavity length of 80.067 μm was connected to the established experimental platform. The correlation interference signals were converted by CCD into electrical signals for data processing. The curve of the collected correlation interference signal is shown in Fig. 12 (Color online). The abscissa represents the pixel point position, and the ordinate represents the relative intensity of the correlation interference signal converted into a digital signal.
As can be seen from the blue curve in Fig. 12,the acquired signal contains not only the useful signal, but also low-frequency bias and high-frequency noise. At first, the signal was converted to the frequency domain through Fourier transform. The frequency band where the signal was located was determined. Then, inverse Fourier transform was applied to the signal in this frequency band to achieve bandpass filtering. The red curve in the figure represents the signal obtained by the bandpass filter. It can be seen that compared with the original signal,the high-frequency noise and low-frequency bias in the filtered signal have been removed, and the curve has become smooth with an obvious envelope.Then, direct peak-searching calculation can be made. Alternatively, the envelope curve of the filtered signal can be fitted and finally, the maximum peak position on the fitted envelope curve can be found. The calculation result shows that, the maximum value of the correlation interference signal generated by the fiber-optic FP sensor with an initial cavity length of 80.067 μm is at the pixel point position 1729.739.

Fig. 12 Signals collected by CCD in the optical wedge demodulation system for fiber-optic FP sensor图 12 光纤法珀传感器光楔式解调系统CCD采集信号图
Fig. 13 Test results of optical wedge demodulation system for fiber-optic FP sensor图 13 光纤法珀传感器光楔式解调系统测试结果图
By calibrating the demodulation system and the standard fiber-optic FP sensor, the correspondence relation between the pixel point position at the peak value of the correlation interference signal and the cavity length is obtained asL=11.889·n+59 511.072 nm, whereLis the cavity length of the FP sensor,nis the pixel serial number corresponding to the peak position of the correlation interference signal, and the fitting coefficient isR2=0.999 9. 8 fiber-optic FP sensors with the cavity lengths of 65.002 μm, 69.141 μm, 73.125 μm,75.109 μm, 80.067 μm, 83.692 μm, 89.388 μm and 93.474 μm respectively were connected to the demodulation system one by one. The measured and fitting results are shown in Figure 13. It can be seen that the maximum error is 9 nm and the fullscale measurement error is less than 0.025%.
Under different light source power, the demodulation ranges of the optical wedge demodulation systems using Powell prism and cylindrical lens were compared, as shown in Fig. 14, and the corresponding data is also given in Table 1. It can be seen that the demodulation system using Powell prism has strong light source stability, small demodulation range fluctuation and relatively stable performance. When the power of the light source is less than 6 mW, the demodulation system using cylindrical lens cannot realize demodulation because of the disappearance of the correlation interference signal.This further demonstrates the advantage of Powell prism in the adaptability to light source power.

Fig. 14 Comparison of demodulation ranges of the demodulation systems using Powell prism and cylindrical lens under different light source powers图 14 不同光源功率下采用鲍威尔棱镜及柱透镜的解调系统的解调范围对比图

Tab. 1 Test data表 1 测试数据
5 Conclusion
In this paper, a non-scanning correlation demodulation method based on optical wedge was proposed for the demodulation of fiber-optic FP sensor, and the demodulation system was optimized.The simulation analysis of light source and optical wedge found that, when the light source spectrum was Gaussian distribution, the bandwidth was large and the surface reflectivity of optical wedge was R=0.5, the correlation interference signal of the demodulation system could achieve a higher contrast,which was convenient for accurate peak searching and demodulation. In addition, by applying the Powell prism, the influence of light intensity was greatly improved in a certain range of light power,and the adaptability of this modulation system to the light source power was enhanced. Through the calibration of this system, the final measurement range error was reduced to less than 0.025%.
中文对照版
1 引 言
光纤法布里-珀罗(法珀)传感器作为光纤传感的重要成果,得到了快速发展,其具有精度高、体积小、抗干扰等特点,广泛应用在航空航天、土木工程、医疗等领域[1-3]。由于外界物理量的变化会影响法珀传感器的腔长,故可以通过解调腔长信息,实现对于压力、温度、应变等不同物理量的测量[4-5]。
光纤法珀传感器可分为本征型和非本征型,本征型结构的光纤法珀传感器属于内腔式结构,其腔体由光纤构成,利用光纤可以传感的特征感知外界信息的变化。而非本征型是一种外腔式结构,腔体一般是空气或真空,腔体的形成多采用空芯光纤、毛细管或弹性膜片等敏感元件,用于感知物理量的变化,光纤仅仅起到传输信号的作用[6-7]。光纤法珀传感器可以通过MEMS、化学刻蚀、直接熔接、激光加工等方法制备,其结构简单适用性强,对于严苛工作环境下的结构状态检测有着重要意义[8-10]。
由于法珀传感器自身的应用优势,针对这种传感器的解调技术也得到了迅速发展,主要包括强度解调法、相位解调法和相关解调法[11]。强度解调法较为传统,受外界和光学器件性能的干扰容易导致解调精度低[12]。相位解调法根据获得的干涉光谱信号的相位信息来求解腔长,该解调方法受光强的影响较小,解调精度更高[13]。相关解调法是基于腔长匹配原理,在解调系统中引入动态参考腔,对法珀传感器输出信号与参考腔信号进行相关运算得到腔长信息。根据参考腔的控制方式又分为扫描式与非扫描式,扫描式解调系统一般采用压电陶瓷或机械运动部件控制参考腔长,这种方案引入的动态调谐信号与机械部件导致解调速率与精度较低。非扫描式解调系统基于斐索干涉仪,采用光楔与法珀传感器作为相关元件,结构稳定性高,得到广泛应用[14-16]。
光纤法珀传感器非扫描相关解调系统关键在于获得特征明显的相关干涉信号,进而对信号进行寻峰处理得到传感器腔长信息。解调系统一般采用宽带光源、大口径光纤准直器、柱透镜、光楔与CCD的组合,不同光谱分布的光源以及光楔表面的反射率大小也会影响相关干涉信号的对比度[17-19]。
本文模拟分析了三角、矩形和高斯3种不同宽带光源以及不同表面反射率的光楔对传感相关干涉信号的影响。解调系统结构设计中相关模块一般采用大口径光纤准直器、柱透镜的组合,这种设计的优化也在不断进行,由于柱透镜会带来光强分布不均匀的情况,导致解调难度加大。为了解决这个问题,本文对解调系统进行了优化,提出一种基于鲍威尔棱镜的新型光楔式解调系统,从根本上去除了光强分布不均匀的问题,消除了解调中高斯光束光场分布不均匀的问题。
2 解调原理
非扫描式相关解调方案如图1所示,该方法引入的参考法珀腔长是随空间变化的,其腔长的改变通过光楔厚度来实现。不同位置处的楔厚不同,这些不同的楔厚可以视为多个腔长不同的法珀光纤传感器,光楔结构示意图见图2。
从图1可以看出,该解调系统由宽带光源、光纤耦合器、光纤法珀传感器和相关模块组成。宽带光源的出射光经光纤耦合器传输到光纤法珀传感器,发生双光束干涉,携带腔长信息的返回光再经光纤耦合器传输到相关模块。相关模块包括光纤准直器、鲍威尔棱镜、光楔以及线阵CCD。光纤准直器将光纤返回光整形为平行光束照射至鲍威尔棱镜,鲍威尔棱镜将其转换成线状光束,线状光束照射进入光楔内部并在两个表面发生多光束干涉,经过光楔调制后的光照射在线阵CCD上,最后进行信号处理得到腔长信息。
经过光纤法珀传感器后生成的干涉光光强Ir可以表示为:

其中R表示光纤法珀腔端面的反射率,n表示光纤传感器腔体的折射率,l表示光纤法珀腔的腔长,λ表示光波的波长,Ii表示进入解调系统的光强大小。
非扫描相关解调法使用的光源为宽带光源,在计算相关干涉信号光强时,应该将所有波长产生的相关干涉信号的光强值进行累加,经过光纤法珀传感器和光楔后输出信号的光强为:式中R1表 示光楔表面的反射率,θ表示光楔的楔角,x表示直角长边任意位置。
对式(2)相关干涉信号进行分析可以得到,在非扫描相关解调法中,相关信号最大处的楔厚大小对应着光纤法珀传感器腔长的大小,表示为xtanθ=l,即腔长匹配,据此可以实现光纤法珀传感器的腔长解调。
3 解调系统器件特性分析
3.1 光源
实际应用中,光源光谱绝非完全均匀分布,为了分析不同光谱分布对解调信号的影响,文中选择了3种不同形状的光谱分布曲线,分别为高斯形、三角形以及矩形,如图3(彩图见期刊电子版)所示,其中,高斯形与三角形光谱模拟SLED光源光谱,矩形光谱模拟掺饵光纤光源光谱。3种光源光谱的3 dB带宽、中心波长均相同。由于线阵CCD光谱响应范围为400~1100 nm,假定3种形状光谱曲线的中心波长为850 nm,从图3可以看出,当3种宽带光源光谱曲线具有相同的3 dB带宽时,高斯形光谱曲线的有效谱宽最大,矩形光源最小。
考虑光源光谱分布和光在空间传播时的分布特性,根据式(2)得到相关干涉信号的数学模型为:

其中,xp表示中心波长的位置,x表示距离xp的量,Bx表示光源在空间传播时的高斯分布函数的半峰全宽,f(λ)表示不同光源的光谱分布数学模型。
针对3种光源光谱分布曲线,模拟光源中心波长为850 nm,3 dB带宽为60 nm,光纤法珀腔长80 μm,光楔厚度变化范围为50~100 μm,光楔长度为0.03 m,仿真得到不同光源光谱分布情况下,光楔上的光强分布曲线。
通过对比可以看出,在保证各光谱3 dB带宽且光谱范围一致的条件下,相对于三角形光谱、矩形光谱,高斯形光谱作用下输出光强分布曲线的基底信号噪声小,输出信号对比度高,便于准确寻峰,实现高精度解调。由于高斯光谱自身的特性,其积分光谱范围大于三角光谱以及矩形光谱,而当光谱范围越大时,各组相关干涉条纹相互叠加,使得叠加后的相关干涉信号条纹稀疏,条纹对比度更高,光强更大。此外,宽谱光源对噪声有抑制作用,主要原因是其具有较小的相干性,减小了噪声引入的相干误差。结合分析选用3 dB带宽为60 nm SLED作为宽带输入光源,光源光谱图如图5所示。
3.2 鲍威尔棱镜
光楔式非扫描相关解调法相关模块一般采用的都是大口径光纤准直器、柱透镜、光楔和CCD的组合结构,光经过大口径光纤准直器后到达柱透镜,柱透镜将光转换为线状光束,线状光束照射在光楔上,从光楔输出相关干涉信号,CCD采集光信号并转换为电信号。对于这种结构的相关模块组合,从实验中发现,由于柱透镜本身的原因,导致得到的相关干涉信号的直流偏置分布不均匀,影响腔长的解调。因此,对光纤准直器和柱透镜做了优化,光纤准直器尺寸变小,柱透镜调整为鲍威尔棱镜,很大程度上减小了系统的体积并消除了偏置分布不均匀带来的影响。
与柱透镜不同的是,鲍威尔棱镜能很好地将光进行转换,使光均匀分布在鲍威尔棱镜的扇角范围内,不存在像柱透镜那样中间部分光强集中,边缘部分光强较弱的情况。柱透镜和鲍威尔棱镜的光强分布,如图6所示,其中图6(a)是光经过柱透镜后形成的光束分布,其光强主要集中在中间区域,距离中心越远光强越弱,类似于高斯分布;图6(b)是光经过鲍威尔棱镜后形成的光束分布,光在经过鲍威尔棱镜后,其能量均匀分布在扇角范围内,这种分布有效避免了中间部分光强集中而边缘光强较弱的情况。
将大口径准直器加柱透镜组合与小口径准直器加鲍威尔棱镜结构进行实验对比,使用线阵CCD探测两组信号,结果如图7所示,横坐标为线阵CCD的像素序列号,纵坐标表示相对强度值,结果表明通过鲍威尔棱镜获得的基底信号分布较柱透镜更为均匀,因此选择鲍威尔棱镜作为光束整型结构更有利于信号解调。
3.3 光楔
光楔是实现系统解调的关键器件,直接决定着相关运算的实现。光楔的设计与选取需要结合传感器的腔长范围,实验所使用的光纤法珀传感器的初始腔长为80 μm左右,为了尽可能地提升测量范围,粗略设置光楔的楔厚范围为50 μm~100 μm。根据式(2)知,光楔的反射系数会影响相关干涉信号的光强。为了更好地确定光楔的反射系数对相关干涉信号的影响,在反射系数R分别为0.1、0.3、0.5、0.7、0.9五种情况下,对相关干涉信号的光强分布进行仿真实验。
仿真结果如图8(彩图见期刊电子版)所示。从图中可以看出,相关干涉信号的光强随着反射率R的逐渐增大而逐渐减小,相关干涉信号的对比度在R=0.5的时候达到最大。因次,光楔外表面镀涵盖整个光谱范围的增透膜,而内表面镀涵盖整个光谱范围的半反半透膜。
光楔宽度应与CCD的宽度保持一致,采用两块玻璃板制作光楔。取两块适合长度的干净玻璃片,其中一面镀增透膜,一面镀半反半透膜,准备50 μm和100 μm厚度的薄膜垫片,将两块玻璃片的半反半透面靠在一起,在玻璃片的一端垫入50 μm薄膜另一端垫入100 μm薄膜,最终使用紫外胶将两块玻璃片端点固定在一起即可形成光楔。最后,将制作好的光楔使用紫外胶粘贴在CCD上,结果如图9所示。
4 实验验证
使用单模光纤插入空芯玻璃管制作非本征型光纤法珀传感器是一种典型做法(见图10)。准备两段端面平整的单模光纤和一段空芯玻璃管,将两段单模光纤分别从空芯玻璃管两端插入,两根光纤在管内形成以空气作为介质的法珀腔。一般为了获得稳定的腔结构,可使用紫外胶在玻璃管与光纤接合处做固定处理,亦可通过在光纤截面镀膜提升反射率,形成高精细度的非本征光纤法珀传感器。
搭建如图11所示的光纤法珀传感器非扫描相关解调系统。选择中心波长为850 nm,3 dB带宽为60 nm的SLED光源、2×1光纤耦合器、光纤法珀传感器、光纤准直器、鲍威尔棱镜、长度为30 mm,厚度为50~100 μm的光楔、线阵CCD以及数据处理单元,其中,光纤准直器、Powell棱镜、光楔以及线阵CCD固定在暗盒中。
将初始腔长为80.067 μm的光纤法珀传感器接入搭建好的实验平台,通过CCD将相关干涉信号转换为电信号,再经数据处理。图12(彩图见期刊电子版)是采集到的相关干涉信号曲线分布图,横坐标表示的是像素点所在位置,纵坐标表示的是相关干涉信号转换为数字信号后的相对强度值。
从图12中蓝色曲线可以看出,获取的信号中,除了有效信号外,还存在着低频偏置和高频噪声,首先使用傅立叶变换将信号转换到频域,确定信号所在的频段,再对该频段范围的信号做傅立叶反变换,实现带通滤波。图中的红色曲线表示经带通滤波器后得到的信号,与原始信号相比,信号中的高频噪声和低频偏置已经被去除掉,曲线变得光滑,包络明显,可以直接进行寻峰计算,也可以对滤波后的信号进行包络曲线拟合,最后对拟合好的包络曲线寻找最大峰值位置。计算得到初始腔长为80.067 μm的光纤法珀传感器形成的相关干涉信号的最大值在像素点为1729.739位置处。
通过对解调系统与标准光纤法珀传感器进行标定,得到相关干涉信号峰值像素点与腔长的对应关系式为: L=11.889·n+59 511.072 nm,式中,L为法珀传感器的腔长值,n为相关干涉信号峰值位置对应的像素序列号,拟合系数 R2=0.999 9,将8组腔长分别为65.002、69.141、73.125、75.109、80.067、83.692、89.388、93.474 μm的光纤法珀传感器接入解调系统,结果拟合图如图13所示,其最大误差为9 nm,满量程测量误差小于0.025%。
不同光源功率下,采用鲍威尔棱镜与柱透镜的光纤法珀传感器光楔式解调系统解调量程对比如图14 所示,数据见表1。可以看出采用鲍威尔棱镜的解调系统的光源稳定性较强,解调范围波动较小,较为稳定。当光源功率小于6 mW时,采用柱透镜的解调系统由于相关干涉信号消失,无法实现解调,进一步说明了鲍威尔棱镜在光源功率适应性上的优势。
5 结 论
本文针对光纤法珀传感器解调,提出一种基于光楔式的非扫描相关解调方案,并且对于解调系统进行了优化。针对光源与光楔的选择进行模拟分析,得到光源光谱为高斯分布且带宽较大时以及光楔表面反射率 R=0.5时,解调系统的相关干涉信号对比度更高,便于准确寻峰解调。并且通过使用鲍威尔棱镜,在一定光功率范围内大幅改善了光强的影响,提高了解调系统对于光源的功率的适应性。通过对系统进行标定得到最终测量程误差小于0.025%。
猜你喜欢
中学生数理化·八年级物理人教版(2023年11期)2023-12-26 07:50:00
天水行政学院学报(2022年4期)2022-11-18 09:02:36
中学生数理化·八年级物理人教版(2022年11期)2022-02-14 06:37:46
中学生数理化·八年级物理人教版(2022年11期)2022-02-14 06:37:16
中学生数理化·八年级物理人教版(2021年11期)2021-12-06 06:44:38
少儿美术(快乐历史地理)(2020年4期)2020-02-24 13:06:28
学苑创造·A版(2019年4期)2019-05-10 00:19:52
微型小说选刊(2016年22期)2016-12-07 07:17:20
人生与伴侣·共同关注(2016年10期)2016-04-13 06:01:22
物理实验(2015年8期)2015-02-28 17:36:41
- 中国光学的其它文章
- Surface plasmon resonance characteristics of a graphene nano-disk based on three-dimensional boundary element method
- A new automatic cell smear and laser release system for near-infrared light responsive release of nucleated red blood cells
- Photon-assisted Fano resonance tunneling periodic double-well potential characteristics
- Formation mechanism of the continuous spectral profile of lightning plasma
- 中国遥感卫星辐射校正场敦煌戈壁场区光环境变化研究
- 油气井下光纤光栅温度压力传感器