
Effects of Prandtl number in two-dimensional turbulent convection∗
2021-09-28 02:17:58JianChaoHe何建超MingWeiFang方明卫ZhenYuanGao高振源ShiDiHuang黄仕迪andYunBao包芸
Chinese Physics B 2021年9期
Jian-Chao He(何建超),Ming-Wei Fang(方明卫),Zhen-Yuan Gao(高振源),Shi-Di Huang(黄仕迪),and Yun Bao(包芸),†
1School of Aeronautics and Astronautics,Sun Yat-sen University,Guangzhou 510275,China
2Center for Complex Flows and Soft Matter Research and Department of Mechanics and Aerospace Engineering,Southern University of Science and Technology,Shenzhen 518055,China
3Guangdong Provincial Key Laboratory of Turbulence Research and Applications,Southern University of Science and Technology,Shenzhen 518055,China
Keywords:turbulent convection,Prandtl number,direct numerical simulations(DNS)
1.Introduction
Turbulent convection exists widely in nature and engineering applications.Rayleigh–B´enard(RB)convection,a fluid layer heated from below and cooled from above,has been a paradigmatic model to study the convection phenomena.[1–3]For RB system in a particular geometry,its dynamics is mainly controlled by two dimensionless parameters,namely,the Rayleigh number Ra=αgΔTH3/(νκ)and the Prandtl number Pr=ν/κ.The Ra number characterizes the ratio of the buoyancy force to the damping force due to viscous and thermal dissipations.And the Pr number,defined by the properties of working fluid,represents the relative importance of viscous and thermal diffusions.Here,α,ν,andκare the thermal expansion coefficient,the kinematic viscosity and the thermal diffusivity of the working fluid,respectively,ΔT is the temperature difference across the fluid layer with the height being H,and g is the gravitational acceleration.
The global responses of the turbulent RB convection that people most concern are the heat transfer efficiency and the strength of turbulent flow,which are indicated by the Nusselt number Nu and the Reynolds number Re,respectively.Over the years,how the two response parameters depend on the system’s control parameters,i.e.,the relations of Nu(Ra,Pr)and Re(Ra,Pr),is the utmost important issue in the study of the turbulent RB convection.Many theories have been proposed to address this issue[4–9]and the model developed by Grossmann and Lohse(GL)[10,11]turns out to be the most successful one so far.However,while the GL model has been widely verified regarding to the Ra dependence of Nu and Re,the Pr dependent behaviors have received less attention.[1,12]
The study on the Pr-number effect in the RB convection can be traced back to the work by Globe and Dropkin in 1959.[4]By using different kinds of working fluids,including water,silicon oils and mercury,they achieved a wide Pr range from 0.02 to 8750 with the Ra number up to 6.8×10⁸.Based on the experimental data,they reported a simple relation as Nu=0.069Ra1/3Pr0.074,suggesting that the heat transport efficiency increases monotonically with Pr.However,it was pointed out in the GL model that there exists no pure power law for the Nu(Ra,Pr)relation.[10,11]Indeed,by conducting direct numerical simulations in a flat box for 104
Besides the heat transport behavior,the flow morphology and dynamics also evolve with Ra and Pr.It was revealed that the turbulent flow at low Pr number is dominated by a large scale recirculation cell,whereas thermal plumes(the elementary heat objects in the system)take over the role at high Pr number.[19,25]As a result,the Re number differs a lot for different Pr regimes.The numerical study by Verzicco et al.[19]showed that Re scales as Pr−0.73when Pr<0.35,but the scaling exponent changes to−0.94 when Pr>0.35.On the other hand,because direct measurement of the velocity fields is technically inaccessible for most working fluids,many approaches were proposed to measure the Re number,including the maximum velocity,the root-mean-square(rms)velocity,and the oscillation frequency of the LSC(or temperature).[17,26]It is found that the Ra and the Pr scaling exponents of Re based on different definitions change from 0.4 to 0.68 and−0.72 to−0.95,respectively.These results are so divergent that some are in agreement with the predictions of the GL model,but some are not.[27]
Note that all the studies mentioned above were made in the three-dimensional(3D)RB system,which is fundamentally different from the GL model developed from twodimensional(2D)equations in essence.Recently,due to the discovery of heat-transport enhancement in the slim-box,turbulent convection in quasi-2D system has become one important topic in the community of RB convection(see,e.g.,Refs.[28–30]).However,quasi-2D system is still fundamentally different from the true 2D case.Thanks to the growing studies of the RB convection in 2D configuration,it has been shown that the 2D RB system differs from the 3D(and quasi-2D)case in many aspects.[21,23,31,32]For example,Schmalzl et al.[21]found that the Nu data in 2D RB flow at Ra=106have no obvious Pr-dependence in the range of 0.01≤Pr≤100,and the Re number diverges from the 3D data when Pr is smaller than unity.Huang and Zhou[31]further found that 2D RB convection exhibits a minimum Nu at Pr=2–3 for 108≤Ra≤109,which is in strong contrast to the maximum value found in the 3D case.van der Poel et al.[23]also observed a number of differences between 2D and 3D RB systems,despite that they share some similarities in flow pattern.However,these studies in 2D RB configuration were made at either limited Pr ranges or relative low Ra values.To have a complete understanding of turbulent RB convection in 2D geometry,it is essential to explore a much wider Ra–Pr range.
In this paper,we present a systematic study of the 2D RB convection using direct numerical simulations(DNS),with the Ra and Pr ranges as wide as three orders in the turbulent regime.We first make a detailed comparison of the flow patterns at different Pr,and then examine the Pr-number effects on the Re number,the Nu number and thermal boundary layer.These results not only enrich our understanding of the 2D turbulent convection,but also provide a useful data base for model testing and development in the future.
2.Numerical methods and parameters
The non-dimensional governing equations for RB convection under Boussinesq approximation are as follows:

Figure 1 shows the Ra–Pr phase diagram covered in the present study,with the Ra number ranging from 107to 1010and the Pr number ranging from 0.25 to 100.The determination of the parameter ranges is based on two considerations.The first one is that the simulated cases should be largely in the turbulent regime,as we focus on studying turbulent convection.According to the GL model,[10]the boundary between laminar flow to turbulent convection is indicated by the solid line in Fig.1.Second,we recently observed a new flow regime that deviates from the prediction of the GL model,which is triggered by an anomalous transition in the large-scale flow.[34]This transition is indicated by the dashed line in Fig.1,so we did not go to low Pr numbers for larger Ra.To resolve the smallest turbulent scales and the boundary layers sufficiently,we set the meshes and time intervals for different parameters according to the criteria proposed by Gao et al.[32]The relative errors of Nu based on different calculating methods[36]are smaller than 1%for all the cases,indicating that our simulations are well resolved and statistically converged.
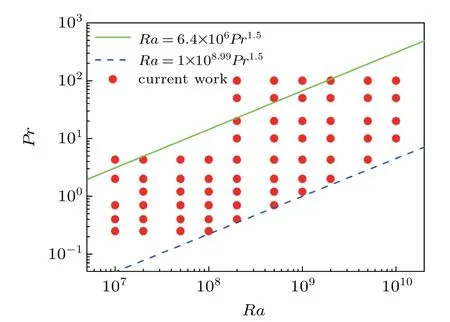
Fig.1.The Ra–Pr Phase diagram explored in the present study.The solid line indicates the transition from laminar flow to turbulence[10]and the dashed line indicates another newly-observed transition in the large-scale flow.[34]See text for detailed explanations.
Note that irregular reversal of the large-scale flow circulating directions occurs at certain range of Ra–Pr in the present study,i.e.,Ra=5×10⁷–3×10⁸for Pr=4.3,Ra=1×10⁷–1×10⁸for Pr=2.0,and Ra=2×10⁷for Pr=1.2,respectively.To check whether these reversal processes would affect the Nu and Re numbers,we calculated their values when the large-scale flow circulates in either clockwise or anticlockwise direction,and found that the obtained values of Nu and Re are the same for both directions.We have also calculated Nu and Re when reversal processes are involved.It turns out that the change in Nu is no more than 3%,but the Re number decreases by 50% due to the dramatic change in flow field during flow reversal.Similar findings have been reported in some previous studies.[37–39]As we need to compare the results in a wide range of Ra–Pr,where most of the cases have no flow reversals,in the present study we calculated Nu and Re without considering the reversal processes.It is also noteworthy that the simulations were run for at least 200(but no more than 500)free-fall time for each set of Ra–Pr.While these computation times are sufficient for calculating Nu and Re,they are far from enough for doing statistical analysis of flow reversal.A detailed study of flow reversal should be subject to future studies.
3.Results and discussion
3.1.Flow pattern
We first examine how the flow pattern in the 2D RB convection evolves with Ra and Pr.Figure 2 shows some typical snapshots of flow fields at Ra=2×10⁸for different Pr numbers.Note that the red and blue structures in the temperature fields[Figs.2(a)–2(d)]represent hot and cold thermal plumes,respectively.It can be seen that,for the Pr=0.4 case,the flow pattern in the system is dominant by a large-scale circulation(LSC)that expands almost the whole domain diagonally.Forced by the strong motion of the LSC,most of the thermal plumes are taken away directly after detaching from the thermal boundary layer and move along the sidewalls.The rest plumes are trapped at the remaining corners and form two counter-rotating secondary rolls.The flow pattern at Pr=4.3 is qualitatively the same,except that the LSC is more elliptical and the corner rolls are a bit larger.This kind of flow pattern and the associated dynamics have been well recognized before.[36,40]
However,as Pr increases to 20,the LSC’s motion becomes less organized and the corner rolls are less identified.On the other hand,the thermal plumes become slimmer,suggesting that they are more coherent and less dissipative.[16]When Pr further increases to 100,the flow pattern totally changes.Rather than dominated by a system-sized LSC,the whole domain is occupied by random motion of thermal plumes,which pass through the bulk region in a more straight way.The breakdown of the LSC at large Pr has been also observed in a quasi-2D RB experiment very recently,[25]but it occurs at much larger Pr and Ra numbers.It is noteworthy that this breakdown coincides with the transition from laminar flow to turbulent regime aforementioned,confirming the essential role of the LSC in turbulent RB system.[10,11]
The evolution in flow pattern is also revealed by the vertical velocity field,which is inherently linked to the movement of thermal plumes.This is evident by the distributions of the red and blue structures(indicating upward and downward moving fluid,respectively)as shown in Figs.2(e)–2(h).It is seen that,at low Pr numbers,the vertical motion is mainly concentrated at the left and right sides of the system,with the velocity in the central region being marginal.As Pr increases,the distribution of the vertical motion becomes less concentrated and even irregular,which reflects the fact that the LSC is less stable with increasing Pr and disappears eventually.As a result,the flow strength reduces greatly,with the maximum vertical velocity decreasing almost one order of magnitude for the cases shown in Fig.2.These results suggest that the effects of the Pr number are twofold.The first one is changing the viscous damping force as expected,which influences the flow strength directly.The second one is coupled with the first one:the change in flow strength will modify the organized pattern of flow structures,which in turn affects the flow strength further.
As the 2D RB convection at Pr>10 has been rarely studied,we take the Pr=20 case to discuss the influence of the Ra number on flow pattern.It is seen in Figs.2(a)–2(d)that the flow patterns are quite similar for different Ra numbers,though the LSC and the corner rolls at Ra=2×10⁸are not well developed yet.This similarity can also be observed in the distributions of vertical velocity as shown in Figs.3(e)–3(h).While there is no qualitative difference in the large-scale flow,the thermal plumes are found to be more fragmentary as Ra increases.This is supported by the small flow structures appearing in Figs.3(f)–3(h),which could be understood with the strong fluctuation with the increasing Ra.
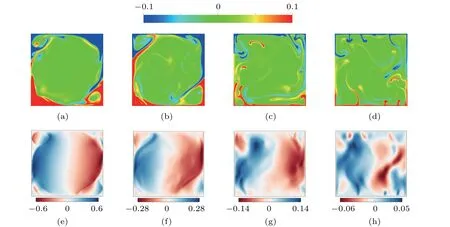
Fig.2.Instantaneous temperature(a)–(d)and vertical velocity(e)–(f)fields at Ra=2×10⁸ for different Pr numbers:Pr=0.4(a)and(e),Pr=4.3(b)and(f),Pr=20(c)and(g),and Pr=100(d)and(h).In order to show the flow structures more clearly,the temperature color map is set between−0.1 to 0.1.The color bars for the velocity fields are based on their own variation ranges.

Fig.3.Instantaneous temperature(a)–(d)and vertical velocity(e)–(f)fields at Pr=20 for different Ra numbers:Ra=2×10⁸(a)and(e),Ra=2×10⁹(b)and(f),Ra=5×10⁹(c)and(g),and Ra=1×10¹⁰(d)and(h).The temperature color map is the same as that in Fig.2.In order to distinguish the effect of Ra,the color bars for the velocity fields are based on their own velocity variation ranges,which have been re-scaled by the dimensional velocity for real fluid(silicone oil used in the experiment by Li et al.[25]).
3.2.Reynolds number

Figure 4 shows how the Re number depends on Ra and Pr.It is seen that all the data can be well described by powerlaw fittings,but their scaling exponents are non-universal(see Table 1).To be specific,the scaling exponentαfor Re~Raαis equal to 0.54 for Pr=0.25,then increases to~0.60 for Pr>1,[23,35,41]and finally exhibits a sudden growth to 0.67 for Pr=100.This variation trend ofαis consistent with a recent experimental finding in the quasi-2D RB system,[25]which was attributed to the evolution in the large-scale flow pattern.
However,all theαvalues in the present study are appreciably larger than previous results obtained in 3D system and the GL model’s prediction(varying from 0.4 to 0.5).[1,10,11]This discrepancy is somewhat surprising,especially given that the GL model essentially is a 2D model.It could be due to that the inverse energy cascade in 2D turbulence contributes to a stronger driven force for the large-scale flow,which has not been considered in the existing models for turbulent convection.It is worthwhile to develop a model involved inverse cascade process in the future.
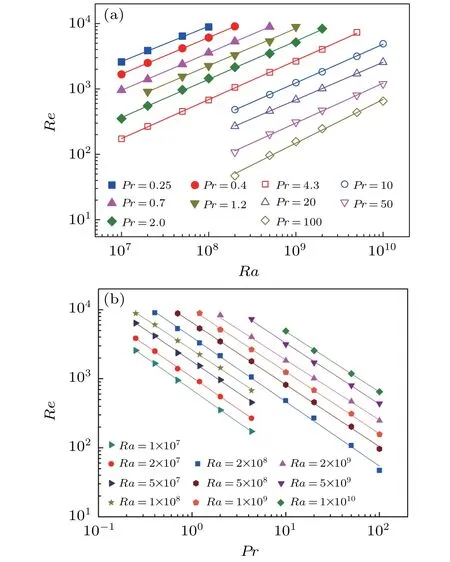
Fig.4.Log–log plots of Re as a function of Ra(a)and Pr(b).The solid lines are the best power-law fits to the corresponding datasets.The fitting results are listed in Table 1.
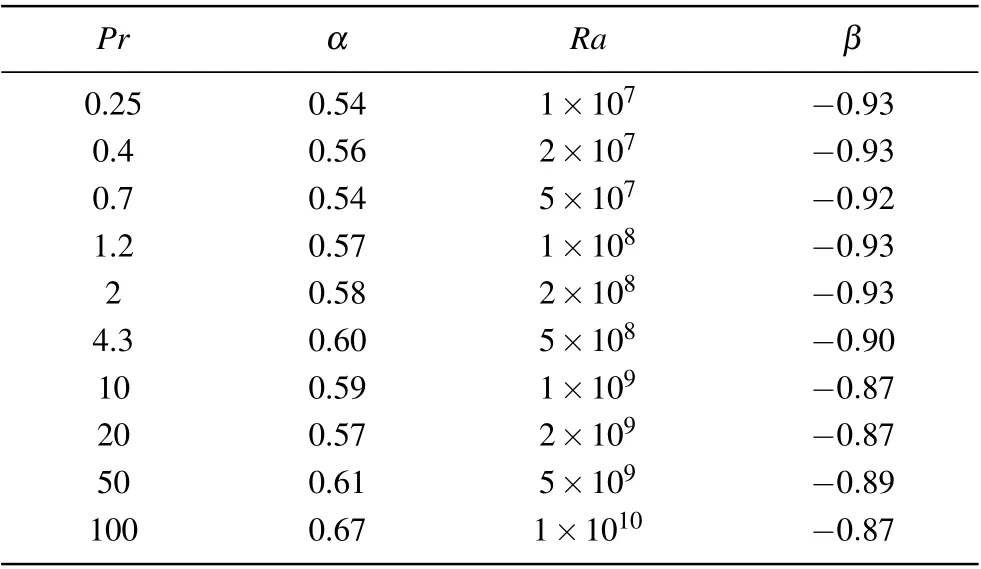
Table 1.The power-law fitting results for Re~Raαat different Pr and Re~Prβat different Ra.
The scaling exponentβof Re~Prβis not a universal constant,either.Their values for different Ra are found to be varied from−0.93 to−0.87(see Table 1).These negative exponents provide a quantification to Fig.2 that how the flow strength decreases with Pr.When compared with the previous studies of 3D RB convection,the present Pr-dependences are slightly weaker than the simulation results(changing from−0.94 to−1),[14,18–21]but stronger than the experimental findings(varying from−0.76 to−0.86).[17,26]According to the GL model,the value ofβfor the present parameter ranges should be in between−0.67 to−0.83,which could not explain the exponents obtained in the present study.Combined with the discrepancy in the Re~Raαrelation discussed above,it is highly desired to revise the GL model for the 2D RB convection.
3.3.Nusselt number
It has been shown that the heat transport efficiency in 2D RB convection has a sensitive dependence on the system’s aspect ratio,which was ascribed to the change in flow structures.[42,43]Since we observe a pronounced effect of Pr on the flow pattern,it is interesting to check the associated heat transport properties.Figure 5 shows the Ra and Pr dependences of the Nusselt number Nu,which is calculated by the formula below:[35]

In order to distinguish the datasets for different Pr,we normalized Nu with Ra0.3by convention in Fig.5(a).Note that we have checked the error for the Nu data,and found that all the errors are smaller than 1%in our simulated cases.Therefore,an error bar of 1%is shown in Fig.5(a)for reference.It is seen that the compensated Nu can be roughly divided into two groups.For Pr smaller than 4.3,the data first grow remarkably as Ra increases and then saturate at a plateau after Ra=2×10⁸.However,for higher Pr cases,the results decrease slightly with a similar trend with increasing Ra.These behaviors suggest that the Ra-dependent exponent are larger than 0.3 for low Pr cases but smaller than 0.3 for high Pr cases.It is further found that,when Ra is small,the compensated Nu diverges strongly for different Pr.As Ra increases,their differences become smaller and finally coincide with each other.As previous studies were conducted in limited Ra and Pr ranges,[21,23,31,32]these complex heat transport behaviors have not been observed before.Thus,our data provide a more complete picture of the heat transport in the 2D RB convection.
A great success of the GL model was the good agreement with the experimental Nu data in 3D RB system over a wide Pr range.[12,15]Recently,it is further found that the GL model’s prediction can also capture the Nu data in quasi-2D system,only differing by a constant factor.[25]Now we check how the Nu data in 2D system compare to the GL model.It is seen from Fig.5(b)that,once the GL predicting curves are shifted down by certain constant factors,most of the data can be described by the GL model as well.The shifted factors range from 0.72 to 0.85,which are smaller than those values(0.93–0.98)in the quasi-2D case.This suggests that the 2D RB convection has a lower heat transfer efficiency than both quasi-2D and 3D systems.In addition,combined the present results with previous studies,[17,21,23]we can further conclude that heat transfer in the RB convection is insensitive to Pr when Pr is greater than 10,regardless of the geometries of the system.
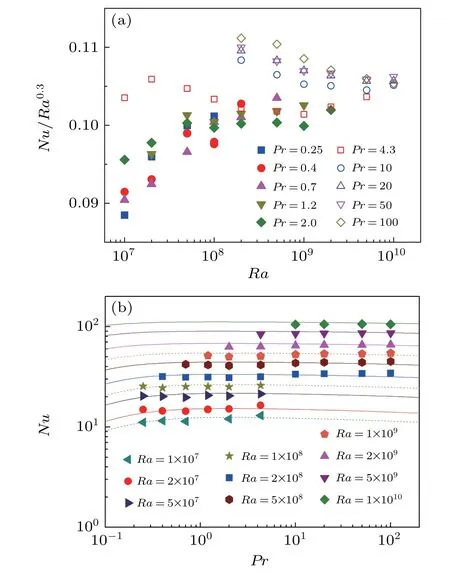
Fig.5.(a)Compensated Nu with Ra0.3 as a function of Ra and(b)Nu as a function of Pr.The lines in panel(b)are the predictions of the updated GL model[12]multiplied by 0.72,0.73,0.80,0.80,0.83,0.84,0.84,0.85,0.85,and 0.85 from lowest to highest Ra,respectively.
3.4.Thermal boundary layer
The thermal boundary layer is not only closely related to the heat transfer efficiency,but can also be modified by the flow dynamics.In this subsection,we study the Pr effect on the thickness of thermal boundary layerδθ,which is determined by the widely used“slope method”in the study of turbulent RB convection.[1]It is obvious in Fig.6(a)that,with increasing Ra,the spatially-averaged thermal boundary layer gets thinner and the data for different Pr become undistinguished for each other at higher Ra,which are consistent with the Nu results.If a power law fit is attempted to all the data shown in Fig.6(a),we yield a power law asδθ~Ra−0.30,in agreement with previous studies at medium Pr.[21,23,32]Although the mean values of thermal boundary layer thickness for different Pr are not much different,the local boundary layer values differ a lot.It is seen in Fig.6(b)that the spatial variation in the boundary layer thickness is stronger for lower Pr,with the thinnest region related to the shearing of the LSC and the two peaks related to the corner rolls.As Pr increases,the thinnest boundary layer in the LSC shear region get thicker,manifesting the fact that the shearing of LSC attenuates;and the two peaks gradually vanishes,corresponding to the weakening of the corner rolls.As the LSC breaks down at Pr=100,the thermal boundary layer eventually becomes quite uniform along the conducting boundaries.These results well reflect the changes in the flow pattern as shown in Fig.2.
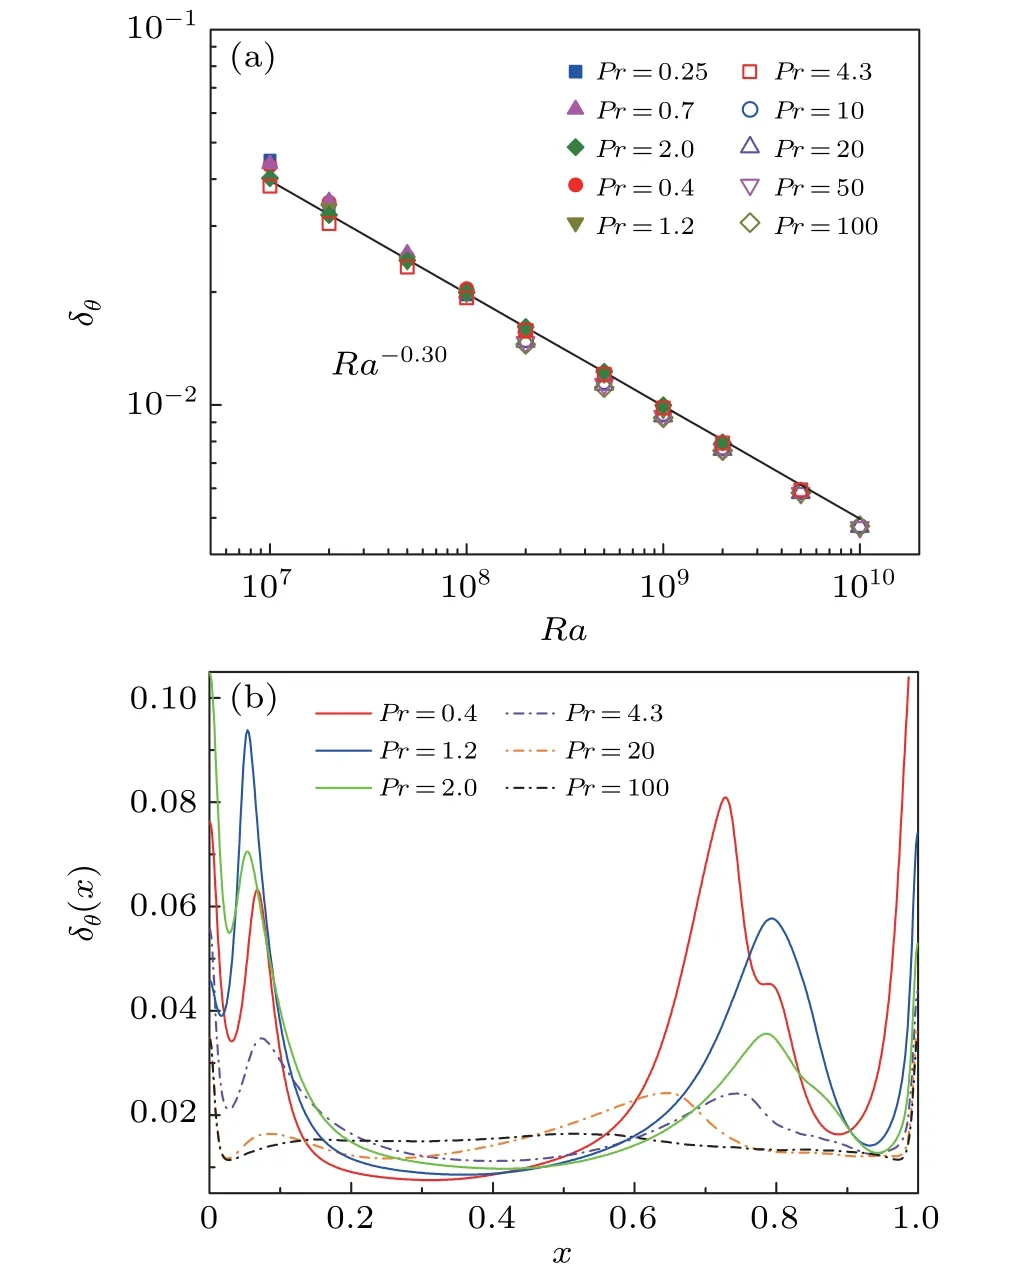
Fig.6.(a)Log–log plots ofδθas a function of Ra.The solid line is the best power-law fit of all data therein.(b)The thermal boundary layer thickness δθ(x)along the bottom boundary at Ra=2×10⁸ for different Pr numbers.
4.Conclusion and perspectives
In this paper,we numerically simulated the 2D RB convection over unprecedentedly wide parameter ranges,i.e.,107≤Ra≤1010and 0.25≤Pr≤100.The flow pattern,the Re number,the Nu number and the thermal boundary layer are investigated in detail,with a focus on the Pr effects.The major findings are summarized as below.
(i)The Pr number has a strong influence on both the flow pattern and the flow strength.As Pr increases,both the LSC and the corner rolls become weaker and disappear eventually.The flow pattern becomes dominated by random motion of thermal plumes at high Pr number.
(ii)There is no a simple power law for the Re(Ra,Pr)relation.It is found that the Ra and the Pr scaling exponents of Re change from 0.54 to 0.67 and−0.87 to−0.93,respectively,which are inconsistent with the predictions of the GL model.It is worthwhile to revise the GL model to coincide with these discrepancies.
(iii)The Nu data for different Pr diverge strongly at small Ra,but their difference becomes marginal as Ra increases.All the Nu data can be well captured by the GL model’s predictions after shifting certain constant factors.Our results also suggest that the heat transfer efficiency in the 2D RB convection is smaller than those in the quasi-2D and 3D systems.
(iv)The thermal boundary layer thicknessδθcan be described by a simple power law asδθ~Ra−0.30.Due to the influences from the corner rolls and the LSC,the local thermal boundary layerδθ(x)varies a lot along the bottom plat at low Pr number.But this variation becomes smaller as Pr increases andδθ(x)eventually gets uniform at high Pr number.
Acknowledgment
The authors would like to thank the computational sources provided by the Center for Computational Science and Engineering at Southern University of Science and Technology.
猜你喜欢
Chinese Physics B(2022年1期)2022-01-23 06:36:46
振动与冲击(2021年20期)2021-11-10 03:06:18
鸭绿江(2020年23期)2020-10-13 13:29:04
故事会(2020年14期)2020-07-21 08:13:10
船海工程(2019年1期)2019-03-04 01:58:04
高中生·天天向上(2017年2期)2017-06-09 06:38:14
电子制作(2017年9期)2017-04-17 03:00:36
中外管理(2015年3期)2015-03-18 18:13:02
振动、测试与诊断(2014年1期)2014-03-01 01:13:43
外科研究与新技术(2012年1期)2012-08-15 00:54:32

- Chinese Physics B的其它文章
- Origin of anomalous enhancement of the absorption coefficient in a PN junction∗
- Protection of isolated and active regions in AlGaN/GaN HEMTs using selective laser annealing∗
- First-principles study of plasmons in doped graphene nanostructures∗
- Probing thermal properties of vanadium dioxide thin films by time-domain thermoreflectance without metal film∗
- An improved model of damage depth of shock-melted metal in microspall under triangular wave loading∗
- Signal-to-noise ratio of Raman signal measured by multichannel detectors∗