Incorporating microgrids coupling with utilization of flexible switching to enhance self-healing ability of electric distribution systems
Saeed Mousavizadeh,Arman Alahyari,Seyed Reza Movahhed Ghodsinya and Mahmoud-Reza Haghifam
Abstract Electric distribution networks have to deal with issues caused by natural disasters.These problems possess unique characteristics, and their severity can make load restoration methods impotent.One solution that can help in alleviating the aftermath is the use of microgrids (MGs).Employing the cumulative capacity of the generation resources through MG coupling facilitates the self-healing capability and leads to better-coordinated energy management during the restoration period, while the switching capability of the system should also be considered.In this paper, to form and schedule dynamic MGs in distribution systems,a novel model based on mixed-integer linear programming(MILP) is proposed.This approach employs graph-related theories to formulate the optimal formation of the networked MGs and management of their proper participation in the load recovery process.In addition, the Benders decomposition technique is applied to alleviate computability issues of the optimization problem.The validity and applicability of the proposed model are evaluated by several simulation studies.
Keywords: Load restoration, Distribution network, Microgrids coupling, Benders decomposition
1 Introduction
In recent decades, natural catastrophes such as hurricanes and floods have caused significant problems for electrical power systems,and some even resulted in large blackouts [1].This highlights the need to incorporate more resilience into the different sections of power systems [2].An electrical network should be able to quickly restore its loads in the case of a severe event using an efficient restoration strategy.Some restoration strategies are introduced in [3], and approaches to acquire faster detection of outages are described in [4].The phenomena that can lead to significant outages and their impacts on the power systems have been studied thoroughly.Each of the studies addresses a particular aspect, including predicting outages, designing corrective actions,strengthening network structure, and providing appropriate restoration plans [5, 6].With the evolution of the smart grid and the emerging concept of local electricity markets in distribution voltage levels, expectations on electric distribution system are rising substantially [7].However, because of the weak structure and distinct characteristics of distribution networks such as long feeders,radial topology,and diversity of the components,they are more vulnerable to such incidents.
Among the possible solutions to enhance self-healing in distribution networks, distributed generation (DG)and MGs are considered as effective remedies [8–11].The advantages for restoration of such options have been extensively reported in the literature.These studies can be divided into three categories.In the first category,recovering the loads after the occurrence of low-impact events is examined, and different approaches are proposed accordingly [12–14].These studies mainly focus on changing the network configuration and switching operation after the event in order to reconnect the interrupted segments to the main network [15].The existing techniques perform satisfactorily in the fault-isolation phase aimed at recovering the maximum loads, though they confront serious difficulties in dealing with major events that have a different nature than the typical faults.Consequently, after high-impact events, the system’s desired functionality cannot be achieved by employing the conventional restoration methods.In the second group of studies, MGs are presented as eligible resources to restore the loads after severe disasters [16–20].However,in these studies, the MG servicing areas are predetermined while their formations during the failure period are not addressed.
The third category includes studies that consider coupling options for MGs.Reference [21] investigates the capability of coupled MGs to act as distributed systems to improve resilience during severe events.A service restoration method is proposed in [22] which uses MGs with limited generation resources to recover critical loads after an extreme event.In [23], the concept of autonomous MG coupling is investigated for improving resilience.Similarly, MG coupling is used in [24] for optimal restoration with the objective function of maximizing the restored critical load.However, in these studies,the network topological characteristics and the switching limitations are not adequately addressed.
The formation of MGs with proper switching operation is studied in [11, 25, 26], while [25] proposes a linear model regarding MG formation after the occurrence of events in the distribution systems.However, the use of tie lines and employing different configurations are not considered.In [11], based on a second-order integer programming approach, a model is proposed to study the impact of reconfiguration capabilities on the load restoration process, though the number of formable MGs and the master generation units, and the dominant controllers in each MG, are predetermined and fixed.
The coupling of the formed MGs and their load sharing during the failure period have not been studied.In addition, the modeling of different types of switches(flexible or non-flexible) and their operational constraints in the recovery process have not been adequately addressed.Inadequate modeling of the switching capabilities can unfold several issues in obtaining measures required for system performance improvement in critical conditions.Thus “failure duration”, which has not been included in the proposed models in previous studies needs to be considered.
In this study, by presenting a linear path-based model,the mentioned shortcomings are conveyed, and the topological features of distribution networks and DGs’master controlling potentialities are addressed.In the proposed approach, the formation and the optimal scheduling of the networked MGs are addressed in the form of a linear optimization problem.The time-related features of the events are included and various switching capabilities for coupling the formed MGs during the failure period are considered.Benders’ decomposition approach is also used to increase the computability and enhance the efficiency of the methodology.In summary,the main contributions of the paper are as follows:
The remainder of the paper is as follows.In Section 2,the advantages of MG coupling in the self-healing process and the required switching capabilities are discussed.The proposed framework for load restoration is described and formulated in Section 3.In Section 4, several simulation studies are presented, and finally, the paper is concluded in Section 5.
2 MGs coupling benefits
In this study, the methods to form dynamic MGs and schedule to reconnect them after a severe event are presented.At peak hours, each formed MG is only capable of providing its own loads, while for other times, by coupling the MGs and aggregating the resources, other loads can also be supplied.Thus, by considering the coupling option, maximum benefits can be accomplished during the recovery process.However, special switching devices are required for implementing such a capability.The switches in distribution networks are considered to be of two different types: flexible and non-flexible.Nonflexible switches are the ones whose open or closed status remains unchanged in the study period.
In contrast, changing the operation modes of the flexible type switches is conceivable during the period while considering the technical constraints.
The example shown in Fig.1 considers that T1 and T4 are flexible switches, T2 and T3 are non-flexible, and MG1 and MG2 can only supply their own loads at peak hours.Thus, to ensure the power balance constraint in the MGs, flexible switches T1 and T4 will be in open states during high load conditions.By decreasing the power consumption at off-peak hours, T1 and T4 will be closed to maximize the restored power by aggregating the generation capacities of the available resources in MG1 and MG2.Consequently, during these intervals,loads L3, L4, and L5 will be restored through the coupling and participation of the two MGs.

Fig.1 MG Participation in load restoration
Note that for implementing the aforementioned process and recovering the maximum loads during offpeak hours, it is necessary to select the closed state for the non-flexible switches T2 and T3.If the open state is chosen for them at the beginning of the period, load L5 cannot be recovered.In addition, selecting the closed or open states for T1 and T4 is affected by the consumption levels of L3, L4, and L5, and the shared generation capacities of the MGs.Therefore, determining the state of the non-flexible switches and scheduling the operation modes of the others during a failure period could significantly affect the self-healing process.
3 The proposed restoration framework
The proposed framework for load restoration consists of two main parts.In the first part, the model regarding the topological characteristics of the distribution network is presented.In this model, the formation of dynamic MGs, the determination of their servicing areas, and deployment of coupling options are formulated in the form of linear constraints.Using a path-based algorithm, the use of different configurations through applying tie lines is also considered.In the second part, modeling of electrical features of the network, including power flow constraints and scheduling of DGs, is investigated.The formulations regarding these two parts are presented in detail in the following sections.
3.1 Topological part
The network graph considering all the buses and lines(including tie lines)is extracted.Symbols H and Λ represent the network buses (nodes) and lines (edges), respectively.In each MG, at least one DG unit, which is called the master, can fulfill the stability requirements.The root node for a MG is a bus connected to the master DG in the MG.
3.1.1 MG territory constraints
Territory constraints can be formulated as:
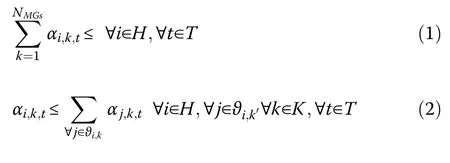
Equation (1) states that each node can be involved in only one of the formed MGs or none of them.If αi,k,tis set to one, bus i at the time t belongs to MG k, while the kthmember from the collection HCDGis considered the master.As formulated in (2), to associate a bus to an MG, at least one of its parents should be involved in that particular MG.Parents of a bus are the first buses of the existing paths between the bus and the root.For instance, in Fig.2, the parents of node i to reach root k are m,n, p, and q.

Fig.2 A sample graph
3.1.2 Connectivity and radiality constraints
To satisfy connection and radiality constraints, the paths among the buses in each MG are analyzed.The main goal is that only one of the available paths among the buses in a MG should be set to the active state.The radiality and connectivity conditions are assured between a bus and the common node of the paths that connect the node to root of the MG.The paths between the common node and the root node are then investigated to ensure the radiality and connectivity constraints.To extract the intersection of these paths, the approach in [26] is applied.As shown in Fig.2, these constraints are ensured for the existing paths between nodes i and ζ, and the paths between nodes ζ and k are then analyzed to satisfy the mentioned limits.Based on the above discussion, (3) and (4) can be used to validate the connectivity of bus i to its common node (node ϑ)as:

Additionally, the state of a path is dependent on the operation mode of the lines included in that path.This issue is formulated in (5) while its linearized form is given in the Appendix.

In the case of several paths between buses i and ζ, only one should be considered as an active path.Thus (6) is added to avoid the loops.So to achieve radial topology,at least one of the variables indicating the line states is set to zero.

3.1.3 Boundary constraints of MGs
The boundary constraints are shown in (7) where βl,trepresents the state of a line and is set to zero if both sides of the line are not included in the same MG.The symbol represents the logical XNOR operation.The linearized form of(7) is given in the Appendix.

3.1.4 Failure constraints
The failure states of the lines and the nodes are formulated respectively as:

3.1.5 Switching constraints
If a healthy line does not contain any switch, the active state is chosen for that line as shown in (10).Equation(11) demonstrates that the operation mode of the nonflexible switches does not change during the scheduling period, while the number of the allowed switching operations for the flexible types is also limited, shown by NSin (12).


If the auxiliary variable ul,tis equal to one, the operation mode of the available flexible switch on line l is changed between the time interval of t and (t+1).This variable is defined in (13) where the symbol ⊕represents the logical XOR operation.

3.2 Electrical part
3.2.1 Power balance condition for each bus
Equations (14) and (15) ensure the balance of the active and reactive powers at each node during the scheduling period as:

3.2.2 DG constraints
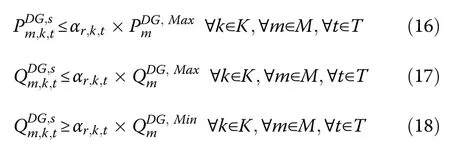
Equations (16)-(18) model the DG active and reactive power limits, where node r is the connected node to DG m,as:
3.2.3 Line flow limits
The maximum possible line flows are given as:

3.2.4 Voltage constraints
Equations (21) and (22) are the constraints regarding the actual limitations of the magnitude and phase angle of a node.It should be noted that if DG k becomes a master unit,the voltage magnitude and angle of the corresponding node are set at the controlled value of Vi;k;t=αi;k;tand zero, respectively.

3.2.5 Power flow constraints
The method in [27] is used to conduct the load flow calculations.As stated in [27], linearized equations of power flow in electric distribution systems can be formulated as:
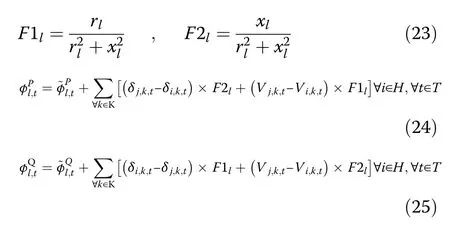
Equations (26) and (27) show the slack variable limits to make equality constraints valid when the nodes of a line are not involved in the same MG.

3.2.6 Objective function
Maximizing the total amount of the recovered loads considering their priorities is the objective function of the restoration problem, i.e.:

3.3 Solution methodology
The Benders’ decomposition approach [28] is adopted to decouple the topological and electrical parts in the optimization.The topological part is considered the master problem (MP), where the states of the network nodes and lines, open and closed statuses of the flexible and non-flexible switches, and MG configurations are determined.The electrical part is then assumed to be the sub-problem (SP) and is evaluated after determining the topological variables in the MP.The fitness values of the SP are sent back to the MP through generating Benders cuts.For better clarification of the procedure,the flowchart of the proposed optimal recovery model is depicted in Fig.3.

Fig.3 Decoupling the topological and electrical parts of the problem
The original optimization problem is decoupled into an MP and an SP.The MP is formulated as:

Equation (29) provides an initial lower bound solution:atand(set of the topological binary variables).The results of the MP are introduced to the SP for minimizing load curtailments at each MG and satisfying the network constraints.By introducing the auxiliary variables γ, the SP can be written as Eq.(30).

The solution of the optimal SP measures the variations in the objective function.This SP forms the corresponding Benders cut, which is added to the MP for solving the next iteration of the problem.The optimality cut associated with the nth trial solution is formulated as Eq.(31).
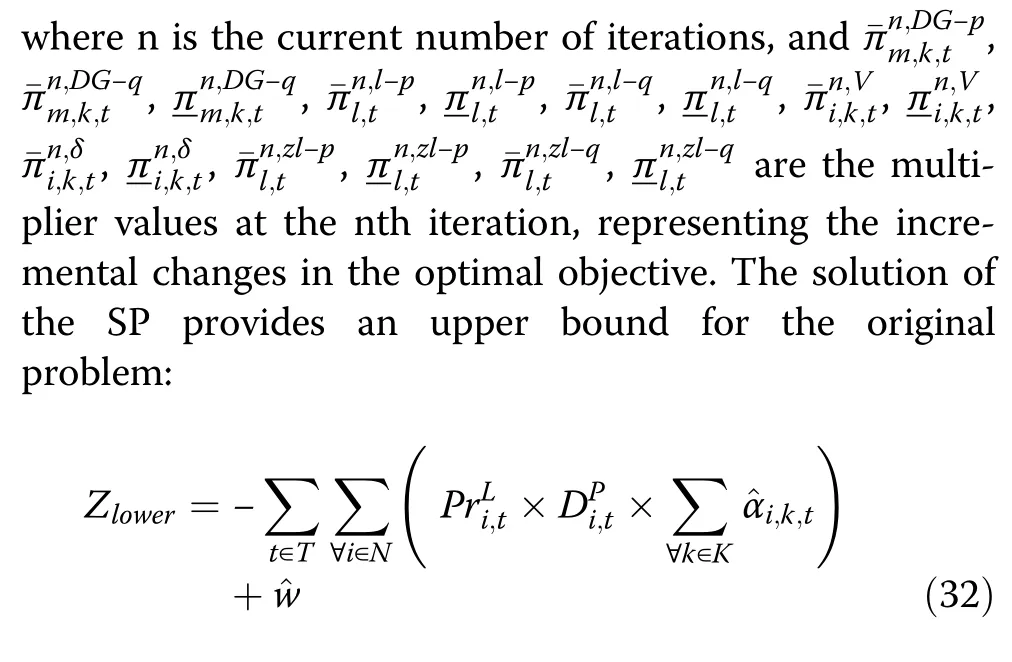
Defined lower and upper bounds can be used to create an effective convergence criterion.The process repeats until a converged optimal solution is found, i.e., when the optimal value of the SP (w) is as small as a preset threshold value.
4 Simulation results
The efficiency of the proposed model is investigated in this section.The simulations are programmed with MATLAB software and solved using the CPLEX solver,all conducted on a PC with Intel Core i7 CPU @4 GHz and 16 GB RAM, considering a gap of 0.02% as a convergence criterion.
4.1 Test network
The proposed model is applied to an 11.4 kV modified 84-bus test system depicted in Fig.4 [29], with total real and reactive power consumptions of 28.350 MW and 20.70 MVar, respectively.The network consists of 11 feeders, 84 buses, 96 lines, 13 flexible and 48 nonflexible switches.The flexible switches are located on the tie lines.Detailed information about the load consumptions, line parameters, and switch locations are given in (https://www.dropbox.com/s/aeznll8on2t6e9l/modified-84BusSystem-Data.xlsx?dl=0)].

Fig.4 Single line diagram of the test network
In addition, five DG units, with the ability to act as a master unit, are installed in this network.Therefore, a maximum of five MGs could be formed in this system.The required data on the installed DGs are given in Table 1.Figure 5 illustrates the consumption data for 1 day based on P.U.values, and the loads are considered as having equal priority.It is also assumed that the main sub-station is in the failure state (the buses with letters are all connected to this sub-station) because of a severe event.The failure condition, in this case, lasts 18 h (from 13:00 to 07:00).

Fig.5 Daily load profile[30]

Table 1 Required information about the DGs
4.2 Case I:impact of tie lines and DGs
In this case, six different strategies are implemented, and their impacts on the self-healing process are examined.These strategies are as follows:
MG coupling is not considered in this case, and all switches are assumed to be non-flexible types.The detailed results for each strategy are listed in Table 2.
The recovery index is the ratio of the recovered load consumptions to the system’s whole electric energy consumption during the study period.From the results,proper use of the generation along with the switching capabilities can significantly improve system functionality after the occurrence of the severe event.For instance, the recovery index increases to around 65% in strategy 6,using 150%capacity of DG units and applying tie lines.
These results accentuate the importance of optimal allocation of the technologies in the distribution networks.
The results show that a proper strategy based on costbenefit analysis should be adopted to enhance restoration capability.For example, in the test network, the system recovery index improves 9% by a 25% increase of the DG capacity in strategy 2, while applying the tie lines in strategy 4 increases the ability by 5%.Also, by employing the tie lines in strategies 4, 5 and 6, more flexibility is achieved, and the number of the formed MGs is also decreased.The formed MGs in strategy 4 are depicted in Fig.6.The obtained simulation execution times reported in Table 2.Confirm the computability and efficiency of the proposed algorithm.

Fig.6 Formed MGs in strategy 4

Table 2 Impact of applying different strategies
4.3 Case II:impact of MG coupling
The participation of MGs in load restoration during the failure period is now investigated.The impact of applying MG coupling in strategies 4, 5, and 6 are stated in Table 3.In Mode 1, coupling is not used, and in Mode 2, coupling is applied.

Table 3 Impact of MG Coupling
Based on the results, with MG participation, system recovery in strategies 4, 5 and 6 is improved by around 14%, 16%, and 17%, respectively.The improvement in the recovered energy is due to the fact that, without employing coupling options, only one configuration could be implemented for MG formation.However, by considering flexible switching, different dynamic structures are used and consequently more benefits are attained.For a better explanation, scheduling of MGs in the self-healing process regarding the tie lines and full capacity of DGs (strategy 4) is analyzed.Three different configurations are selected for MG formation in feeders A, G, and H, while the structures in feeders A, G, and H are depicted in Fig.7.Nine structures are obtained to form and couple the MGs on the other part of the network (feeders B, C, D, E, F, I,J, K).
As shown in Fig.7, three configurations are chosen in the study period with the proposed optimization approach.Because of low power consumption during the first interval (between 13:00 and 17:00), only one MG is formed, and structure I is selected for supplying the loads connected to feeders A, G, and H.In this structure, tie lines 84, 85, and 96 are in the closed state.At the second interval(between 17:00 and 18:00),by opening the flexible switch located on tie-line 84, and disconnecting loads L1 to L5, the formed MG in the previous interval becomes smaller, and structure II is employed, i.e., flexible switching capabilities are used for load management in this interval to achieve power balance in the MG.

Fig.7 MG configurations during the period
Because of high power consumption in the third interval(between 18:00 to 21:00), by applying structure III and opening tie lines 84 and 96, the mentioned MG is decoupled into two smaller MGs.Therefore, DG1 and DG4 are the master units in this time interval.Because of the decreased loads during the fourth interval (between 21:00 to 22:00) and the closing tie lines 85 and 96, structure II is used once again and the two MGs are joined together.At the next intervals (between 22:00 to 07:00), tie line 84 is closed and structure I is employed again.
The impact of MG coupling on the recovered energy and the recovery index at each time interval during the study period are depicted in Figs.8 and 9, respectively.As can be seen, by enhancing system functionality through flexible switching and realizing MG coupling,the restored energy, specifically during the low power consumption hours, is increased, and more benefits are attained.
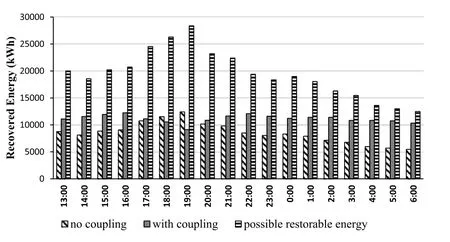
Fig.8 Restored energy in each hour

Fig.9 Recovery index in each hour
The lower recovery index for the period of 18:00 to 20:00 is due to the switching limits of the non-flexible switches.This indicates that the proposed approach sets the statuses of the non-flexible switches to improve the performance of the system, even at the cost of losing some of the benefits during the mentioned intervals.This highlights the importance of the optimal placement of the flexible and non-flexible switches in the distribution networks.
4.4 Comparing the efficiency
In this subsection, the convergence data of the proposed algorithm based on Benders’ decomposition is provided and the results are compared to those using the genetic algorithm (GA) proposed in [31], as shown in Figs.10 and 11, and Table 4.

Table 4 Comparison results
The GA method is implemented in MATLAB software, and its population, crossover, and mutation parameters are set to 100, 0.6, and 0.2, respectively.Strategy 4 in Case-I, which employs the tie-lines and 100% capacity of DGs, is considered for the comparison.As can be seen, the acquired results from the two approaches are quite close.However, the proposed approach is much faster, making it more attractive for practical application, especially when the grid size and the number of optimization parameters are large.

Fig.10 Benders’ decomposition convergence diagram

Fig.11 GA convergence diagram
5 Conclusion
In this paper, a load restoration process in distribution networks after a severe event is presented.The formation of MGs and their participation in load sharing during the failure period are formulated as a MILP optimization problem.To model the system topological characteristics, a novel linear approach that considers the network paths is proposed.The Benders’ decomposition approach is used to enhance computability.The impact of different items such as switching capabilities,DGs capacities, and coupling of MGs on the self-healing process are investigated.The simulation results show that the flexible switching and MG coupling capability can lead to more efficiency and improve system performance when dealing with such events.The proposed model properly employs coupled MGs to enhance the system recovery considerably.Incorporating other technologies, such as demand response programs and electric vehicles, and optimal placement of flexible switchesto enhance coupling proficiency are considered for future work.
6 Nomenclature
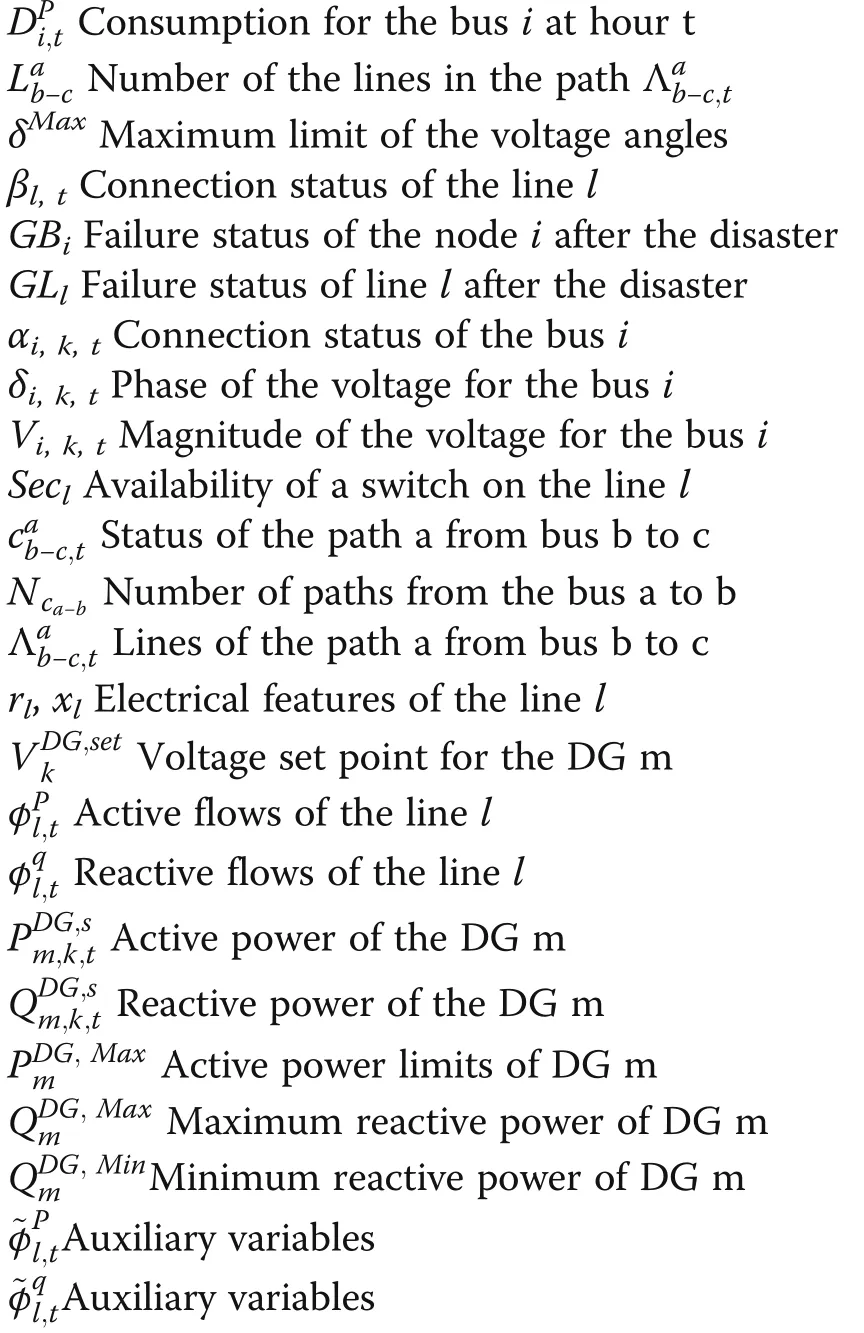
i Node index
k MGs index
m DGs index
Λ Collection of the network lines
H Collection of the network buses
K Collection of the formable MGs
M Collection of the DGs
θiConnected lines to the bus i
ΨlBuses connected to the line l
E A very big number
ζ Lowest common node of the parents
HADGConnected buses to the DGs
HCDGConnected buses to the controllable DGs
Ci−μAvailable paths between bus i and μ
NCDGNumber of the controllable DGs
NMGsNumber of the MGs that can be formed

7 Appendix
a) Linearized form of (5) is given as:

b) Auxiliary binary variables ϰl,k,tand ^ϰl;k;tare defined to linearize (7)as:

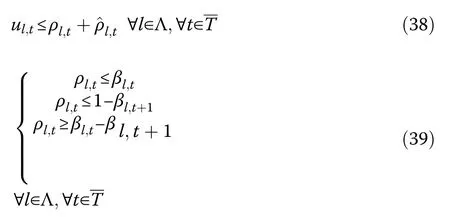
c) Auxiliary binary variables ρl,tand ^ρl;tare defined to linearize(13)as:

Acknowledgements
Not applicable.
Authors’ contributions
S M did the analysis of data and was in charge of running different simulations and writing the paper.A A was in charge of collecting the necessary data for analysis and simulations, doing literature review, and writing the article.S R M participated in the overall design of the work and running simulations and interpreting the results and finally M R H made contributions in the concepts and idea and final preparation of the article.The author(s)read and approved the final manuscript.
Funding
There is no funding for this article.
Availability of data and materials
The datasets used and/or analysed during the current study are available from the corresponding author on reasonable request.
Declaration
Competing interests
The authors declare that they have no known competing financial interests or personal relationships that could have appeared to influence the work reported in this paper.
 Protection and Control of Modern Power Systems2021年0期
- Protection and Control of Modern Power Systems的其它文章
- A comprehensive review of DC fault protection methods in HVDC transmission systems
- Application of a simplified Grey Wolf optimization technique for adaptive fuzzy PID controller design for frequency regulation of a distributed power generation system
- A critical review of the integration of renewable energy sources with various technologies
- Operational optimization of a building-level integrated energy system considering additional potential benefits of energy storage
- An integrated multi-energy flow calculation method for electricity-gas-thermal integrated energy systems
- Sliding mode controller design for frequency regulation in an interconnected power system
