Sliding mode controller design for frequency regulation in an interconnected power system
Anand Kumar,Md Nishat Anwar and Shekhar Kumar
Abstract In this paper, a Sliding mode controller design method for frequency regulation in an interconnected power system is presented.A sliding surface having four parameters has been selected for the load frequency control(LFC) system model.In order to achieve an optimal result, the parameter of the controller is obtained by grey wolf optimization (GWO) and particle swarm optimization(PSO)techniques.The objective function for optimization has been considered as the integral of square of error of deviation in frequency and tie-line power exchange.The method has been validated through simulation of a single area as well as a multi-area power system.The performance of the Sliding mode controller has also been analyzed for parametric variation and random loading patterns.The performance of the proposed method is better than recently reported methods.The performance of the proposed Sliding mode controller via GWO has 88.91%improvement in peak value of frequency deviation over the method of Anwar and Pan in case study 1 and similar improvement has been observed over different case studies taken from the literature.
Keywords: Load frequency control, Sliding mode control (SMC), Grey wolf optimization, Particle swarm optimization, Multi-area power system
1 Introduction
In an interconnected power system, load frequency control (LFC) is necessary to keep the frequency of each area and the tie-line power exchange within the specified limit [1–3].
The main objective of LFC is to regulate the frequency and tie-line power flow within the control area.The main control challenges in LFC are system model parametric uncertainty, non-linearity present in a realistic power system, and load-disturbances [4–6].
Various control techniques have been used in LFC to address these control issues, like model predictive control (MPC) [7], internal model control (IMC) [8], twodegree of freedom IMC (2DoF-IMC) [9], H-infinity control [10, 11], SMC [12–15], active disturbance rejection control (ADRC) [16, 17], the direct synthesis (DS) approach [18, 19] and artificial intelligence techniques [20]etc.
In recent times, the SMC design technique has gained more attention for being robust to modeling error, parametric variation, and external disturbance.These properties make SMC quite effective in many applications such as automotive systems [21], robotics [22], electric drives [23], wind-energy conversion systems [24, 25],process control [26, 27], unmanned aerial vehicles [28],etc.Recently the SMC technique has been used by many researchers to address the control issues of LFC [29–39].
Decentralized SMC has been designed for frequency control in a multi-area power system (MAPS), considering unmatched uncertainty, by Mi et al.[29].Qian et al.[30] have improved control performance by using neural network-based integral SMC for the LFC of a non-linear power system.The method has been extended by Qian and Fan [31] for frequency control of a power system with renewable energy.A non-linear Sliding mode controller with matched and unmatched uncertainty has been proposed by Prasad et al.[32] for LFC of a threearea interconnected power system.Further, Prasad et al.[33] have extended their SMC design method to control the frequency of wind-integrated power systems.
A quasi decentralized SMC scheme has been proposed by S.Yu et al.[34] for frequency regulation in a power system under load disturbance.Mu et al.[35] proposed an improved SMC based on adaptive dynamic programming for frequency stabilization in an LFC system with parametric uncertainties.A particle swarm optimization(PSO) technique is used to obtain an optimal value for the SMC controller.Sun et al.[36] proposed a robust Hinfinity SMC for frequency regulation in a MAPS with time delay.A new robust second-order SMC and extended disturbance observer has been proposed by Liao and Xu [37] for LFC in MAPS.This method first reduced the higher-order model to a lower-order model and then a new sliding surface is designed for SMC.Baghaee et al.[38] have designed a new decentralized SMC approach for frequency and voltage control in an islanded microgrid system.J.Guo [39] have used a fullorder SMC method to control the frequency of different area power systems.These reported schemes are generally based on a low–order model i.e.(first or secondorder) and for a higher-order system, the SMC controller may be designed by approximating the system to low-order one.
In this paper, a sliding mode controller is designed for a third-order system model.A sliding surface having four parameters is introduced and then the SMC control law is derived.This consists of two-parts: i.e.,a continuous part UC(t) and a discontinuous part UD(t).The parameters of UC(t) and UD(t) have been obtained by optimizing the cost function as the integral of square error.To get the optimum value of the controller parameter, PSO and GWO optimization techniques have been used.The simulation results show that the proposed method outperforms recently reported methods.
The major contributions of the paper are as follows:
This paper is organized as follows: the LFC model for a single-area as well as a multi-area power system along with the proposed controller design method is given in Section 2.The simulation results are shown in Section 3 and the paper is concluded in Section 4.
2 Sliding mode controller design
The SMC technique is a special type of variable structure control that was initially presented by Utkin and Vadim [12].The SMC is a robust control technique that can effectively compensate for plant model mismatch and load-disturbances.The desired behavior is represented through sliding surface s(t) and the objective of the sliding mode controller is to drag the state of the system to the surface and keep it there.
The conventional unity negative feedback configuration consisting of plant and sliding mode controller is shown in Fig.1.The symbols used in the block diagram have their usual meanings.

Fig.1 Conventional feedback configuration of system model
In this work, the sliding surface has been selected as an integro-differential equation given by

Here, e(t) is the tracking error, and k1, k2, k3and k4are the tuning parameters that are selected by the designer.The control objective in this case will be to ensure that e(t) and its derivatives must be equal to zero at all times,once s(t) is reached.So, to maintain s(t) at a constant value, it is essential to make its derivative equal to zero which can be mathematically represented as

After selection of the sliding surface the control law U(t) is developed by considering the condition in Eqs.(1) and (2), the SMC control law U(t), consists of a continuous control part UC(t) and a discontinuous control part UD(t) as

The continuous component Uc(t) is expressed as

where, f (x(t), r(t), e(t)) is the function of output, command signal and tracking error.
The discontinuous control law UD(t) includes a nonlinear element that denotes the switching element of the control law,

where KDand δ are the tuning parameters whose values are to be calculated.
The third-order transfer plant model has been considered as

Equation (6) can be written in differential equation form as

Equation (2) can be simplified as

The difference between the setpoint variable r(t) and the controlled variable x(t) is known as the tracking error e(t); that is,

Solving Eq.(7) for the third-order derivative of the controlled variable x (t), in conjugation with Eq.(9) and replacing the expression into Eq.(8), the following equation is obtained:
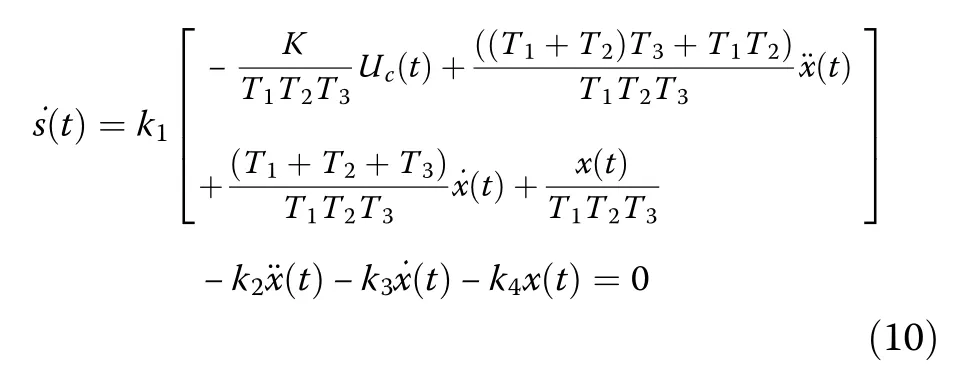
The control law UC(t) can be derived as

So, the resulting sliding mode controller is summarized as follows:

where

Here, sgn(K) is included in the system to guarantee the appropriate action of the control.
The tuning parameters k1, k2, k3, k4, KD,and δ are obtained with the use of the metaheuristic optimization technique.Several researchers have used the metaheuristic optimization algorithm to determine the controller parameters in different control problems.The particle swarm optimization (PSO) technique is used by Mehta and Kaya [40] while the cuckoo search (CS) algorithm is adopted by Mehta and Rojas [41] to obtain the controller setting.The democratic joint operation algorithm[42], grouped grey wolf optimization [43], the dynamic leader-based collective intelligence algorithm [44] are some recently reported optimization techniques which have been successfully implemented in different control problems.Here, we have used PSO and GWO optimization techniques to obtain the controller parameters in Eq.(12).
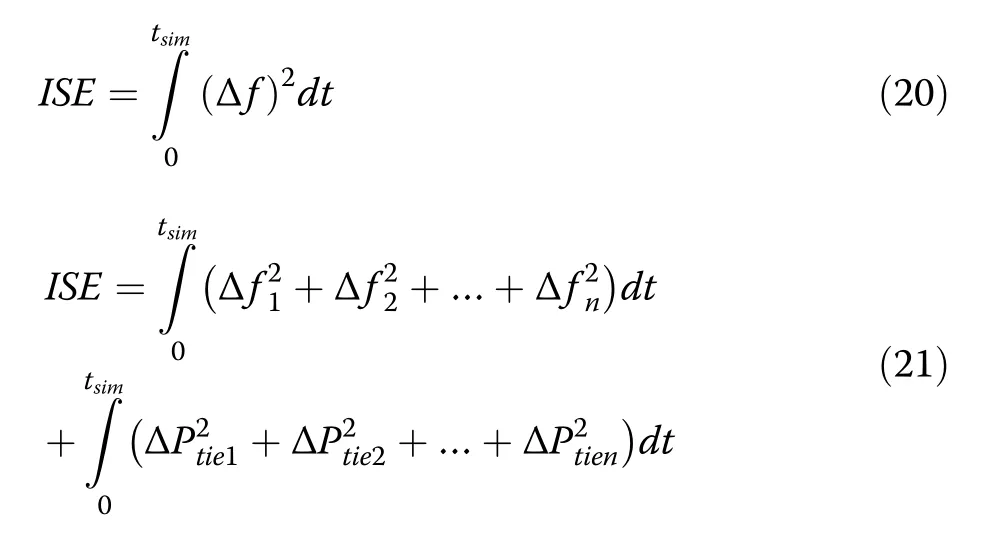
The integral of square of the error signal (ISE) is taken as the objective function.

The proposed controller design method is implemented for the LFC problem.The plant model for the LFC consists of governor, turbine, generator, and load.The schematic diagram of a single area power system(SAPS) is shown in Fig.2.
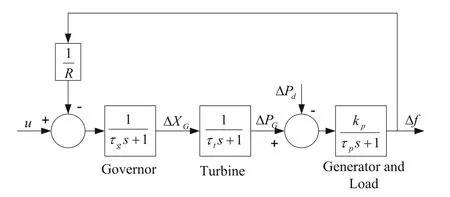
Fig.2 Linearized model of single area power system
Along with the droop characteristics R, the system transfer function from u to Δf can be written as:

The block diagram of a multi-area power system(MAPS) is shown in Fig.3.The proposed controller design method can also be extended to MAPS where the goal of LFC is to regulate the frequency of each area and further to maintain the tie-line power flow exchange between the areas.With the variation of load in the power system the area frequency and tie-line power interchange vary.So, a combined parameter, area control error (ACE), is a linear combination of deviation in frequency response and tie-line power flow exchange, and is used in each LFC of MAPS.
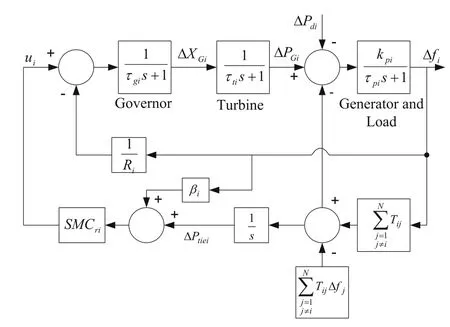
Fig.3 Schematic diagram of control area i
The ACE is of the ithcontrol area is defined as

where βiis the frequency bias coefficient.
For the system in Eq.(15) the continuous control law UC(t) can be obtained as
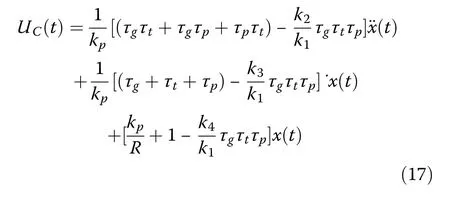
The resulting sliding mode controller can be written as:

where,

To obtain the controller parameters (k1, k2, k3, k4, KDand δ) PSO and GWO techniques have been used.In the case of SAPS the ISE of the frequency deviation is taken as the objective function (Eq.20) and in the case of MAPS, the ISE of the change in frequency in all the areas alongside the adjustment in tie-line power is taken as the objective function(Eq.21).
3 Simulation results and discussion
In this section, three SAPS, one two-area power system(TAPS), and one FAPS is considered for the simulation.The response obtained with the proposed method is compared with the recently reported methods in the literature.The performance has been evaluated in terms of peak value, settling time, percentage improvement in peak value, integral absolute error (IAE), integral of square error (ISE), integral time absolute error (ITAE) of the output response.
3.1 Case study 1:single-area power system with nonreheated turbine (NRT)
The parameters of the power system are taken from [18]as follows:

The tuning parameters k1, k2, k3, k4, KD,and δ of the proposed method as obtained from GWO are 0.01,15.1687,110.8602,116.59,0.0064,and 0.4270 respectively.The tuning parameters k1, k2, k3, k4, KD,and δ of the proposed method as obtained from PSO are 0.8617, 33.5230,245.306,680.97,3.4599,and 0.4414 respectively.
To check the controller performance, a load disturbance ΔPd=0.01 p.u.is applied at t= 1 s in SAPS.The frequency response obtained with the proposed controller is shown in Fig.4, and the comparison with Anwar and Pan [18] and Saxena and Hote [9] for case study 1 is reported in Table 1.It is confirmed from figure and table that the proposed method has much improved performance over those two.The performance of the proposed SMC controller via GWO has 88.91% improvement in peak value of frequency deviation over the method of Anwar and Pan [18] in case study 1.
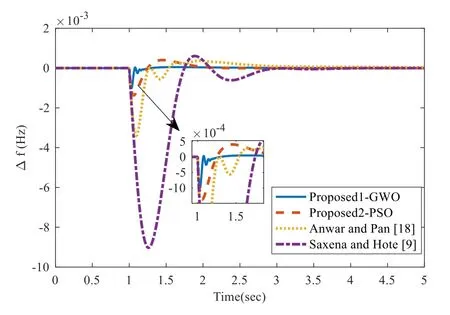
Fig.4 Frequency regulation for case study 1
3.2 Case study 2:single area power system with NRT
The parameters of SAPS are taken from Anwar and Pan [18].
kp=1:25;τp=12:5;τt=0:5;τg=0:2 and R=0:05
The tuning parameters k1, k2, k3, k4, KD,and δ of the proposed method as obtained from GWO are 0.0560,1.9292,29.8476,84.8252,0.0157,and 1.8729 respectively.The tuning parameters k1, k2, k3, k4, KD,and δ of the proposed method as obtained from PSO are 0.01,7.2728, 73.09, 242.13,0.4743, and 3.386 respectively.
A step load disturbance of magnitude ΔPd=0.01 p.u.is applied at t= 1 s in SAPS.The frequency response of the proposed method along with Padhan and Majhi [4]and Anwar and Pan [18] is shown in Fig.5 and the performance analysis of the proposed method is reported in Table 2.Table 2 and Fig.5 show that the proposed controller performs better in terms of peak value, settling time, ISE, IAE, and ITAE.The percentage improvement in the peak value of the proposed1-GWO method is 91.44% than that of Padhan and Majhi [4].
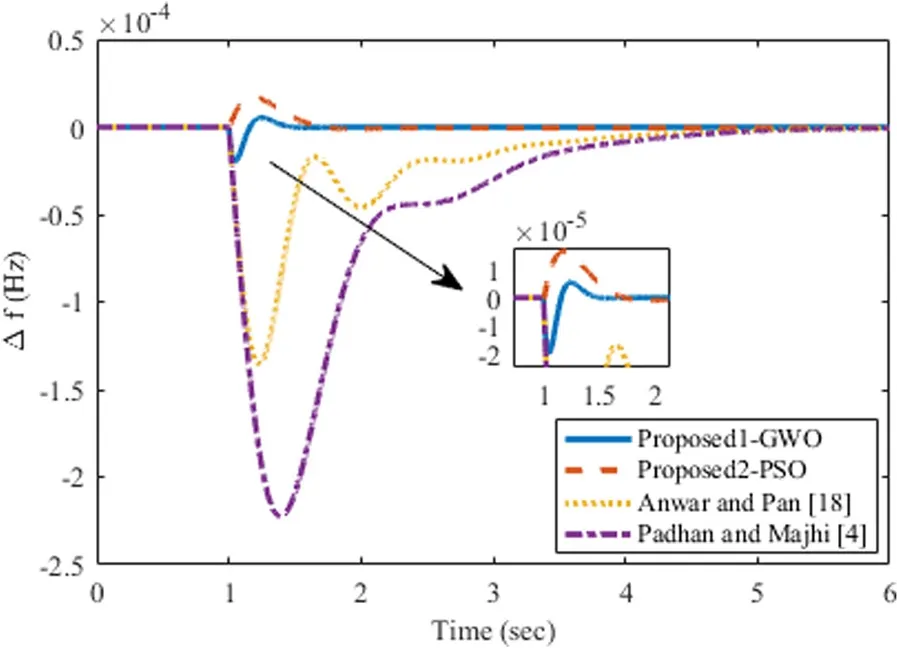
Fig.5 Frequency regulation for case study 2
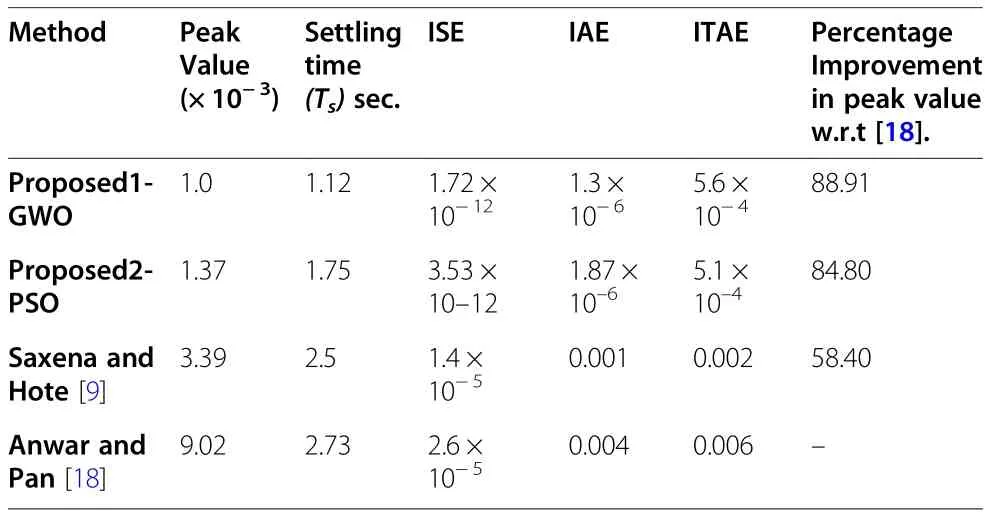
Table 1 Comparison analysis for case study 1
3.3 Case study 3:single area power system with NRT
A SAPS with NRT is considered as having the following system parameters Anwar and Pan [18].
kp=1;τp=10;τt=7;τg=0:2 and R=0:05
The tuning parameters k1, k2, k3, k4, KD,and δ of the proposed method as obtained from GWO are 1.50,27.54, 435.96, 872.3759, 1.02, and 1.1962 respectively.The tuning parameters k1, k2, k3, k4, KD,and δ of the proposed method as obtained from PSO are 1.195,22.463, 167.96, 593.11,0.3808, and 0.01 respectively.
To test the effectiveness of the proposed method, a unit step load ΔPd=0.01 p.u.is applied at t= 1 s in SAPS.The simulation response of the proposed method compared with that of Anwar and Pan [18] is shown in Fig.6 and its detailed analysis is reported in Table 3.
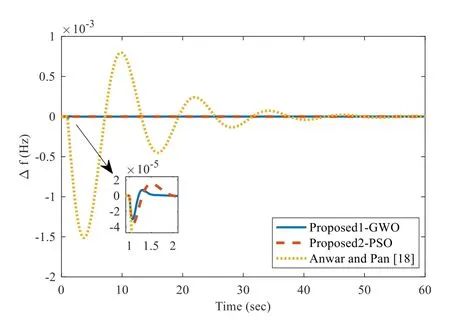
Fig.6 Frequency regulation for case study 3

Table 2 Comparison analysis for case study 2
From the above three case studies, it is seen clearly that the proposed method gave faster response with lower peak value.The performance of the proposed1-GWO method is observed in terms of IAE, ISE, ITAE,and it is better than that of the proposed2-PSO, Anwar and Pan [18].
3.4 Case study 4:single area power system with GRC
As a non-linear component like GRC is added to a power system it will produce oscillation and sometimes it may become unstable.In the case study 4,Fig.7 shows the GRC block is cascaded in a turbine transfer function model.
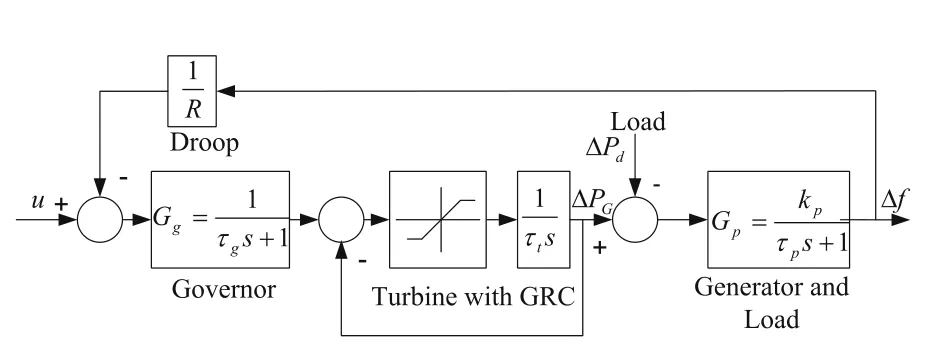
Fig.7 Single-area power system with GRC block
In case study 4, the effect of GRC is considered to exhibit the adequacy of the proposed method.The system parameters are the same as in case study 1.In case study 4, the value of GRC is considered as 0.1 p.u./min=0.0017 p.u./sec [18].The controller parameters in this case study are the same as in case study 1.The frequency deviation of the LFC system shows satisfactory performance in the presence of GRC, as shown in Fig.8.The proposed method outperforms when considering the GRC effect.
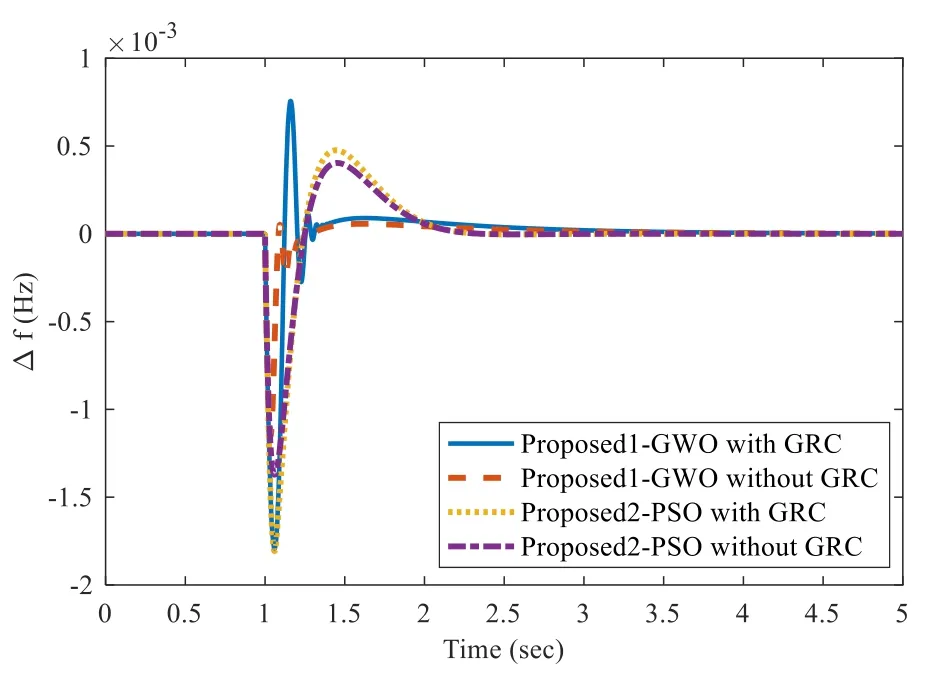
Fig.8 Frequency regulation of SAPS with GRC
3.5 Case study 5:two-area power system (TAPS) with NRT
A TAPS is considered taking an identical system model for each area having the following system parameters K.Lu et al.[6].

To illustrate the proposed method, five cases are taken from K.Lu et al.[6].Various cases are taken to analyze case study 5, which is given in Table 4.The block diagram of a two-area interconnected power system isshown in Fig.9.The tuning parameters k1, k2, k3, k4, KD,and δ of the proposed method as obtained from GWO are 0.3554, 18.4423, 156.7927, 317.8682, 0.8789, and 3.3124 respectively.The tuning parameters k1, k2, k3, k4,KD,and δ of the proposed method as obtained from PSO are 0.086, 9.797, 47.4837, 113.97, 2.2183, and 0.5419 respectively.The controller parameters for both areas are the same.
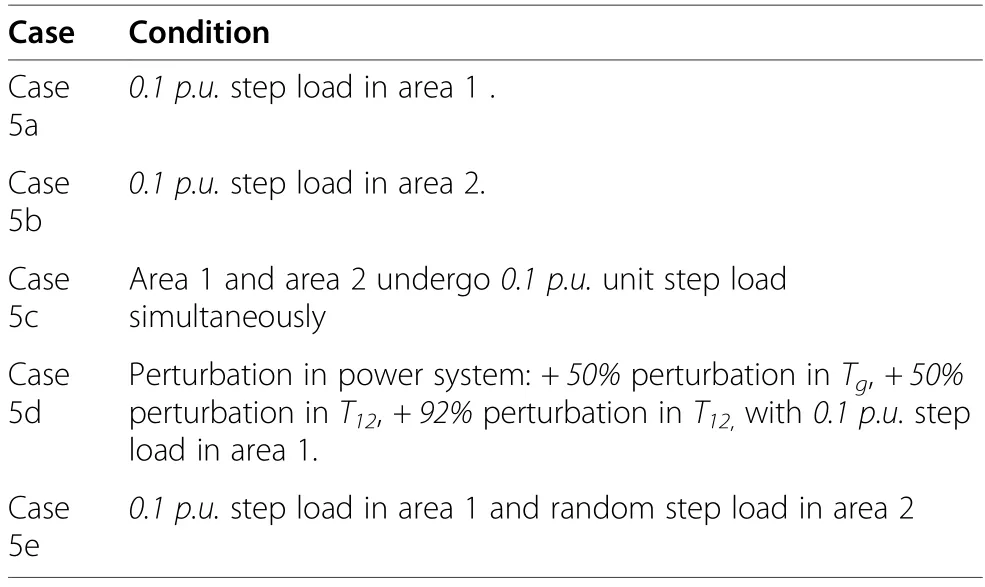
Table 4 The conditions for test cases for case study 5

Table 5 Parameters of four-area LFC system for case study 6

Table 6 Parameters of sliding mode controller based on GWO for FAPS

Table 7 Parameters of sliding mode controller based on PSO for FAPS
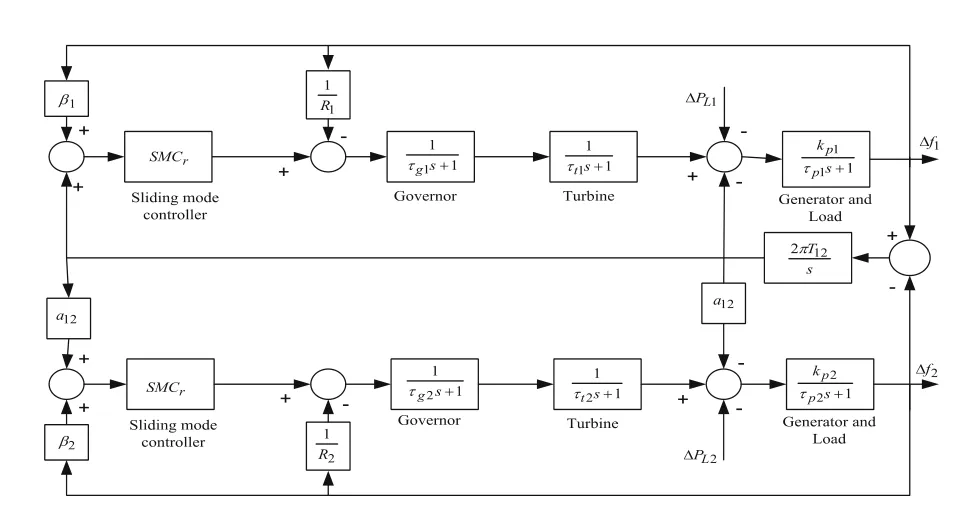
Fig.9 Two-area interconnected power system

Table 3 Comparison analysis for case study 3
3.6 Case 5a:0.1 p.u.unit step load in area 1 and area 2 load=0
In case 5a, 0.1 p.u.unit step load in area 1 is taken at t=1 s to illustrate the performance of the proposed method through simulation results in TAPS.
The frequency deviation in area 1, area 2 and tie-line power flow between the two areas for case 5a is shown in Figs.10, 11 and 12, respectively, and its response is compared with K.Lu et al.[6] and shows that the proposed1-GWO method gives the faster response and lower peak value for frequency regulation in TAPS.
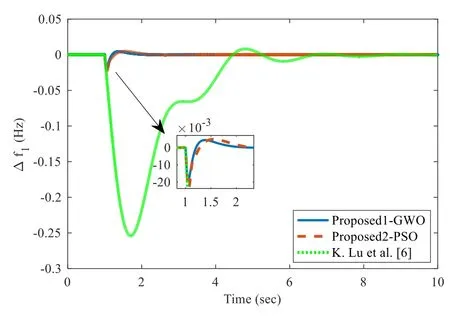
Fig.10 Frequency regulation in area 1 for case 5a
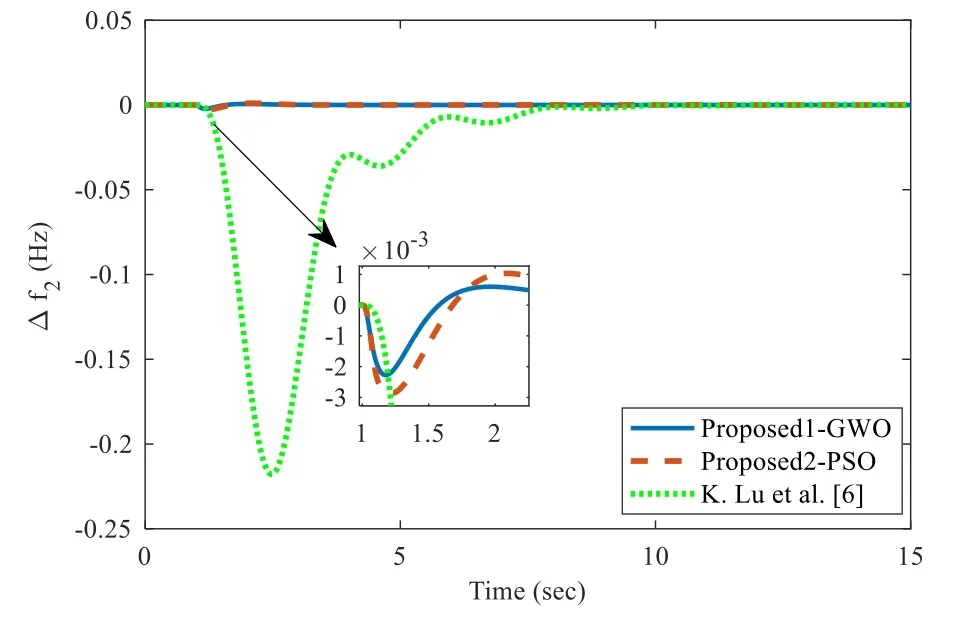
Fig.11 Frequency regulation in area 2 for case 5a

Fig.12 Tie-line power flow for case 5a
3.7 Case 5b: 0.1 p.u.unit step load in area 2 and area 1 load=0
In case 5b, 0.1 p.u.the unit step load in area 2 is taken at t=1 s to illustrate the performance of the proposed method through simulation results in TAPS.
The frequency deviation in area 1, area 2 and tie-line power flow between the two areas for case 5b is shown in Figs.13, 14 and 15 respectively, and its response is compared with that of the proposed2-PSO, K.Lu et al.[6] and show that the proposed1-GWO method has the faster transient speed for frequency regulation in TAPS.

Fig.13 Frequency regulation in area 1 for case 5b
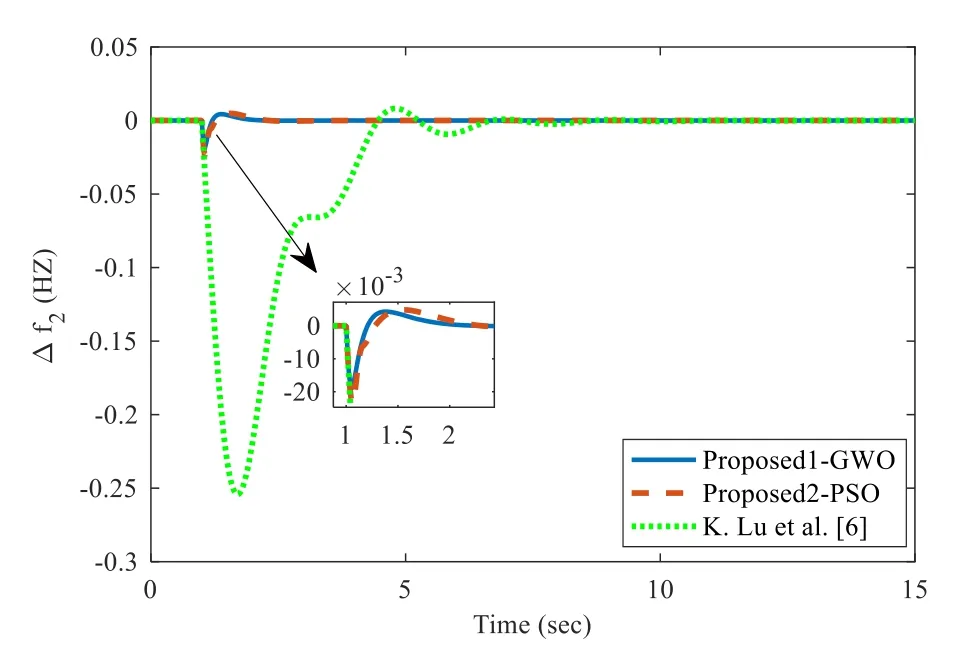
Fig.14 Frequency regulation in area 2 for case 5b

Fig.15 Tie-line power flow for case 5b
3.8 Case 5c: 0.1 p.u.unit step load in area 1 and area 2 simultaneously
In case 5c, area 1 and area 2 undergoing 0.1 p.u.unit step load simultaneously is taken to illustrate the performance of the proposed method through simulation results in TAPS.
Figure 16 shows the frequency regulation in area 1 and ACE in area 1 is shown in Fig.17.Figures 16 and 17 show that the proposed1-GWO controller has muchimproved performance over that of the proposed2-PSO,K.Lu et al.[6].
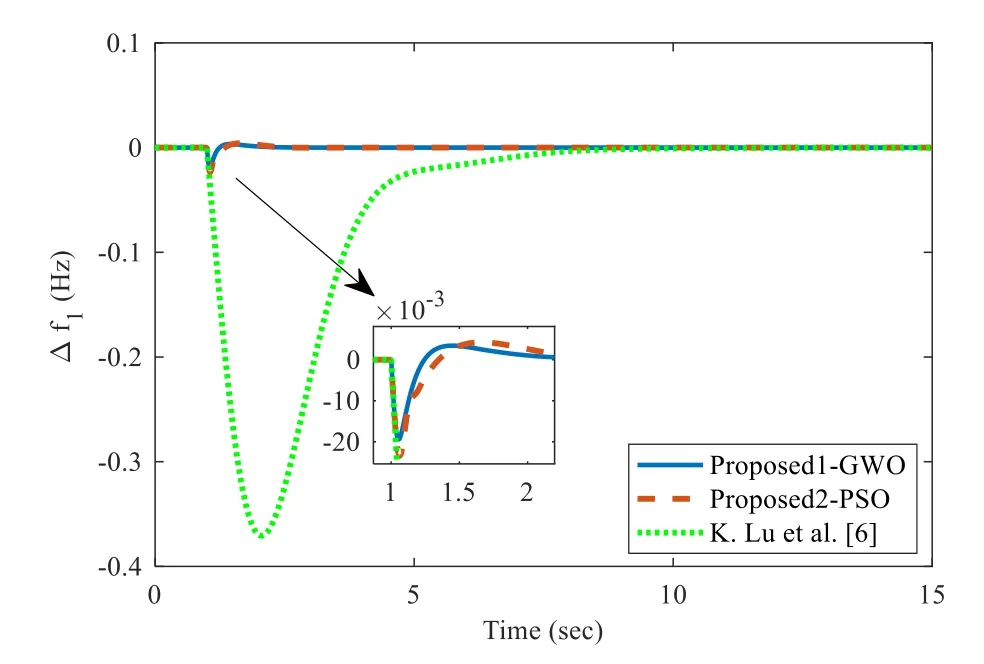
Fig.16 Frequency regulation in area 1 for case 5c

Fig.17 Area control error in area 1 for case 5c
3.9 Case 5d: +50% perturbation in Tg, +50% perturbation in T12, +92% perturbation in T12 with 0.1 p.u.step load in area 1
In case 5d, +50% perturbation in Tg, +50% perturbation in T12, +92% perturbation in T12, with 0.1 p.u.step load in area 1 is taken to validate the performance of the proposed method through simulation results in TAPS.
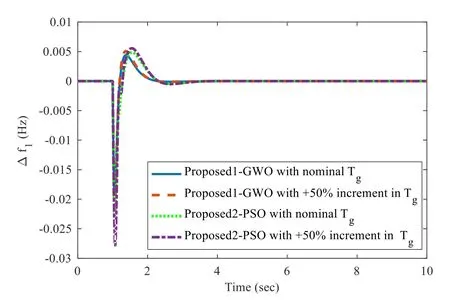
Fig.18 Frequency regulation in area 1 with+50%perturbation in Tg for case 5d
Figure 18 shows the frequency regulation in area 1 with +50% perturbation in Tg, Fig.19 shows the frequency regulation in area 1 with +50% perturbation in T12and Fig.20 shows the frequency regulation in area 1 with +92% perturbation in T12.From Figs.18,19 and 20 it can be seen that the proposed1-GWO method is more robust than the proposed2-PSO, K.Lu et al.[6].It can be noted that there is not much effect on the response in the case of plant parameter variation and so we can confirm that the proposed scheme is more robust.

Fig.19 Frequency regulation in area 1 with+50%perturbation in T12 for case 5d
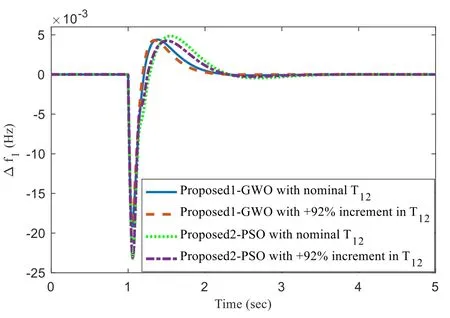
Fig.20 Frequency regulation in area 1 with+92%perturbation in T12 for case 5d
3.10 Case 5e: 0.1 p.u.step load in area 1 and random step load in area 2
In case 5e, 0.1 p.u.step load in area 1 and random step load in area 2 is considered to validate the performance of the proposed method through simulation results in TAPS.
Random step load variation in area 2 is shown in Fig.21.Frequency deviation in area-1, area 2 and tie-line power flow between the two areas for case 5e is shown in Figs.22,23 and 24 respectively, and its response is compared with that of the proposed2-PSO, K.Lu et al.[6] and confirm that the proposed1-GWO and the proposed2-PSO method is more robust for frequency regulation in TAPS.
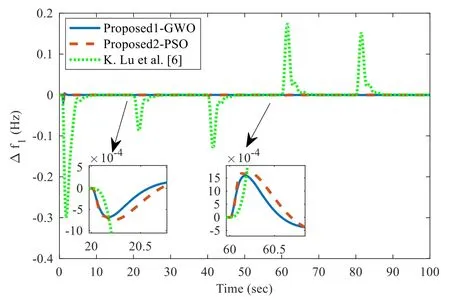
Fig.22 Frequency deviation in area 1 for case 5e under case study 5

Fig.23 Frequency deviation in area 2 for case 5e under case study 5
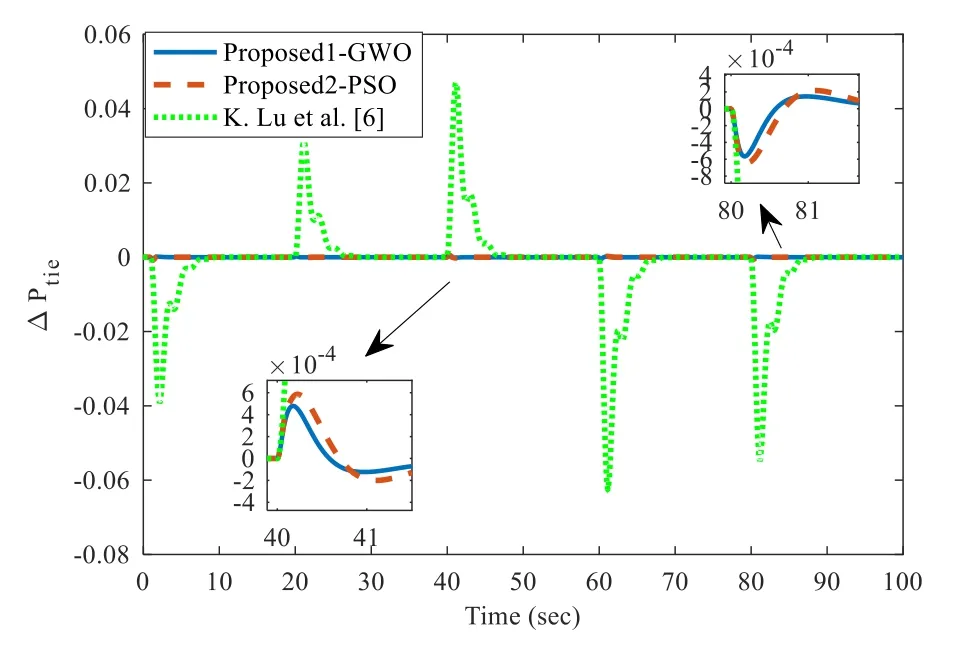
Fig.24 Tie-line power flow between two areas for case 5e under case study 5

Fig.26 Comparison of frequency deviation for FAPS in case study 6
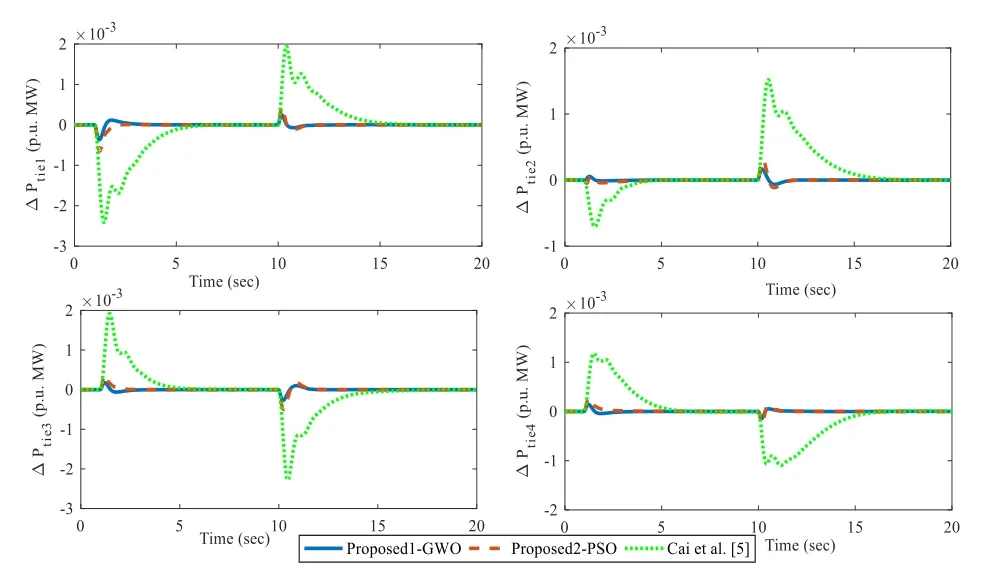
Fig.27 Comparison of tie-line power flow for FAPS in case study 6
3.11 Case study 6:four-area power system (FAPS) with NRT
A FAPS having the parameters as shown in Table 5 is taken from Cai et al.[5].The block diagram interconnecting the four areas is shown in Fig.25.The parameters of the sliding mode controllers obtained for the four areas from GWO and PSO are given in Tables 6 and 7.The simulation results of the proposed controller are observed by applying load demand ΔPL=0.01 p.u.MW at t=1 s in an areas no.1, 2 and load demand ΔPL=0.01 p.u.MW at t= 10 s in areas no.3, 4 simultaneously.The comparison responses of proposed1-GWO with that of proposed2-PSO method and Cai et al.[5] for case study 6 is shown in Figs.26 and 27.From these figures it can be seen that the proposed controller works very well in FAPS without any detoriation in system response.
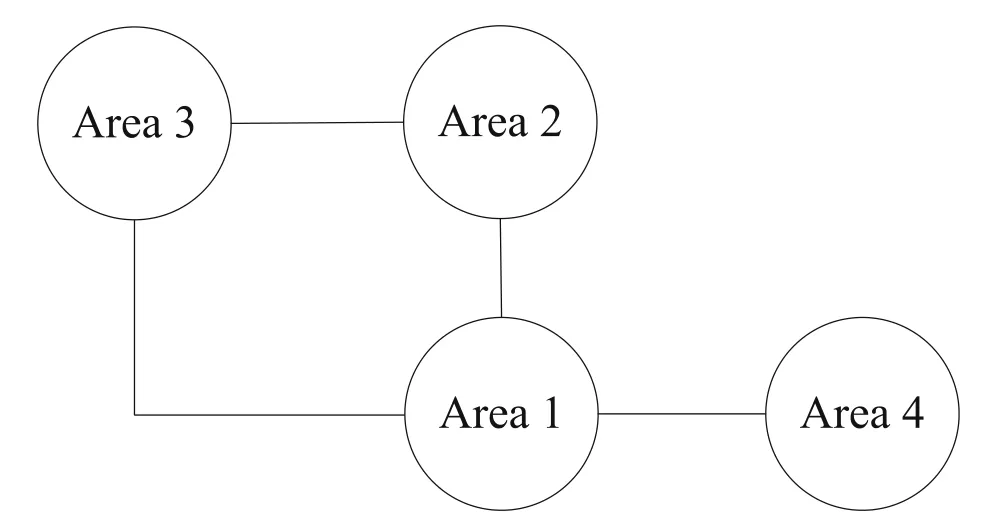
Fig.25 Simplified diagram of a four-area power system
4 Conclusion
In this paper, the sliding mode controller has been designed for a third-order system and implemented for frequency regulation in single-area, two-area, and four-area power systems.The optimal value of SMC controller parameters is obtained via the GWO and PSO optimization techniques.The efficacy of the proposed method has been analyzed with consideration of GRC, parametric uncertainty, and a random loading pattern.The proposed SMC controller via GWO performs better than the proposed SMC controller via PSO and other recently reported methods.From the simulation study, it is seen that the proposed method via GWO has 88.91% improvement in peak value of frequency deviation with that of Anwar and Pan while the proposed method via PSO has 84.80% improvement in case study 1.Future work on the proposed method is to implement in LFC problem considering wind energy,hydro-energy,and photo-voltaic systems.
Acknowledgements
Not applicable.
Authors’ contributions
All the authors have contributed in this manuscript.This manuscript is original research work.The author(s) read and approved the final manuscript.
Authors’ information
Not applicable.
Funding
Not applicable.
Availability of data and materials
The datasets supporting the conclusions of this article are included within the article.
Competing interests
I declare that authors have no competing interests.
 Protection and Control of Modern Power Systems2021年0期
- Protection and Control of Modern Power Systems的其它文章
- A comprehensive review of DC fault protection methods in HVDC transmission systems
- Application of a simplified Grey Wolf optimization technique for adaptive fuzzy PID controller design for frequency regulation of a distributed power generation system
- A critical review of the integration of renewable energy sources with various technologies
- Operational optimization of a building-level integrated energy system considering additional potential benefits of energy storage
- An integrated multi-energy flow calculation method for electricity-gas-thermal integrated energy systems
- Impact of communication time delays on combined LFC and AVR of a multi-area hybrid system with IPFC-RFBs coordinated control strategy
