Uncertainty modeling of wind power frequency regulation potential considering distributed characteristics of forecast errors
Cheng Yan,Yi Tang,Jianfeng Dai,Chenggen Wang and Shengjun Wu
Abstract Large-scale integration of wind power generation decreases the equivalent inertia of a power system,and thus makes frequency stability control challenging.However, given the irregular,nonlinear, and non-stationary characteristics of wind power, significant challenges arise in making wind power generation participate in system frequency regulation.Hence, it is important to explore wind power frequency regulation potential and its uncertainty.This paper proposes an innovative uncertainty modeling method based on mixed skew generalized error distribution for wind power frequency regulation potential.The mapping relationship between wind speed and the associated frequency regulation potential is established, and key parameters of the wind turbine model are identified to predict the wind power frequency regulation potential.Furthermore, the prediction error distribution of the frequency regulation potential is obtained from the mixed skew model.Because of the characteristics of error partition, the error distribution model and predicted values at different wind speed sections are summarized to generate the uncertainty interval of wind power frequency regulation potential.Numerical experiments demonstrate that the proposed model outperforms other state-of-the-art contrastive models in terms of the refined degree of fitting error distribution characteristics.The proposed model only requires the wind speed prediction sequence to accurately model the uncertainty interval.This should be of great significance for rationally optimizing system frequency regulation resources and reducing redundant backup.
Keywords: Inertial response, Primary frequency control, Error distribution,Mixed skew generalized error distribution,Uncertainty modeling
1 Introduction
With the increasing penetration of renewable energy being connected to the grid through converters, the inertia of the power system continues to decline [1].Wind power can affect the stable operation of the grid because of its inherent intermittency, randomness and volatility,none of which is conducive to system frequency stability[2].
Furthermore, the decoupling of wind turbine rotor speed and system frequency renders it unable to perform a natural frequency response [3].Replacing conventional power plants with wind farms deteriorates the frequency response performance of the system, leading to frequency fluctuation and control challenges [4].However,with auxiliary frequency regulation control, wind turbines can actively support sudden changes in system power imbalance for a few seconds[5].Growing concern over power system frequency stability issues have necessitated a series of guidelines and standards, which clearly stipulate that wind turbines should participate in frequency regulation [6–9].Consequently, to maintain the stable and economic operation of a power system,exploiting the potential of wind turbine frequency regulation has far-reaching significance.
Distinct from the slow dynamic behavior of traditional thermal power units, wind turbine possesses excellent regulating capability.Owing to its small single-unit capacity, large adjustable range of rotor speed, and small equivalent inertia time constant, a wind turbine can provide fast and flexible auxiliary frequency regulation [10].Currently, typical methods for wind power to participate in system frequency response mainly include inertia response and primary frequency regulation [4].It has been shown that the setting of the variable frequency control parameters is imperative to the system frequency dynamic characteristics and contribution of wind power[11].An augmented system frequency response model for the evaluation of wind power regulation contribution has been developed based on small signal analysis theory[12].Reference [13] conducts a value assessment on wind power reserve capacity for primary frequency support, while the injecting power of inertia response is derived through the second-order Taylor expansion in[14].However, such a simplified analysis method can only be effective in scenarios with small disturbances and low wind speed fluctuations.The impact of the droop gain on the transient and steady-state behaviors of the frequency dynamics is thoroughly analyzed in[15], while [16] studies the equivalent virtual inertia time constant of wind farms through a simplified model of doubly-fed wind turbines, and quantitative characterization of its virtual inertial response capabilities.
All the above methods characterize the potential of wind power frequency response from the perspective of energy conservation or power variation.The quantitative analysis and evaluation of the frequency regulation capability is mainly based on the simplification that treats the entire wind farm as a single equivalent unit.Driven by the typical sources of disturbance like the wake effect in a wind farm, the operating status of the turbines becomes more uncertain and unpredictable.In addition,the above analysis only discusses the specific active power controls, whereas with the diversified development of frequency regulation requirements, more advanced and efficient control strategy is the mainstream trend [17].Therefore, rather than limiting to a single fixed control strategy, research on wind power frequency regulation capability should take into account the potential maximum contribution to the system frequency for each wind turbine in the wind farm.Accurate perception of the wind power frequency regulation potential can provide a real-time baseline for system scheduling.As the wind turbines often deviate from the Maximum Power Point Tracking (MPPT) point because of the fluctuation of wind speed, traditional analysis methods are unable to capture the uncertainty of wind turbine frequency regulation potential in real operation.
Significant efforts have been made on the wind power forecast error distribution and fluctuation characteristics[18, 19].Similarly, given that wind power frequency regulation is a process of short timescales,its uncertainty characterization can be described by an ultra-short-term prediction error probabilistic distribution, with the general assumption that the prediction error obeys some specific form of distribution, such as a Gaussian, beta or t distribution [20].Since the distribution of ultra-shortterm forecast errors may have multiple peaks, a single conventional error distribution model cannot deal with them.To overcome such shortcomings, a mixed distribution model has emerged as an effective solution for describing the irregular characteristics of the probability distribution.The mixed distribution model is a mixture of multiple single linearly weighted distribution models,such as mixed Gaussian, t, and skew distributions [21,22].However, the shape parameter of a single model has limited ability in making adjustments for fitting, and thus cannot fully describe the characteristics of the spike and the thick tail of a diverse distribution.Another typical method of uncertainty modeling is through scenario generation employing artificial intelligence [23].For example,reference [24]constructs a deep generative adversarial network to generate scenarios pertaining to uncertain renewable energy output.However, such a deep-learning-based modeling method needs a significant amount of training time and has a special requirement regarding the sample quality.It is not suitable for short-term applications such as frequency regulation uncertainty modeling.
The rest of the paper is organized as follows.Section 2 presents the proposed modeling framework for the uncertainty modeling of wind power frequency regulation potential.In Section 3, the mapping relationship between that potential and the wind speed time series is derived.In Section 4, a Mixed Skew Generalized Error Distribution (SGED) model and a novel probability distribution model parameter estimation method are proposed to accurately describe the characteristics of the prediction error of the potential.The methodology of uncertainty interval generation based on error distribution is also detailed.In Section 5, case studies are carried out to validate the effectiveness of the proposed method in comparison with other typical methods.Finally, Section 6 draws the conclusions.
2 Proposed modeling framework
The uncertainty modeling of wind power frequency regulation potential consists of two stages: quantitative analysis of frequency regulation potential and uncertainty interval generation.In the first stage, based on the mechanism of the regulation, the key indicators affecting the potential of wind power frequency response are identified including the maximum kinetic energy and power reserve.An ideal mapping relationship between the frequency regulation potential and the wind speed sequence is then established.
Parameter identification using the operating data collected via a Supervisory Control and Data Acquisition(SCADA) system realizes the frequency regulation potential prediction pertaining to the wind speed sequence.This is compared to the obtained real data to generate the prediction error.The prediction accuracy can be improved by introducing error compensation.
In the second stage, a probability density fitting model is used to study the distribution characteristics of the prediction error.The fitting results are used to calculate the uncertainty interval of the wind power frequency regulation potential at different confidence levels.Based on the proposed modeling framework, the evaluation of wind power frequency regulation potential can further optimize the control strategies of wind turbines and wind farms, and guide the allocation of system frequency regulation reserve resources.The overall workflow of the proposed modeling framework is outlined in Fig.1.
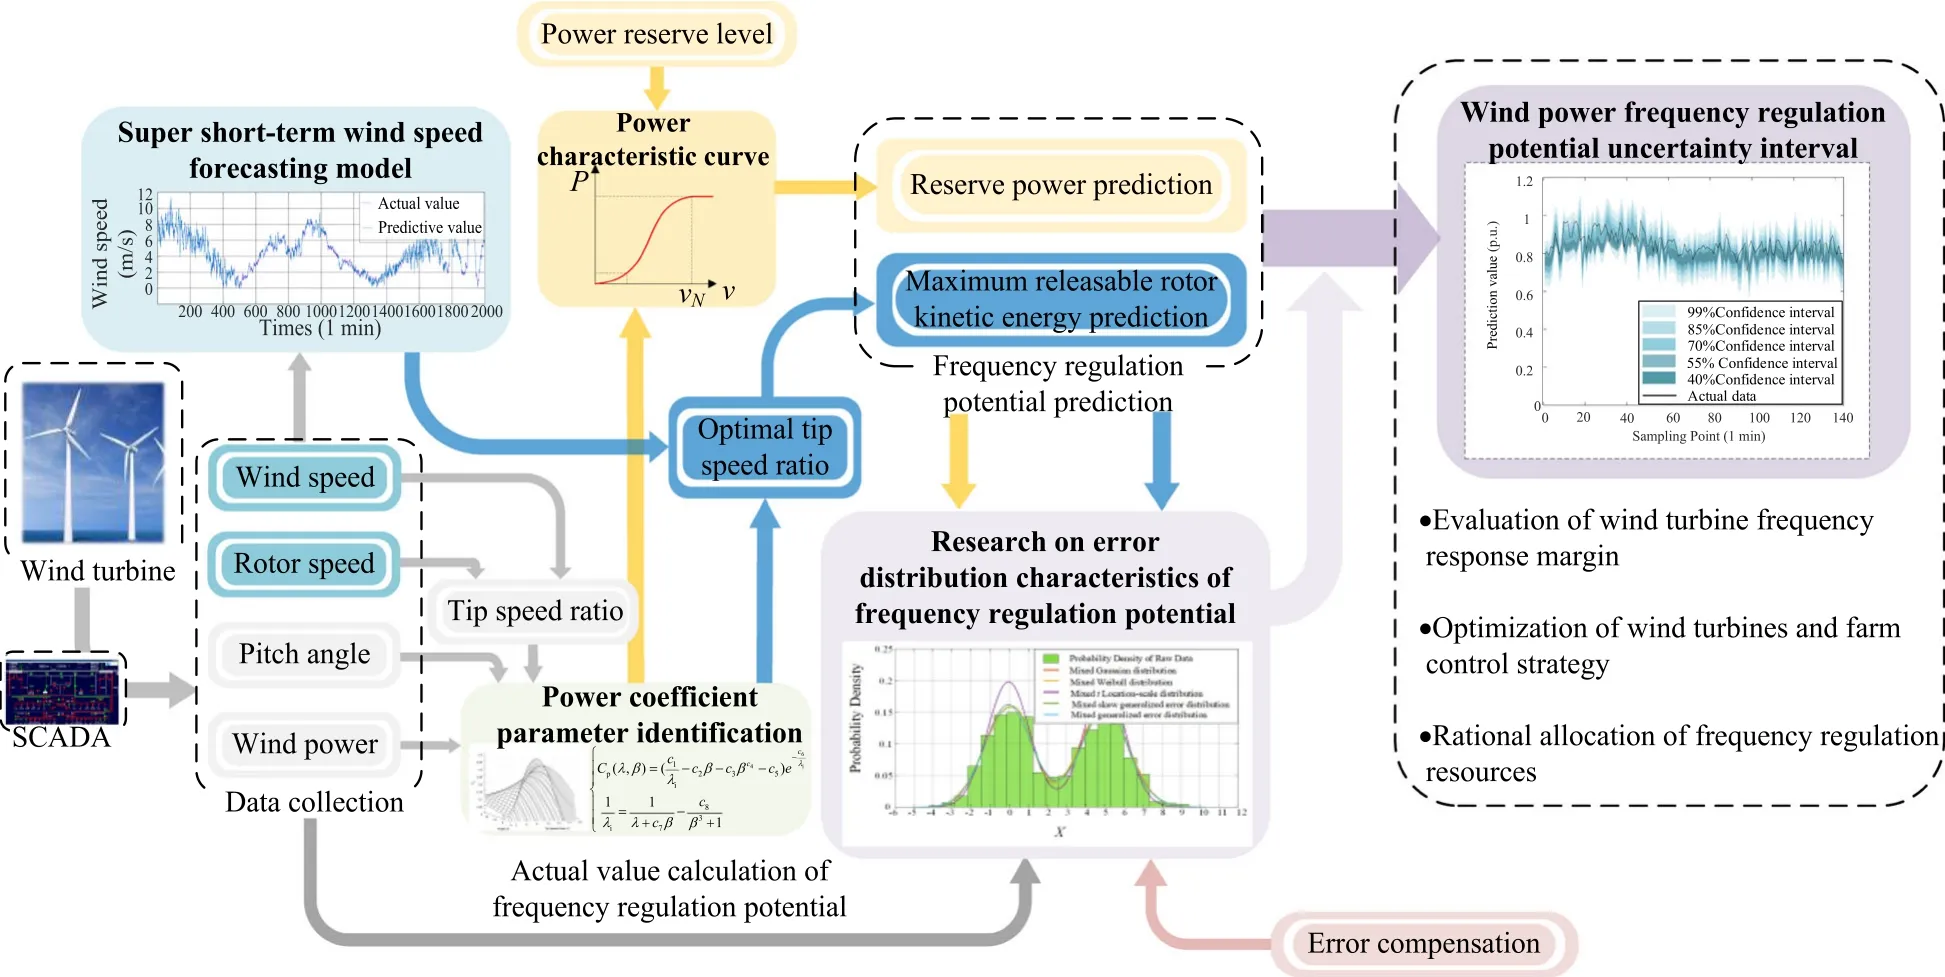
Fig.1 Overall workflow of the proposed modeling framework
3 Quantitative analysis method of wind power frequency regulation potential
3.1 Principle of wind power frequency regulation
Frequency regulation of the wind participating system mainly involves inertia response and primary frequency regulation.For the inertia response, the wind turbine can present droop and inertia characteristics when the frequency fluctuates, and the typical virtual inertia control is given as [11]:

where ΔP is the auxiliary power for the inertia response,and kpand kdare the proportional and differential coefficients of the controller,respectively.
Virtual inertia control essentially responds to system frequency change by releasing rotor kinetic energy ΔE,which can be defined as:

where ωoptand ωdelrespresent the rotor speed operated in MPPT mode and in the lower limit of frequency regulation, respectively.H is the equivalent inertia time constant of the wind turbine [16].
However, the stored rotational kinetic energy of wind turbines is limited and cannot cope with the frequency drop during large disturbances.In addition, excessive release of rotor kinetic energy can trigger low-speed protection and cause a second drop in system frequency.Therefore deloading strategies based on preserving wind power output margin are widely considered for primary frequency support.
For the primary frequency regulation, the Proportional Curtailment Strategy (PCS) [13] is usually adopted for the wind turbine.For a power reserve level of d%, the primary frequency regulation reserve power PPRCcan be expressed as:

where CPis the wind turbine power coefficient, ρ is the air density, v and R represent the input wind speed and the radius of the wind turbine, respectively.
For the power reserve level d%, the wind turbine has a reserve power margin for frequency regulation through overspeed and pitch control modes.As shown in Fig.2,during the frequency regulation period, the power injected by the wind turbine into the grid includes both reserved power release by decreasing the pitch angle and additional rotor kinetic energy due to overspeed.
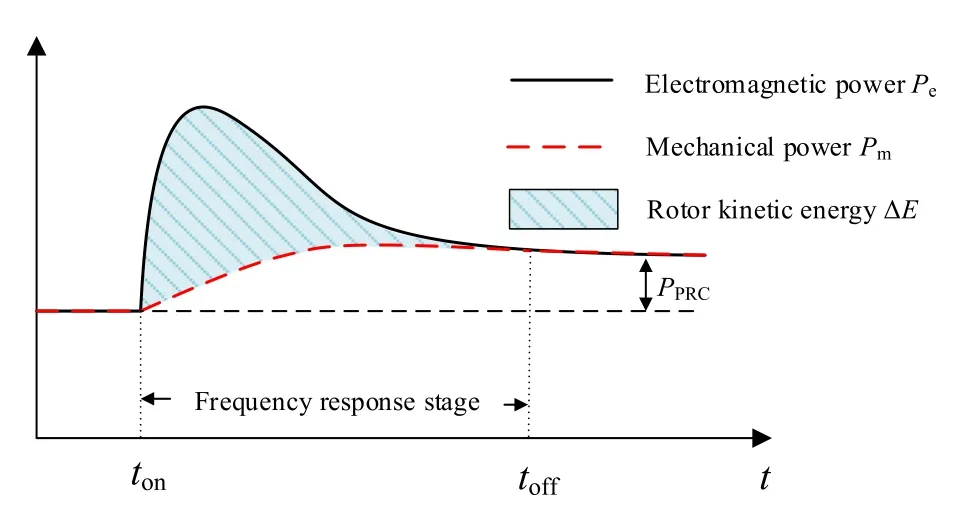
Fig.2 Schematic diagram of primary frequency regulation of wind power
Because of the different energy conversion mechanisms, there exists a fundamental difference between inertia response and primary frequency regulation [16].Therefore, wind power frequency potential should be characterized by the releasable rotor kinetic energy and power reserve.
We note that when we wish to calculate the frequency regulation potential in real operating scenarios, the wind speed sequence has strong temporal and spatial regularity.Also, the predicted wind speed time-series value is easy to obtain [25].Based on the mapping relationship between the established wind speed sequence and the frequency regulation potential, assuming a fixed speed wind turbine model, the changes in the wind power frequency regulation potential under different influencing factors can be calculated considering (2) and (3), as shown in Fig.3.As the wind power coefficient model of each wind turbine will vary significantly, the relevant parameter identification needs be performed.

Fig.3 Wind power frequency regulation potential,(a)Maximum rotor kinetic energy, (b)Primary frequency regulation reserve power
3.2 Identification of wind power coefficient
As mentioned above, wind power frequency regulation potential involves the dynamic relationship between the output power of the wind turbine, the rotor speed and the operating wind speed [26].To calculate the frequency regulation potential, we adopt a wind power coefficient model with eight independent parameters as in [27]:

The parameter identification problem can be transformed into the form of an optimization problem as:

where Pk(i) is the ithcalculated value obtained by (4),Pr(i) is the actual power, and N is the total number of samples.
3.3 Calculation method of frequency regulation potential
In this section, the method for predicting the wind power frequency regulation potential is introduced and the definition of frequency regulation potential prediction error is then provided.
With the identified wind power coefficient CP, the optimal tip speed ratio λoptcan be calculated accordingly:

Considering the wind turbine operating boundary characteristics, the maximum rotor kinetic energy ΔEmaxthat can be drawn from the wind turbine can be further derived as:

where λoptis the optimal tip speed ratio, and ωminis the lower limit unit value of the rotating speed in the frequency regulation.Equation (7) provides the mapping relationship between the wind speed sequence and the maximum releasable rotor kinetic energy.This decouples rotor kinetic energy and rotor speed.
From (6) and the identified λopt, the predicted maximum releasable rotor kinetic energy ΔEpcan be calculated, while the actual sampled rotor speed is used in (7)to obtain the maximum releasable rotor kinetic energy ΔEr.The error ΔEerr0can thus be expressed as:

The adopted wind power coefficient model involves multiple nonlinear regression relationships with wind speed v, rotor speed ω and pitch angle β.In the above calculation for the maximum releasable rotor kinetic energy, the transformation relationship between v and ω is derived.To obtain a complete wind power characteristic curve and calculate the primary frequency regulation reserve power, the procedures for establishing the relationship between v and β are used.A cubic polynomial fitting of the β-v curve is also performed by the least squares method:

Then the predicted reserve value Pdepfor primary frequency regulation can be expressed as:

The mathematical connection between the reserve power and v under the known d% can be established by(10).Considering the adoption of deloading control, the power reference value is multiplied by d% to achieve sub-optimal operation.Research has shown that wind turbines can accurately track the reduced power reference value [11].Therefore, for a wind turbine with the current optimal active power output of Pr,the actual primary frequency regulation power Pderat the reserved load shedding level d% can be expressed by d%Pr.The corresponding prediction error Perr0can then be expressed as:

where PNis the rated power of the wind turbine.
Considering the time variability of wind speed in the operating environment, the wind turbine will deviate from the MPPT state from time to time, leading to large fitting errors.In addition, the proposed calculation method of frequency regulation potential is based on the wind speed prediction sequence, so its prediction error and model parameter fitting error will accumulate in the calculation process, increasing the uncertainty of wind power frequency regulation [28].Hence, a fitting error compensation method is proposed.After compensation,the overall wind power frequency regulation potential error distribution will be more symmetrical, which is beneficial to the fitting of the error distribution.The error model can be expressed by a polynomial expression as:

Then the forecast errors of the wind power frequency regulation potential after error compensation can be expressed as:

where ΔEerrand Perrare the errors of the maximum releasable rotor kinetic energy and the predicted reserve power after compensation, respectively.Efit1(v) and Efit2(v) are the corresponding error compensation models.
4 Error distribution characteristics of wind power frequency regulation potential
The characteristics of wind power volatility and intermittency [29 ]make the frequency regulation potential full of uncertainty.In terms of the error distribution characteristics of forecast values, a corresponding distribution fitting model is established to realize a refined modeling and characterization of the uncertainty of wind power frequency regulation potential.To enhance the accuracy of uncertainty interval modeling,error distribution modeling and parameter estimation methods are presented.
4.1 Mixed skew generalized error distribution model
Wind power frequency regulation is a short process on a second time-scale, and only ultra-short-term prediction can meet the demand for its uncertainty characterization.The proposed method for the case of the time series subject to an ultra-short-term process is multi-peak and biased.Therefore, the error in the predicted frequency regulation potential will accumulate and multiply with the model fitting error.To achieve an accurate description of the prediction error,a mixed SGED model is proposed for the error distribution characteristics.
The SGED distribution introduces additional shape parameters in Generalized Error Distribution (GED) to describe the skewness of the distribution.This is especially suitable for an asymmetric distribution.SGED’s probability density function can be expressed as [30]:

where k describes the tail of the income distribution,and

When k<2, the SGED has a thicker tail than the Gaussian distribution, and vice versa for k>2.The value range of λ is [−1,1], and refers to the skew parameter.If λ>0, it indicates that the tail of the distribution is skewed to the right, and is skewed to the left for λ<0[31] (Table 1).

Table 1 Special cases of mixed generalized error distribution
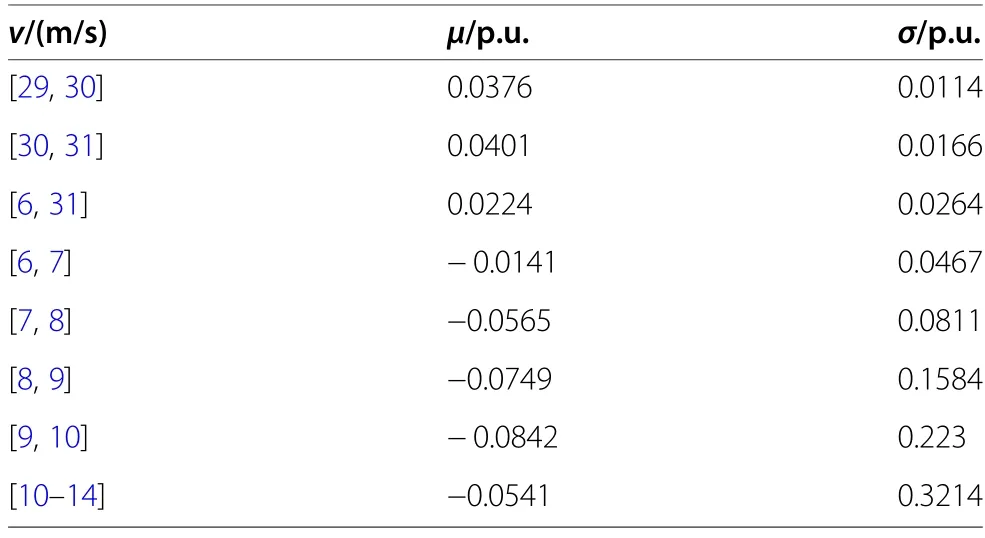
Table 2 Error statistical characteristics of primary frequency regulation reserve power
The mixed SGED model is a linear combination of multiple skew distributions.The probability density function of a mixed distribution model based on a skew distribution with K components can be expressed as:

where αkis the weight coefficient of different skewness distributions in the mixed skewness distribution, αk>0,and α1+α2+ …+αK=1.It can be proved that the mixed model satisfies the property that the integral of the probability density function in the whole domain is 1.
Any probability density function f(x) satisfies:

and its mixed model form is:

where K is the maximum number of components in the mixed model.

As shown in Fig.4, the mixed skewness distribution composed of a linear weighting of 4 SGED can more accurately describe the skewness, thick tail and multimodality in the error distribution.The skewness distribution 1 is mainly used for describing the skewness of the sharp peak distribution on the left; distributions 2 and 4 focus on describing the heavy tail on the right, and distribution 3 is a good description of the peak and valley positions of the bimodal curve.As can be seen the mixed skew distribution model can fit various distributions well while the K value is usually within 2~3.
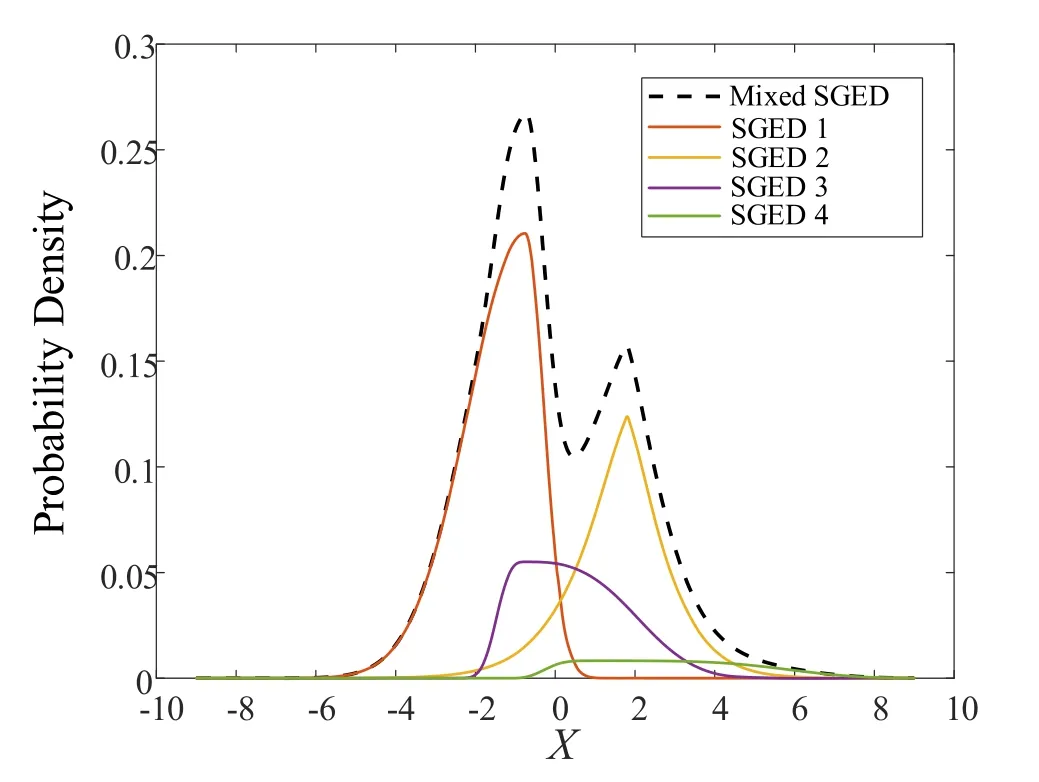
Fig.4 Generalized error distribution of mixed skewness
4.2 Parameter estimation method of distribution model
A single distribution model has fewer parameters to estimate, and the Maximum Likelihood Estimation method(MLE) can quickly converge.However, the analytical expression of the likelihood function of the MLE method directly used for parameter estimation of the mixed skew distribution is too complicated and difficult to solve.The Expectation Conditional Maximization (ECM) algorithm and the Markov Chain Monte Carlo (MCMC)method that are often used in parameter estimation of the mixed model will also have problems such as local convergence [32].
In order to realize an accurate estimation of the parameters of the mixed model, we propose a parameter estimation method to solve the problems related to the convergence of the MLE method and the selection of the initial value of the nonlinear fitting algorithm.First,the maximum component number K of the mixed model is determined and used as the number of clusters.The original data samples are clustered through the K-Means algorithm, which is a simple iterative clustering algorithm that uses Euclidean distance as a similarity index.Then MLE is used to estimate the parameters of various data samples to maximize the likelihood function, and the initial values of the parameters of each subdistribution model in the mixed model are obtained.The initial value of its weight can be calculated as:

where yiis the amplitude of the frequency density curve of various data samples after clustering.
A nonlinear fitting on the error probability distribution density curve is performed so that the obtained model parameter vector minimizes the residual sum of squares between the probability distribution model and the density curve, satisfying:

where C represents the parameters to be estimated in the distribution model, and xiL, xiRrepresent the left and right end points of the abscissa of the ithfrequency histogram in the distribution histogram.
The Levenberg-Marquardt (LM) algorithm is used to solve the above-mentioned nonlinear optimization problem.This combines the advantages of the gradient descent method and Newton’s method, while retaining faster convergence speed.Despite the many merits of the LM algorithm, it is more sensitive to the selection of the initial value.In this paper, the initial value of the mixed model is obtained through MLE, and alternating MLE and LM methods can quickly converge to the optimal value.The flow chart of model parameter estimation is shown in Fig.5.
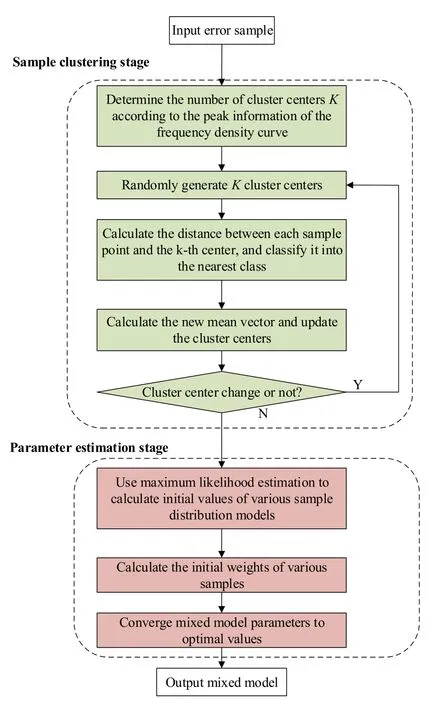
Fig.5 Flow chart of model parameter estimation
4.3 Uncertainty interval modeling method
After obtaining the predicted error probability density curve by fitting, the margin of the wind power frequency regulation potential under different confidence intervals can be obtained.With the statistical error margin, the uncertainty interval of the frequency regulation potential can be generated by superposing it on the predicted value.
The static error distribution model cannot satisfy the demand for accurate uncertainty modeling, because of the decoupling of model parameters and time series process.The output uncertainty interval in the relatively low prediction error section is too wide,and the estimation result is too conservative.These issues can be dealt with by the proposed segmented interval modeling method.Considering that the potential of wind power frequency regulation involves the energy stored by the rotor and the reserve power,both have a close coupling relationship with the wind speed.The wind power frequency regulation potential modeling and error compensation also link directly to the wind speed.Hence, we propose a segmented uncertainty interval modeling method.By dividing the historical operating wind speed sections, the error of the wind power frequency regulation potential under the corresponding section is obtained, and the appropriate probability density fitting model is selected in accordance with the error distribution characteristics.Based on this, the predicted results of wind power frequency regulation potential can be determined according to the wind speed forecast sequence.Combined with the interval error distribution model of the wind speed forecast value, the upper and lower bounds of the forecast error under the corresponding confidence level are calculated, and the upper and lower bounds of the corresponding uncertainty interval Lmaxand Lmincan be expressed as:

where Rfis the predicted value of wind power frequency regulation potential,andrepresent the respective upper and lower limits of the prediction error for the interval of the operating wind speed v under the characterization confidence τ.
5 Results and discussion
5.1 Data source
To assess the accuracy and applicability of the above model, this paper uses the SCADA data of a single wind turbine in a wind farm in China from June 19 to July 11,2015 for anlalysis.The wind turbine capacity is 1.5 MW and the data sampling interval is 1 min.The rated operating wind speed of the wind turbine is vN=12 m/s, the lower limit of the rotor speed ωminparticipating in the frequency regulation is 0.7 p.u., the upper limit ωmaxis 1.2 p.u., the reserved derating level d% is set to 10%, and the equivalent inertia time constant of the wind turbine is 5.04 s.
5.2 Data preprocessing
The error sample data of the wind power frequency regulation potential has been standardized during calculation such that the outliers and large continuous missing data in the original data are eliminated.In addition,the data is filtered according to the MPPT operating range of the wind turbine, and data that can participate in the frequency response time point is retained.
5.3 Model evaluation indicators
To compare the practicality of the model with other methods, this paper adopts the probability density curve error evaluation method to evaluate the fitting error between the probability density function and the frequency histogram of the error distribution.To avoid redundancy of information transmitted in the frequency histogram and the lack of key features, the following 4 indicators are synthetically used to evaluate the accuracy of the model [33].
1) Mean absolute error (MAE):

2) Root mean square error (RMSE):

3) Cosine included angle transformation Icos:

4) The coefficient of determination R2:
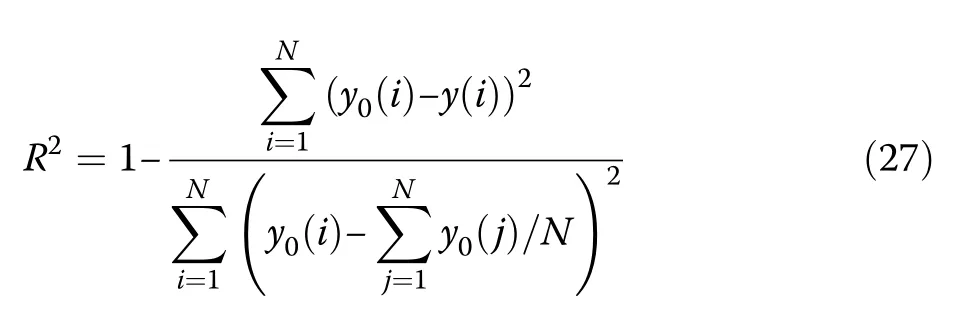
In (24)–(27), N is the total length of the sequence,y0(i) and y(i) are the actual and the fitted calculated values of the probability density of the itherror frequency interval, respectively.and Y0and Y are the actual and fitted values of the probability density of the error frequency interval, respectively.The cosine included angle transformation Icosis used to describe the similarity of two vectors in space, and its value range is [0,1].R2is used for measuring the interpretability of the statistical model used, and its value range is [0,1].It indicates whether the prediction error is greater or smaller than the mean reference error when the mean is used as the error benchmark, to reflect the fit of the model.
To verify the rationality of the predictive uncertainty model from the perspective of probability, the interval over-limit ratio η is used to measure the interval envelope characteristics of the uncertainty model:

where χ is a 0–1 variable, indicating whether the actual value Rsof the wind power frequency regulationpotential under the confidence τ falls within the uncertainty interval.
5.4 Fitting of probability density of wind power frequency regulation potential prediction error
To verify the effectiveness of the above method, the parameters in the wind energy utilization coefficient model are identified based on the operating data, and the optimal tip speed ratio calculated using (6).Because the model is highly nonlinear and sensitive to parameters, a Genetic Algorithm (GA) is used to solve the problem.
Once the optimal tip speed ratio λopt=5.341 is calculated, the maximum rotor kinetic energy ΔEmaxis obtained using (7).Furthermore, based on (8) and (11), the predicted values of the two frequency regulation potentials are calculated.From the error statistics, the wind power prediction errors show differences for each speed interval.Table 2 uses 1 m/s as the interval to count the average value μ and standard deviation σ of the primary frequency regulation reserve prediction error in each wind speed section.The data samples between 14 m/s and 18 m/s are small, so the segmented statistics are not performed.It can be seen that the power reserve prediction error of each wind speed segment fluctuates significantly, and the characteristics are significantly different.
Both the error compensation strategy and error segmentation characteristics modeling strategy proposed in this paper are conducted on the test samples.The maximum releasable rotor kinetic energy prediction error is directly compensated by (12) and (13), while the primary frequency regulation reserve power prediction errors are in accordance with Table 2 and the proposed wind speed partition results are combined with (12) and(14) for the error compensation.
Additionally, the proposed parameter estimation method is used to determine the model parameters.First, the number of clusters to be clustered is determined according to the maximum releasable rotor kinetic energy and the frequency histogram of the peak number of primary frequency regulation reserve power errors.For the mixed model, when the internal component K=2, the model is more applicable.The error distribution rarely occurs when the number of typical peaks is greater than 3 and the distance between the peaks is significant.Even in such cases, there is bound to be aliasing of peaks.Taking the probability density extreme point as a peak, it can still be fitted by a unimodal or bimodal model, namely K=2.

Fig.7 The distribution of the prediction error of the maximum releasable rotor kinetic energy
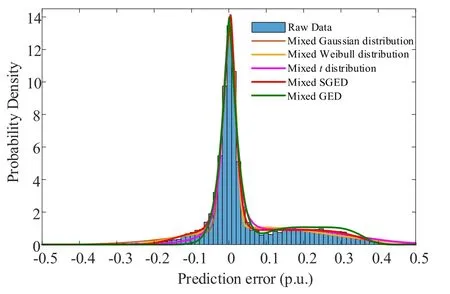
Fig.8 The distribution of the prediction error of the primary frequency regulation reserve power
With K=2, Fig.6 depicts the clustering of maximum releasable rotor kinetic energy and primary frequency regulation reserve power prediction errors.It can be seen that the K-Means algorithm can effectively adjust the original samples according to the set K value.The bimodal distribution shown in Fig.6 is not weighted, so it is more conducive to the initialization of the model parameters by the MLE method.
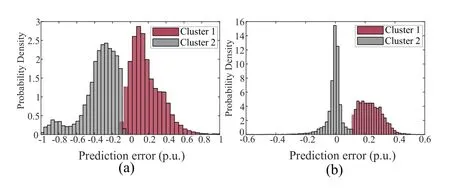
Fig.6 K-Means algorithm clustering results, (a) Maximum releasable rotor kinetic energy,(b) Primary frequency regulation reserve power
The model parameter estimation method mentioned above is used to converge the parameters of the mixed model to the optimal value.In order to further illustrate the accuracy of the mixed SGED in describing the error distribution of the wind power frequency regulation potential, it is compared with the mixed Gaussian distribution model, the mixed Weibull distribution, the mixed t Location scale distribution and the mixed GED.For model parameter estimation, all adopt the method proposed in this paper.
Figures 7 and 8 show the prediction error distributions of the maximum releasable rotor kinetic energy and primary frequency regulation reserve, respectively.Several mixed models can well reflect the multi-peak trend contained in the distribution.This proves the applicability of the proposed parameter estimation method.Both error distributions have the characteristics of thick tails and tail probability density curves.These can cause larger error intervals in the prediction data.Therefore, the fitting results of the error distribution tail are very important to the whole uncertainty modeling process.It can be found that the ability of the other mixed models to adjust the shape is limited, while the Mixed SGED is more effective in describing the distribution characteristics.
The model evaluation indicators corresponding to the different mixed distribution models are shown in Table 3.As can be seen, the mixed SGED has the best fitting effect on the frequency regulation potential prediction error distribution, and the evaluation results of various indicators are better than other distribution models,indicating that the probability density and true value of the mixed SGED model fitting are highly similar.

Table 3 Performance comparison of different methods
The fitting results of different scenarios for the proposed error distribution are shown in Fig.9.The frequency regulation potential error distributions with operating wind speeds between [6, 8, 30] are defined as conditional distribution 1 and conditional distribution 2,respectively.Figure 9 shows that the mixed SGED can fit the distribution characteristics of the original data well.In addition, the prediction error distribution varies significantly in different wind speed sections.For conditional distribution 1, the distribution range of wind power frequency regulation potential prediction error is significantly larger than that of conditional distribution 2, and is more concentrated, which can support the rationality of the proposed uncertainty modeling method based on different wind speed zones.
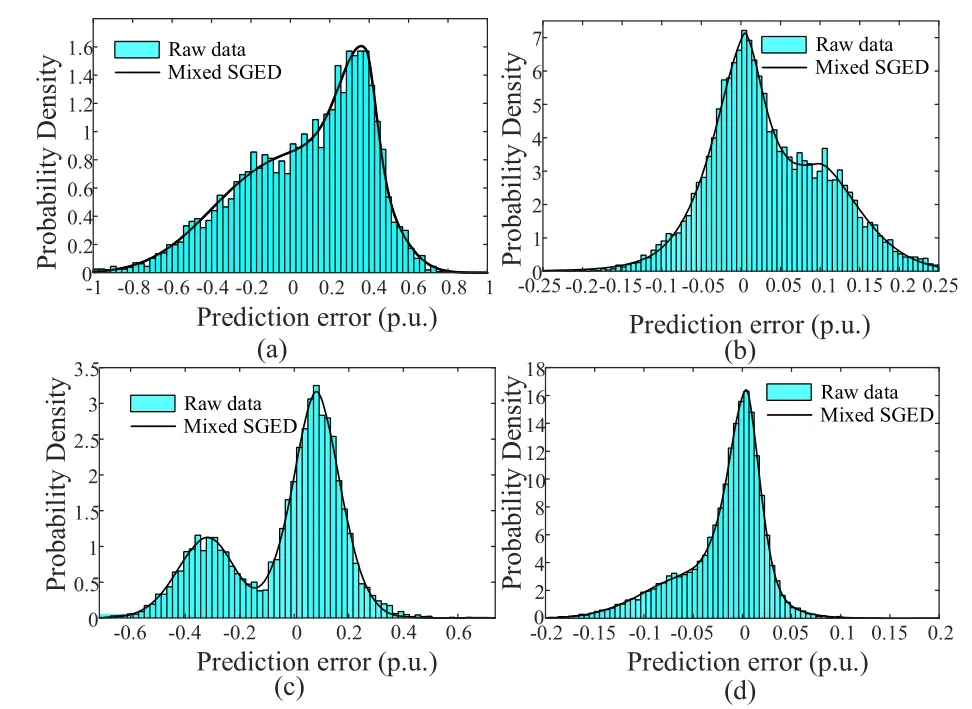
Fig.9 Error modeling for(a) Maximum releasable rotor kinetic energy error condition distribution 1,(b) Primary frequency regulation power reserve error condition distribution 2, (c) Maximum releasable rotor kinetic energy error condition distribution 2,(d) Primary frequency regulation power reserve error condition distribution 2
5.5 Uncertainty prediction interval generation
The predicted data of the operating wind speed of the wind turbine 6 h before July 12, 2015 is selected to calculate the predicted value of the frequency regulation potential at the corresponding time.According to the existing error distribution model, different confidence levels are generated for economic dispatch of wind power frequency regulation potential.
Figures 10 and 11 show the modeling results of the uncertainty interval of wind speed zones.The distribution of prediction error in the high wind speed interval diverges, with the predicted value containing obvious fluctuations.Consequently, the generated uncertainty interval is wider and the envelope of the true value is better, with no obvious difference of interval width at different confidence levels.The predicted output of wind power frequency regulation potential in the low wind speed section is close to the true value without significant fluctuation, and the relative uncertainty range is smaller.The above analysis shows that the proposed uncertainty modeling method for wind speed division is more accurate in describing the uncertainty of wind power frequency regulation potential.

Fig.10 Uncertainty interval of the maximum releasable rotor kinetic energy
The η of uncertainty intervals of releasable rotor kinetic energy and reserve power are shown in Figs.12 and 13,respectively.The wind speed segmentation modeling is named as a proposed method for simplification, and is compared with the mixed SGED and the GED models which disregard the segmentation characteristics of the error distribution.Because of the existence of abnormal values such as wind abandonment and peak shaving that cannot be effectively eliminated in the data preprocessing link in the error sample, the generated interval results by mixed SGED model and GED cannot accurately describe the predicted value uncertainty.Thus, as the confidence level increases, the adopted wind speed partition error modeling method gives more accurate uncertainty interval results,which can precisely envelop the true value in each wind speed zone.In addition, the proposed method has the lowest percentage of interval violations.In general, it is conducive to a realization of the refined frequency regulation reserve capacity configuration that considers wind power participation in frequency regulation.
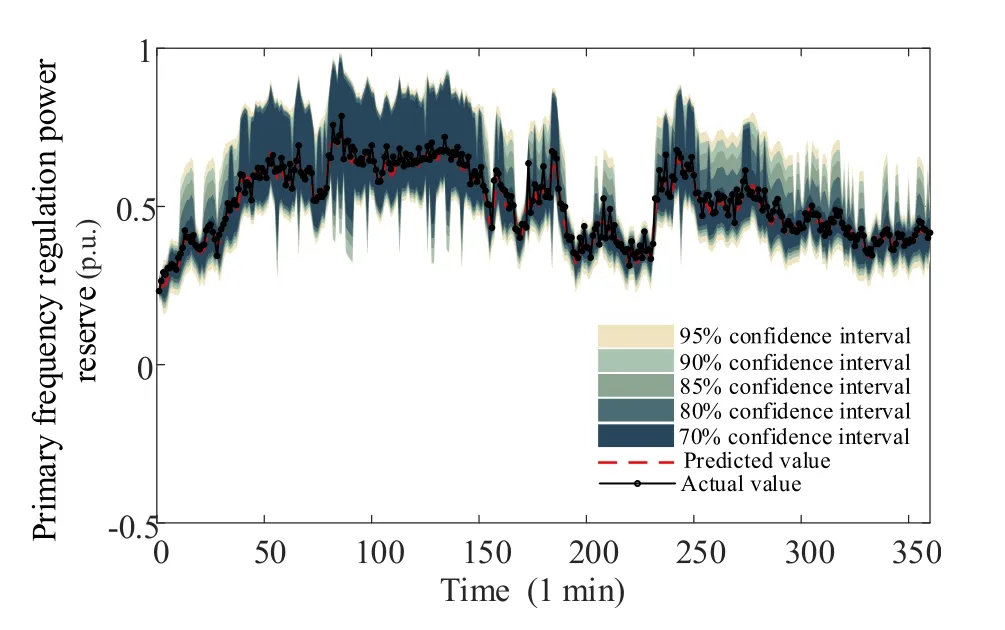
Fig.11 Uncertainty interval of primary frequency regulation reserve power reserve

Fig.12 Proportion of maximum releasable rotor kinetic energy interval over-limit
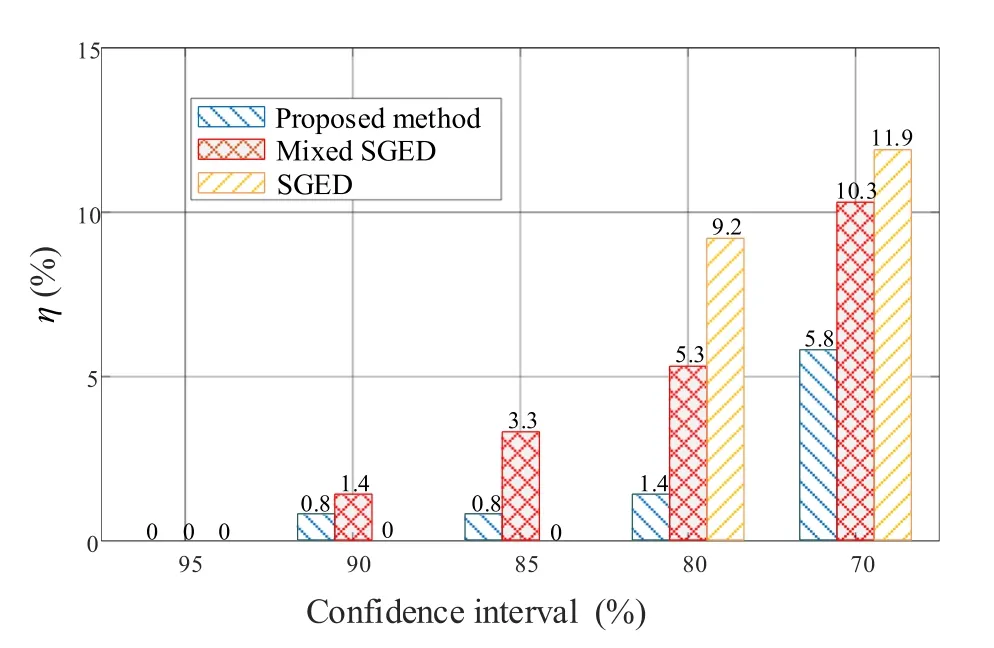
Fig.13 Proportion of over-limit of reserve power interval for primary frequency regulation
6 Conclusion
This paper proposes new evaluations of wind power participation in frequency regulation.The main conclusions are as follows:
(1) The wind power frequency regulation potential error compensation method proposed in this paper effectively eliminates the adverse impacts of fitting and prediction errors, and thus significantly enhances the accuracy of forecasting and uncertainty modeling.
(2) The mixed SGED model can effectively capture the peak, waist and tail characteristics of the error distribution, and performs significantly better than other mixed models.In particular, the proposed mixed distribution model parameter estimation method can quickly converge to the optimal value with good adaptability.
(3) Based on the SGED model and the wind speed segmentation error modeling, the uncertainty interval of wind power frequency regulation potential is appropriate, which is of great significance for providing more reliable auxiliary information for the coordinated control and system scheduling of multi-wind turbine systems.
Abbreviations
MPPT: Maximum Power Point Tracking; SGED: Mixed Skew Generalized Error Distribution;PCS: Proportional Curtailment Strategy; GED: Generalized Error Distribution;MLE: Maximum Likelihood Estimation; ECM: Expectation Conditional Maximization; MCMC: Markov chain Monte Carlo; LM: Levenberg-Marquardt; GA:Genetic Algorithm
Acknowledgements
Not applicable.
Authors’ contributions
The authors contributed equally to the development of this research.All authors read and approved the final manuscript.
Authors’ information
Cheng Yan (1997-), male,Major in renewable energy systems.
Yi Tang (1977-), male,PHD and Professor at Southeast University, Major in smart grid, power system security, power system stability analysis, renewable energy systems, and cyber-physical system.
Jianfeng Dai(1985-), male, PHD, Major in new energy power system stability analysis and control.
Chenggen Wang (1981-), male,PHD, research direction is emergency control of power system security and stability.
Shengjun Wu (1988-), male, PHD, research direction is new energy power generation and energy storage application.
Funding
This research was supported by Science and Technology Project of State Grid Corporation of China (State Grid Jiangsu Electric Power Research Institute Power Coordinated Control Technology Research Service for Energy Storage and New Energy Power Stations in the Black Start Process, Contract Number: SGJSDK00XTJS2000357).
Availability of data and materials
Not applicable.
Declarations
Ethics approval and consent to participate
This article does not contain any studies with human or animal subjects performed by author.
Competing interests
The authors declare they have no competing interests.
 Protection and Control of Modern Power Systems2021年0期
- Protection and Control of Modern Power Systems的其它文章
- A comprehensive review of DC fault protection methods in HVDC transmission systems
- Application of a simplified Grey Wolf optimization technique for adaptive fuzzy PID controller design for frequency regulation of a distributed power generation system
- A critical review of the integration of renewable energy sources with various technologies
- Operational optimization of a building-level integrated energy system considering additional potential benefits of energy storage
- An integrated multi-energy flow calculation method for electricity-gas-thermal integrated energy systems
- Sliding mode controller design for frequency regulation in an interconnected power system
