Diel vertical migration of mesozooplankton in the northern Yellow Sea*
Ruping GE , Hongju CHEN ,**, Guangxing LIU , Yanzhong ZHU , Qiang JIANG
1 Key Laboratory of Marine Environment and Ecology, Ministry of Education, Ocean University of China, Qingdao 266100,China
2 Marine Ecology and Environmental Science Laboratory, Pilot National Laboratory for Marine Science and Technology,Qingdao 266200, China
3 National Joint Research Center for Yangtze River Conservation, Chinese Research Academy of Environmental Sciences, Beijing 100012, China
Abstract The Yellow Sea Cold Water Mass (YSCWM), one of the most vital hydrological features of the Yellow Sea, causes a seasonal thermocline from spring to autumn. The diel vertical migration (DVM) of zooplankton is crucial to structural pelagic communities and food webs, and its patterns can be aff ected by thermocline depth and strength. Hence, we investigated zooplankton community succession and seasonal changes in zooplankton DVM at a fixed station in the YSCWM. Annual zooplankton community succession was aff ected by the forming and fading of the YSCWM. A total of 37 mesozooplankton taxa were recorded.The highest and lowest species numbers in autumn and spring were detected. The highest and lowest total densities were observed in autumn (14 464.1 inds./m 3) and winter (3 115.4 inds./m 3), respectively. The DVM of the dominant species showed obvious seasonal variations. When the YSCWM was weak in spring and autumn, most species (e.g. Paracalanus parvus, Oithona similis, and Acartia bifilosa) stayed above the thermocline and vertically migrated into the upper layer. Calanus sinicus and Aidanosagitta crassa crossed the thermocline and vertically migrated. No species migrated through the stratification in summer, and all of the species were limited above ( P. parvus and A. crassa) or below ( C. sinicus and Centropages abdominalis)the thermocline. The YSCWM disappeared in winter, and zooplankton species were found throughout the water column. Thus, the existence of thermocline influenced the migration patterns of zooplankton. Cluster analyses showed that the existence of YSCWM resulted in significant diff erences between zooplankton communities above and below the thermocline.
Keyword: mesozooplankton; diel vertical migration; Yellow Sea Cold Water Mass; North Yellow Sea;thermocline
1 INTRODUCTION
The Yellow Sea (YS) is a semi-enclosed marginal sea of the Western North Pacific. Its water exhibits obvious seasonal variations because ofits shallow depth (average of 44 m) and the influence of monsoon(Wei et al., 2016). One of the most vital hydrological features of the YS is the Yellow Sea Cold Water Mass(YSCWM; Zhang et al., 2008; Liu et al., 2012). In winter, the strong northerly wind caused vigorous vertical mixing, and the water column becomes almost vertically uniform (Oh et al., 2013). The surface water has higher temperature than the water below it during spring and summer due to surface heating. In addition, the temperature gradient of water becomes greater in spring through summer, and the strong temperature gradient prevents heat transfer from the surface to the deep; thus, the water below the seasonal thermocline remains cold (Park et al., 2011).Surface cooling during late autumn induces the thickening of the surface mixed layer and consequently the deepening and weakening of the thermocline.Eventually the water column becomes uniform again during winter (Oh et al., 2013). The presence of the YSCWM results in the obvious stratified structures of chemical, biological, and hydrological factors (Wei et al., 2010).
The diel vertical migration (DVM) of a wide range of marine organisms/diverse animal phyla is commonly found in marine pelagic ecosystems(Enright and Honegger, 1977; Hays, 2003; Aumont et al., 2018). Zooplankton DVM is important to marine ecosystem function and carbon cycling (Berge et al.,2009) and integral to the structuring of pelagic communities and food webs (Hays, 2003). The most common pattern is that zooplankton resides in a foodrich surface or near-surface waters at night and at deeper depths during the day (Heywood, 1996; Fortier et al., 2001; Carr et al., 2008). Many physical and biological factors, such as UV light damage avoidance(Williamson et al., 2011), feeding (Palomares-García et al., 2013), and predation avoidance (Sakınan and Gücü, 2016), likely influence the DVM behavior of zooplankton. Other important factors influencing DVM are the thermocline depth and strength(Bergström and Strömberg, 1997; Li et al., 2004;Júnior et al., 2014). The thermocline acts like a barrier that limits the zooplankton migration. When a thermocline is present, a distinct vertical separation of zooplankton species could be observed; thermophilic species remain in the surface, and cryophilic taxa are concentrated below the thermocline layer (Miloslavić et al., 2015).
Many studies about vertical distribution and migration of zooplankton have been conducted in the YSCWM. Previous studies showed that the seasonal eff ects of the YSCWM on the vertical distributions ofCalanussinicusvaried significantly between spring and summer, andC.sinicusshrank its distribution area to the central cold (≤10 ℃) bottom water in summer (Wang et al., 2003b; Kang and Kim, 2008).However, previous studies about zooplankton generally focused on one species or one season in the YS. With the formation and gradual disappearance of the YSCWM, its influence on the annual DVM patterns of zooplankton remains unclear. Hence,studying the annual distribution patterns of zooplankton in the YSCWM is crucial.
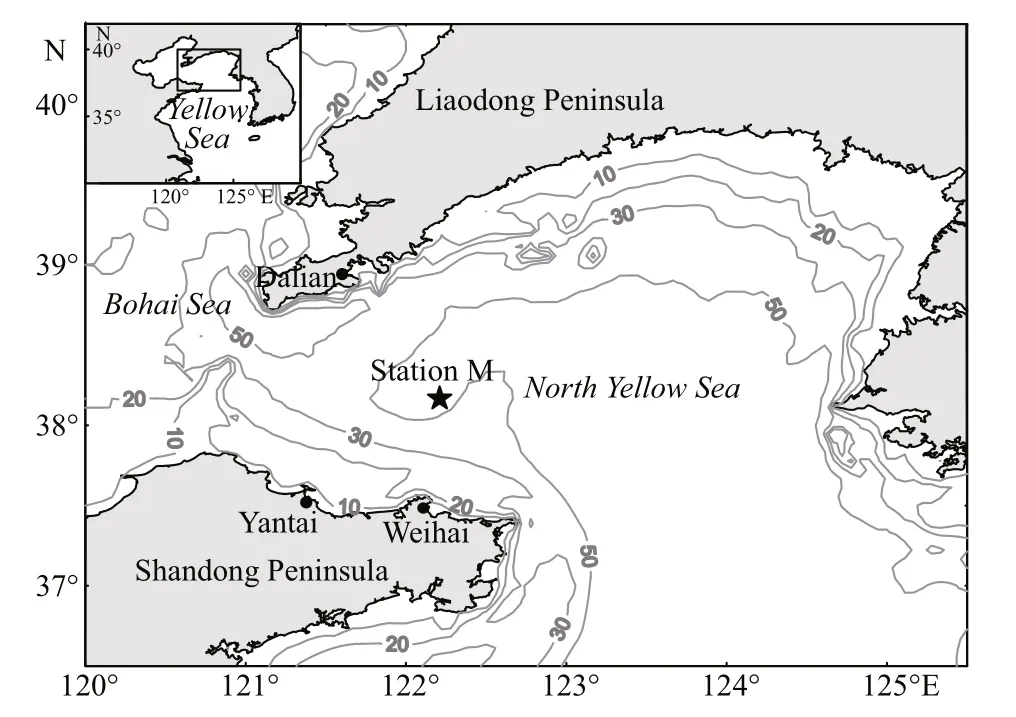
Fig.1 Map of the study area and sampling stations in the North Yellow Sea, with isobaths of 10, 20, 30 and 50 m
This study aimed to describe the seasonal vertical distribution patterns of zooplankton along the YSCWM of the YS. Our study examined (1) annual zooplankton community succession with the formation and fading of the YSCWM (2) and the influence of the seasonal thermocline on diel changes in the vertical distribution of numerically dominant zooplankton.
2 MATERIAL AND METHOD
2.1 Sampling procedure and sample analysis
Four research cruises were carried out on board the R/VDongfanghong2at a fixed station M (38°06′56″N,122°12′26″E, bottom depth ca 54 m) in the northern Yellow Sea on July 27-28, 2006 (summer), January 13-14, 2007 (winter), May 2-3, 2007 (spring), and October 22-23, 2007 (autumn; Fig.1). Zooplankton samples were collected with a vertical opening and closing net (Juday type, mouth diameter 0.5 m, mesh 169 μm) from four strata (0-10, 10-20, 20-30, and 30-50 m) at a speed of 0.5-1.0 m/s. Sampling was performed nine times at 3-h intervals over a 24-h period in each cruise. A total of 144 samples were obtained, 36 samples in each cruise. The net was equipped with a calibrated flowmeter (Hydrobios) at the mouth to measure the volume of water filtered.The average volume filtered per tow was 2.5±0.9 m3.Zooplankton samples were preserved in 5%neutralized formalin-seawater solution immediately after each towing.
In laboratory, all zooplankton taxa were identified to species level if possible, and counted under a stereo microscope (Leica S8APO). All the stages of each species were not separated. The number of zooplankton was determined by counting the 1/4 to 1/256 fractions of the preserved amount. For this purpose, a subsample was obtained from each sample with a Folsom plankton splitter. Subsample volume was determined on the basis of the density of organisms in the original sample, including at least 200 adult individuals (Albaina and Irigoien, 2007).
2.2 Environmental background sampling
The northern YSCWM is mainly distributed in the areas of 121.3°E-124.0°E/37.0°N-38.9°N, and the lowest temperature center is located at 122.4°E/38.2°N.The northern YSCWM shows significant seasonal diff erences (Li et al., 2013). The vertical profiles of water temperature, salinity, and density were recorded with a CTD system (Sea-Bird, SBE9). Synchronous phytoplankton samples were concomitantly collected with a vertical opening and closing net (Juday type,mouth diameter 0.37 m, mesh 77 μm) at the same strata and time intervals, and preserved with 1%Lugol’s iodine solution for the analysis of phytoplankton standing crop. Phytoplankton was concentrated and enumerated under a light microscope(Nikon YS100) with a counting chamber, and these data have been published (Liu and Du, 2009; Yang and Liu, 2009).
2.3 Data analysis
According to filtered water volume, which was determined with a calibrated flowmeter, zooplankton densities were standardized to number per m3. The weighted mean depth (WMD) of the mesozooplankton was calculated using the following equation:WMD=(∑ni×di)/∑ni(Andersen and Sardou, 1992),whereniis density (inds./m3) at depthdi, anddiis the midpoint of each stratum.
Multivariate analyses were conducted using the software Plymouth Routines In Multivariate Ecological Research (PRIMER V6.0). Zooplankton densities were log(x+1) transformed and then used in building a similarity matrix between sampling layers based on the Bray-Curtis coeffi cient of similarity(Field et al., 1982). The interrelations between stations were clustered based on the average linkage group classification (Field et al., 1982). Analysis of similarity(ANOSIM) was used to test diff erences between the resultant groups. In pairwise comparisons, anRstatistic value close to 1 indicates considerable diff erence. The RELATE procedure was used in analyzing the correlation between zooplankton density and environmental factors. The BIO-ENV procedure was used in identifying which environmental factors (temperature, salinity, and phytoplankton density) best explained the zooplankton community structure. This process evaluated Spearman correlation coeffi cients (ρ) between the zooplankton Bray-Curtis similarity matrix and the Euclidean distance similarity matrices of environmental factors.
One-way ANOVA (analysis of variance) was conducted for the comparison of total zooplankton densities in diff erent seasons. SPSS 25.0 was used. In case of significant diff erences (P<0.05), pairwise comparisons using the t-test were performed after the application of Bonferroni correction (Zar, 2010).Before ANOVA was used, a Kolmogorov-Smirnov(K-S) test was used to test the normality of zooplankton density. Microsoft Excel 2016 and Origin 9.2 were used in creating plots.
3 RESULT
3.1 Environmental factor
At the fixed station, no significant diel variation in sea temperature and salinity in the water profiles were detected. However, sea temperature and salinity showed significant variations throughout the year. In spring, the YSCWM formed. A thermocline of 4.5 °C diff erence formed between 20 and 29 m. In the vertical profile, temperature varied from 5.5 °C to 10.1 °C,and salinity ranged from 32.0 to 32.3 (Fig.2a). The strongest thermocline (14 °C) was detected between 14 and 32 m in summer, and temperature and salinity varied from 5.8 °C to 20.9 °C and from 30.5 to 31.9,respectively (Fig.2b). In autumn, the YSCWM still existed, and the thermocline of the stationary site was located between 34 and 44 m with a diff erence of 7 °C. Temperature and salinity ranged from 10.6 °C to 18.0 °C and from 31.3 to 32.1, respectively (Fig.2c).In winter, the water was well mixed vertically, and the thermocline disappeared (7.0 °C and 32.0; Fig.2d).
3.2 Species composition and community structure
A total of 37 mesozooplankton taxa were recorded in four seasons. Species number varied significantly among seasons, and 15, 22, 31, and 18 taxa were recorded in spring, summer, autumn, and winter,respectively (Table 1). Most of the species belonged to temperate eurythermal low-saline species.Copepods were the most dominant component, and 13 species were recorded in four seasons.C.sinicus,Paracalanusparvus,Centropagesabdominalis,Acartiabifilosa,Oithonasimilis, andDitrichocorycaeusaffi niswere the dominant species in diff erent seasons (Table 1).O.similiswas the most dominant species in spring and summer (3 434.7 and 5 363.4 inds./m3, respectively), whereasP.parvuswas the most dominant species in autumn and winter(2 285.4 and 1 313.3 inds./m3, respectively). Except the copepods,Oikopleuradioica,O.longicaudaandDoliolumdenticulatumwere the dominant species in autumn.
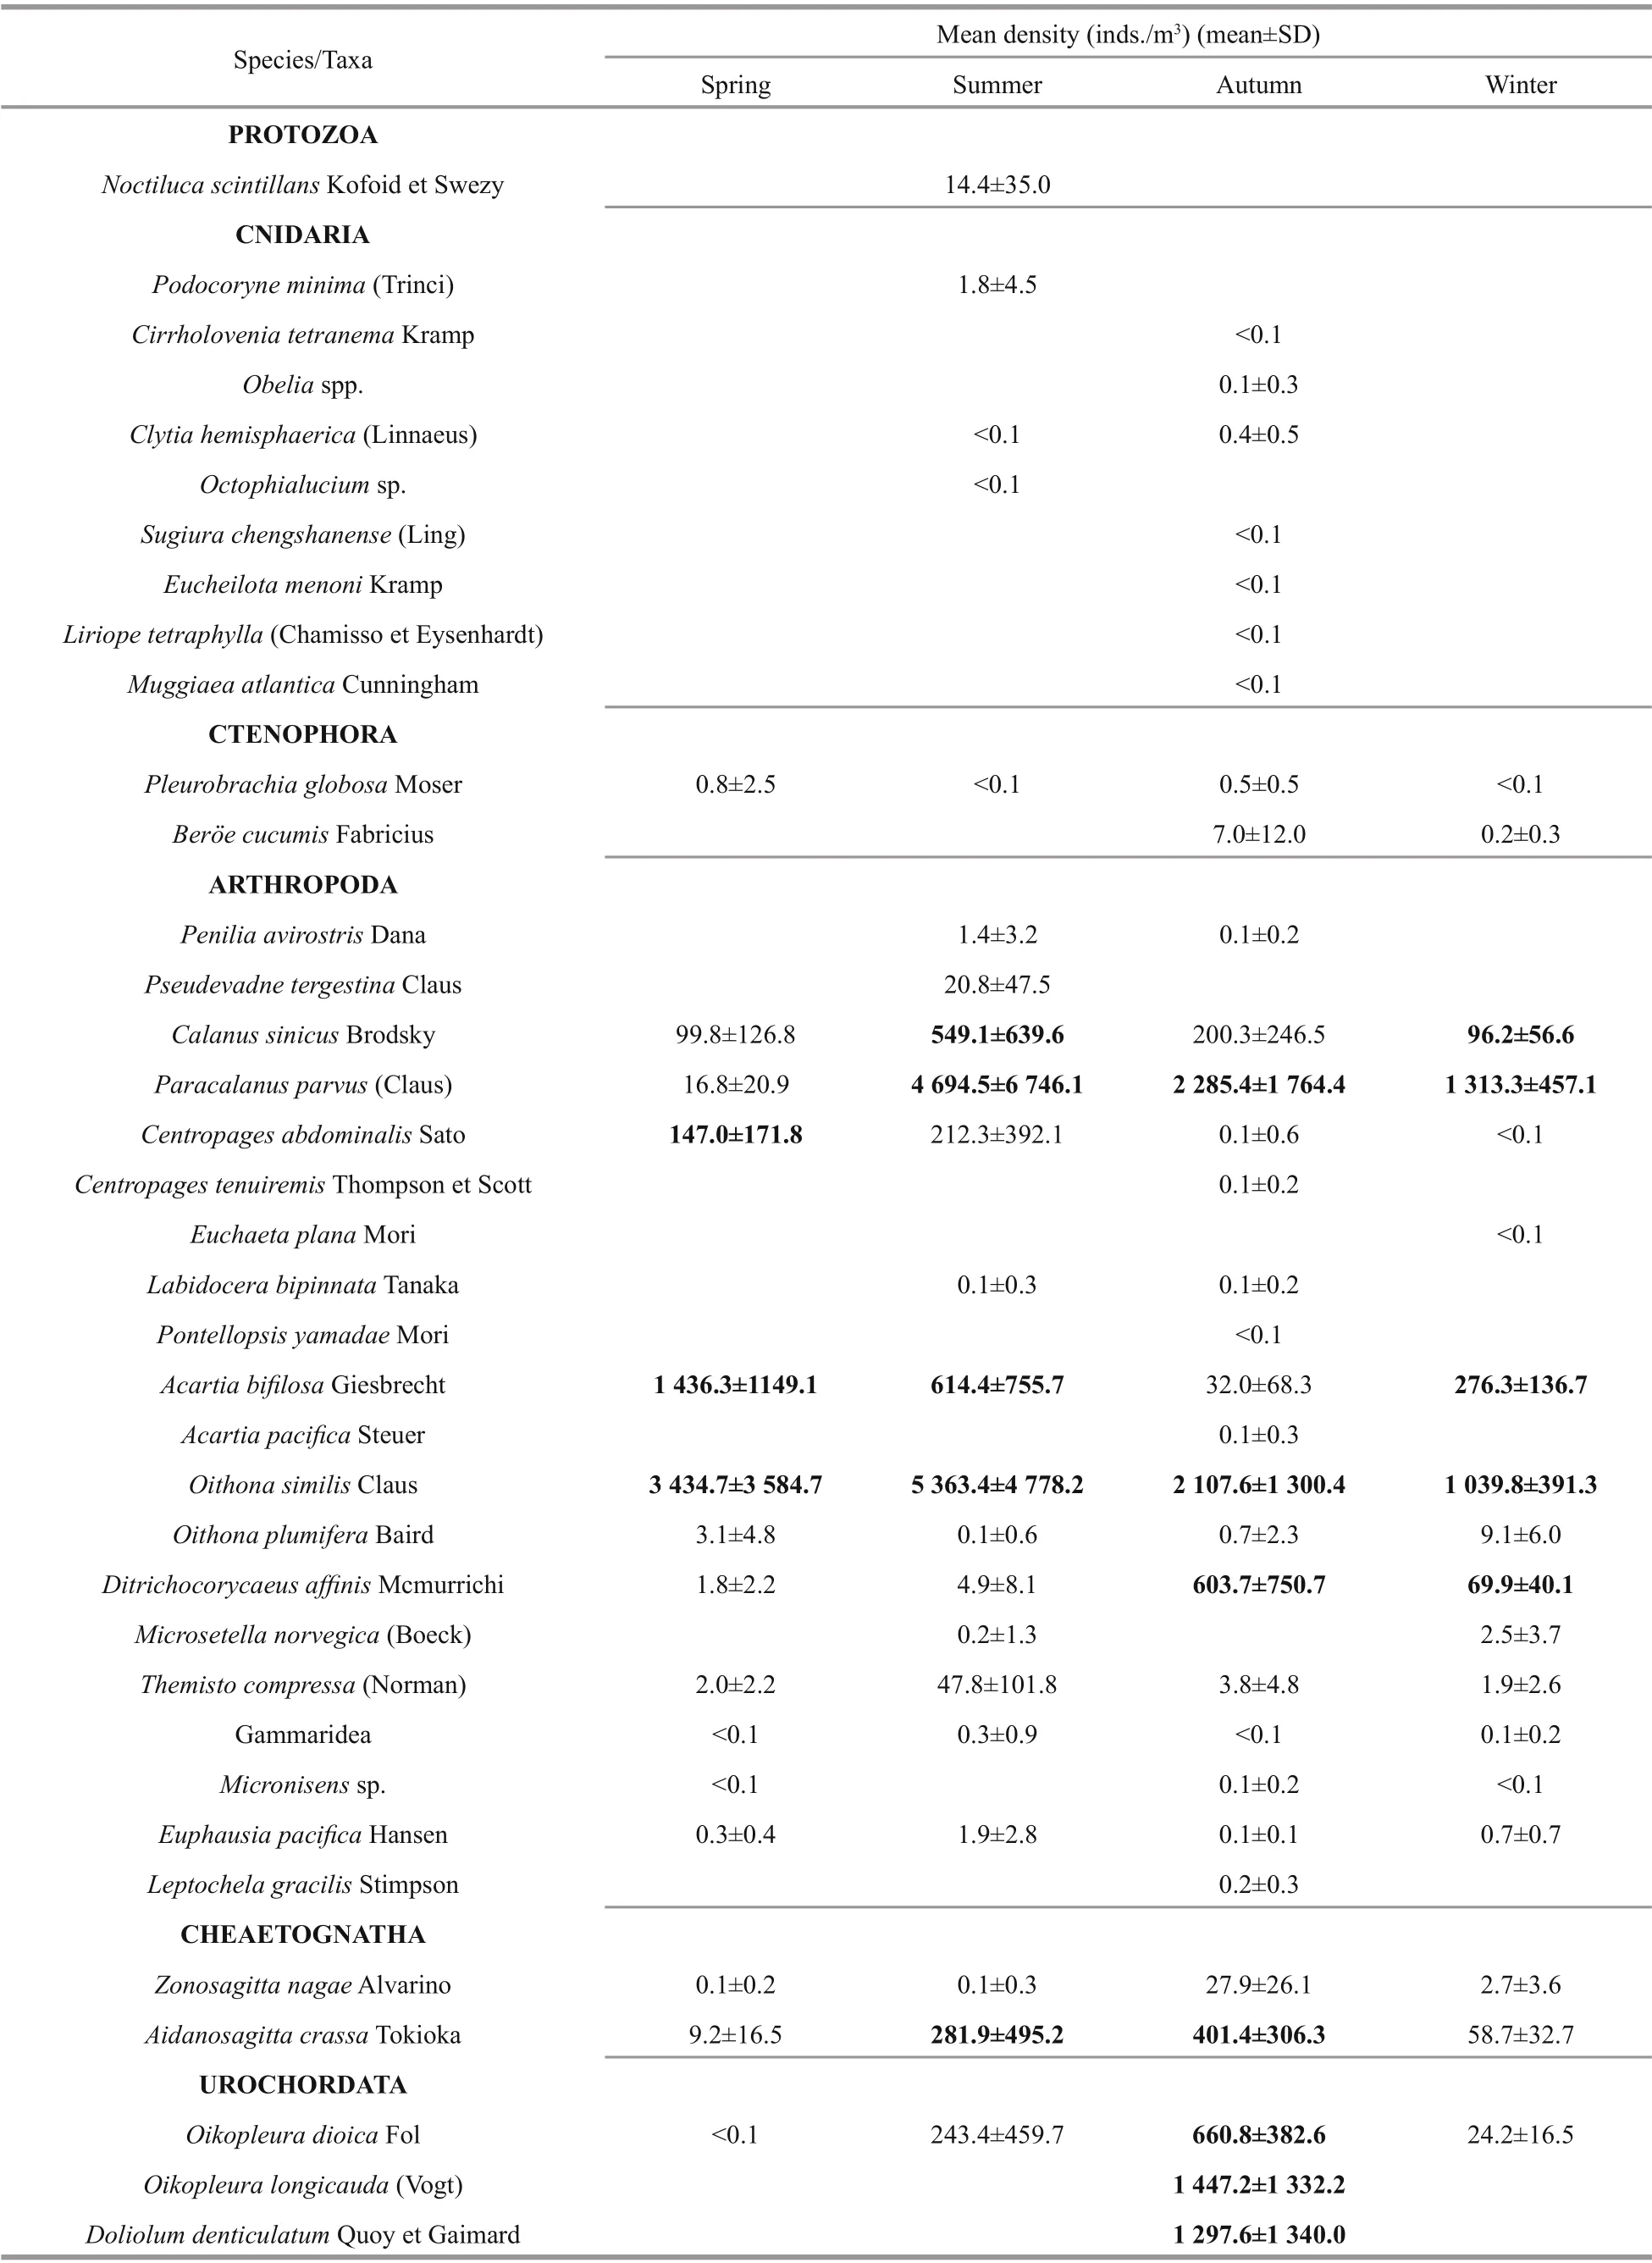
Table 1 Zooplankton species/taxa recorded at the fixed station in four seasons
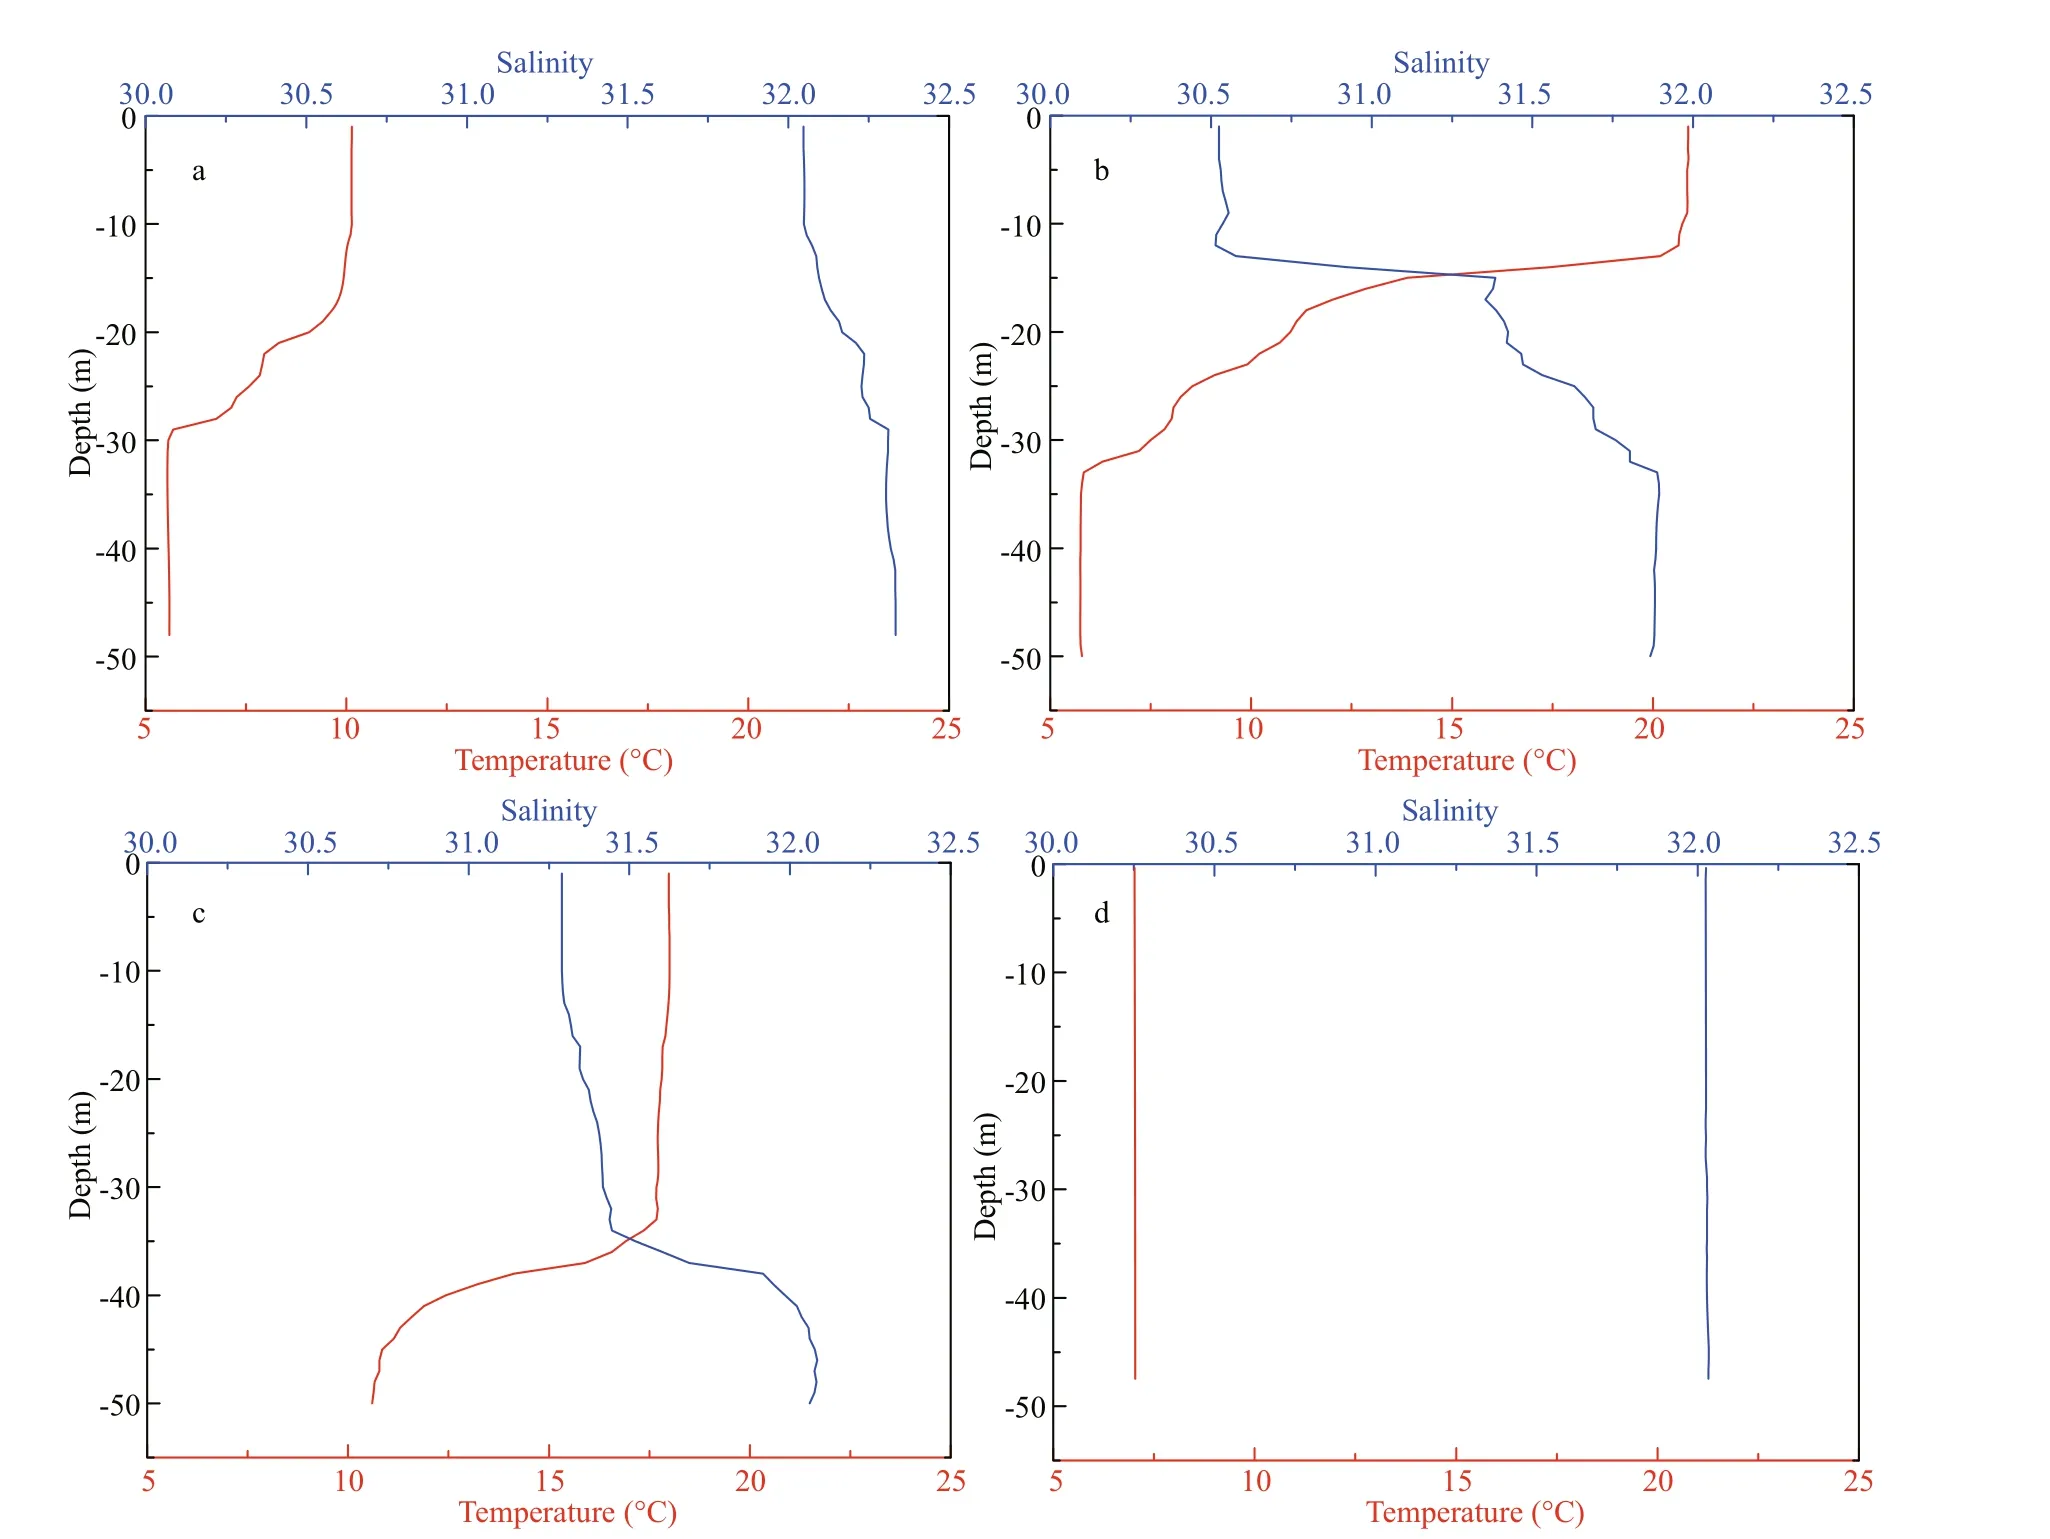
Fig.2 Vertical profiles of temperature (red lines) and salinity (blue lines) at the sampled station
Cluster analyses indicated that zooplankton communities showed vertical diff erences and seasonal variations (Fig.3). In spring and autumn, zooplankton assemblages in the deep layers (SP I and AU I) was significantly diff erent with the zooplankton in the upper layers (SP II and AU II). Zooplankton assemblages in summer showed obvious diff erent between 0-20-m layer (SU I) and layers below 20 m(SU II). Conversely, zooplankton communities in diff erent layers showed a high similarity (>86%) in winter. In addition, zooplankton assemblages belowthe 20-m depth in summer (SU II) showed high similarity with zooplankton community in winter(WI). ANOSIM results showed that zooplankton communities diff ered significantly (P<0.001) between two diff erent groups in spring (SP I and SP II), summer(SU I and SU II) and autumn (AU I and AU II)(Table 2). Zooplankton communities showed obvious diff erences (P<0.001) between SU II and WI.
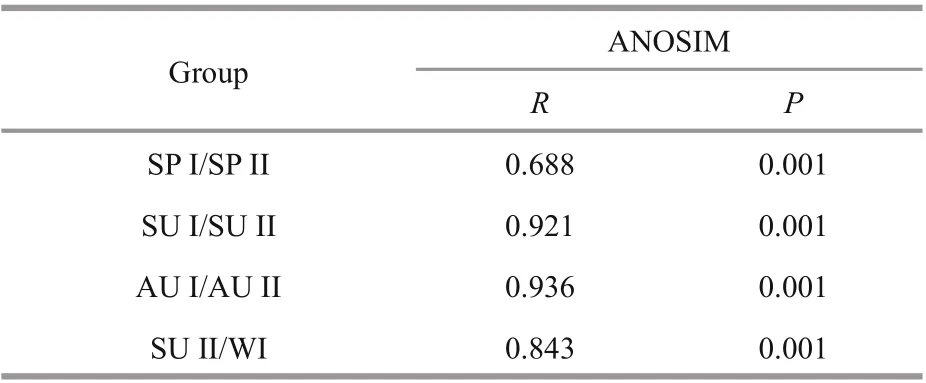
Table 2 Comparison of the zooplankton community structures between diff erent groups in four seasons according to ANOSIM analysis ( R value and significance level)
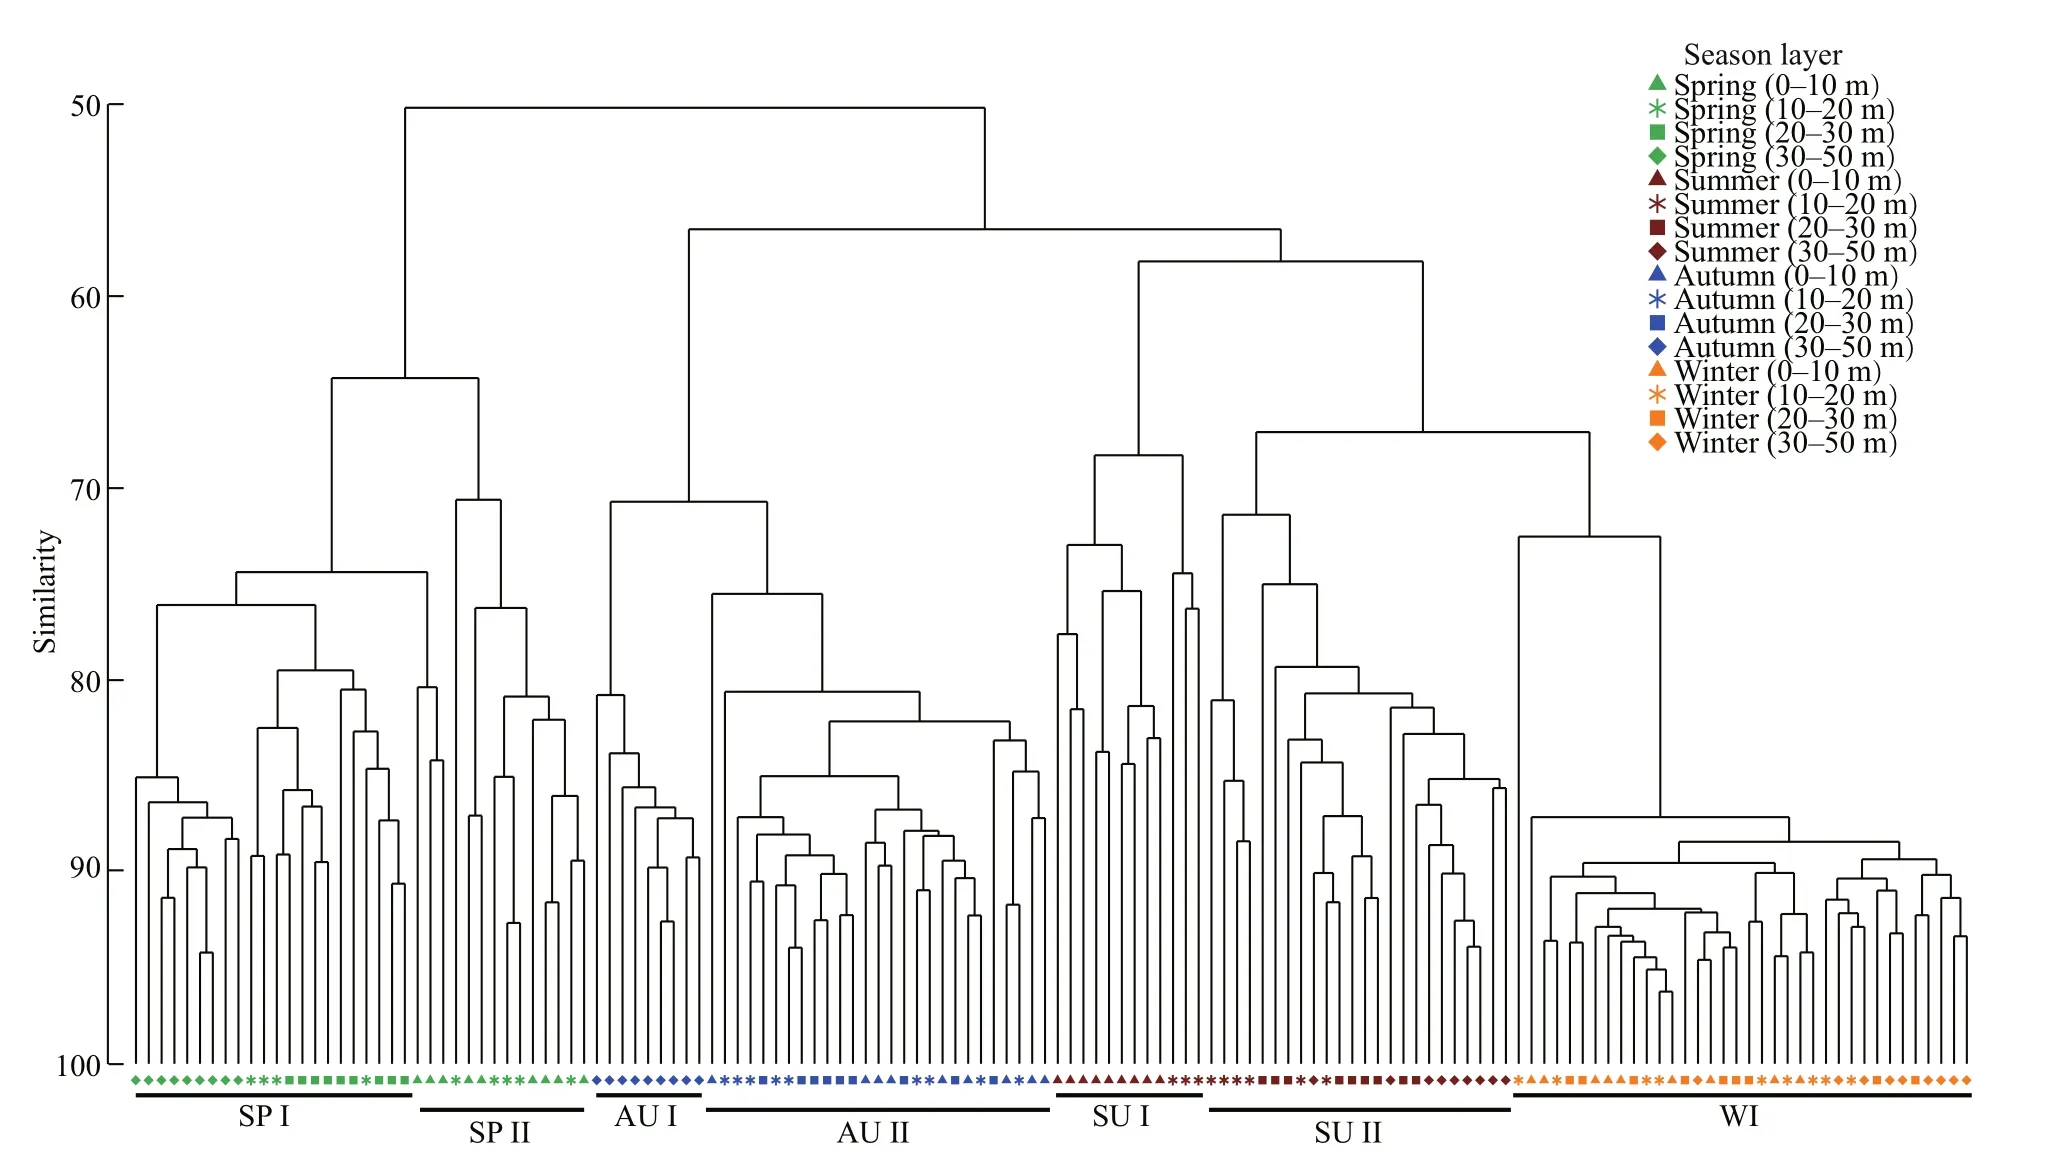
Fig.3 Cluster analyses of zooplankton between diff erent water layers in four seasons

Table 3 Correlations between zooplankton abundance and environmental factors in the four seasons according to BIOENV(Spearman correlation coeffi cient) and RELATE ( R value and significance level)
RELATE analyses showed that zooplankton community structure had significant correlation(P<0.001) with environmental factors in spring,summer, and autumn, whereas zooplankton community structure in winter did not present significant correlation (P=0.071) with environmental factors (Table 3). BIOENV showed that temperature had the highest correlation with zooplankton community structure, and phytoplankton density had the lowest.
3.3 Diel vertical distribution and migration
3.3.1 Vertical distribution of the total density
The next day, she received news that he had passed away. She rushed down to his apartment, saw his body, lying on the couch12 still holding on to the phone. He had a heart attack when he was still trying to get thru her phone line.
The vertical distribution of phytoplankton density showed significant seasonal variations (Fig.4). In spring, summer, and autumn, the phytoplankton density of 30-m bottom layer was higher than that in the 0-10-, 10-20-, and 20-30-m layers. Phytoplankton density was similar in whole water column in winter.
Seasonal variations in the total zooplankton density were significant (one-way ANOVA,P<0.001). The mean zooplankton density in spring was 6 330.6 inds./m3, and the values in summer, autumn, and winter were 12 807.4, 14 464.1, and 3 115.4 inds./m3,respectively. The zooplankton density significantly diff ered between diff erent strata in all the seasons(one-way ANOVA,P<0.001) except for winter(P=0.946).
In spring, the highest zooplankton density was observed in the 0-10-m stratum (10 079.3 inds./m3).The density declined sharply to 7 658.0, 5 516.1, and 2 264.0 inds./m3in the 10-20-m, 20-30-m, and 30-mbottom layers, respectively (Fig.4). The average density of the whole water column showed a distinct diel variation; that is, the maximum density was observed in the evening (7 874.0 inds./m3, 21:00), and the minimum density was detected at noon(4 409.5 inds./m3, 12:00). In the 0-10-m stratum, the maximum density was recorded in the evening(17 588.5 inds./m3, 21:00), and the minimum density was observed in the morning (3 419.2 inds./m3, 9:00-12:00). The maximum density in the 10-20-m layer was documented in the morning (12 536.0 inds./m3,6:00), and the minimum density was observed at noon(2 744.2 inds./m3, 12:00). In the 20-30-m layer, the maximum and minimum densities were detected in the morning (7 873.9 inds./m3, 9:00) and evening(3 049.5 inds./m3, 21:00), respectively. In the 30-mbottom layer, the maximum density was recorded at noon (4 726.8 inds./m3, 12:00), and the minimum density was detected in the afternoon (806.2 inds./m3,15:00). The WMDs ranged from 12.7 m to 23.6 m(mean=15.8 m), and an obvious DVM trend was observed. The daytime WMDs (especially in the morning) were 4-m deeper than the nighttime WMDs(Fig.5a).
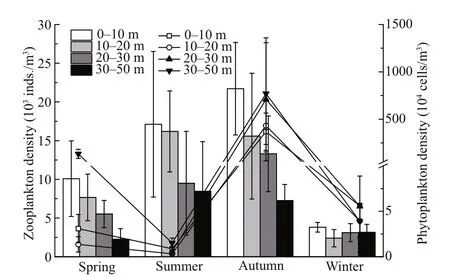
Fig.4 Seasonal variations in the mean density of zooplankton (bars) and net phytoplankton (lines) in diff erent strata
Similar to that in spring, zooplankton density in summer showed a remarkably decreasing trend from the sea surface to the deep, and the values were 17 111.6, 16 190.8, 9 489.5, and 8 437.8 inds./m3in the 0-10-m, 10-20-m, 20-30-m, and 30-m-bottom layers, respectively (Fig.4). The average density of the whole water column showed a distinct diel variation, that is, the maximum density was observed in the morning (18 156.7 inds./m3, 8:30), and the minimum density was recorded in the evening(7 593.2 inds./m3, 22:30). In the 0-10-m layer, the maximum density was documented early in the morning (17 384.3 inds./m3, 2:00), and the minimum density was obtained later in the morning(8 343.6 inds./m3, 11:00). In the 10-20-m layer, the maximum density was observed before noon(24 701.9 inds./m3, 11:00), and the minimum density was recorded in the evening (9 974.8 inds./m3, 22:30).The maximum density of 20-30-m layer was detected in the morning (23 865.2 inds./m3, 8:30), and the minimum density was found at 19:30 (989.2 inds./m3).In the 30-m-bottom layer, the maximum density was observed at 13:50 (21 148.2 inds./m3), and the minimum density was detected at 16:30 (2 560.5 inds./m3). The WMDsranged from 10.0 m to 23.9 m(mean=17.2 m), and the daytime WMDswere 7-m deeper than nighttime WMDs(Fig.5b). Zooplankton presented a downward migration during daytime and moved upward late in the afternoon and at nighttime(Fig.5b).
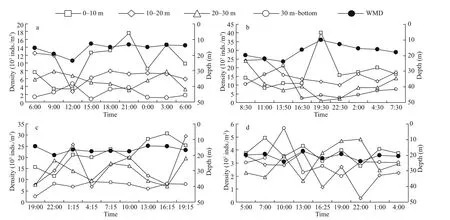
Fig.5 Diel variations in the total mesozooplankton density in diff erent layers and the weighted mean depth (WMD)
The vertical distribution patterns of zooplankton in autumn also showed a significantly decreasing trend from the surface to the bottom, and their values were 21 709.5, 15 581.6, 13 299.3, and 7 266.1 inds./m3in the 0-10-m, 10-20-m, 20-30-m, and 30-m-bottom layers, respectively (Fig.4). In the 0-10-m layer, the maximum density was observed in the afternoon(30 547.6 inds./m3, 16:15), and the minimum density was detected at 22:00 (11 532.7 inds./m3). The maximum density in the 10-20-m layer was recorded after dusk (29 429.5 inds./m3, 19:15), and the minimum density was observed before dawn(6 816.7 inds./m3, 4:15). In the 20-30-m layer, the maximum density was documented at 19:15(19 686.1 inds./m3), and the minimum density was observed in the afternoon (7 014.4 inds./m3, at 16:15).In the 30-m-bottom layer, the maximum density was detected before dawn (9 159.0 inds./m3, 4:15), and the minimum density was recorded at 19:00 (2 430.2 inds./m3). The WMDsranged from 14.3 m to 20.2 m(mean=16.6 m), and no significant DVM trend of the total density was found (Fig.5c).
The distribution of zooplankton showed no obvious gradient in the vertical profile in winter, and the values were 3 811.6, 2 393.2, 3 111.4, and 3 145.2 inds./m3in the 0-10-m, 10-20-m, 20-30-m, and 30-m-bottom layers, respectively (Fig.4). Diel variation in average density in the whole water column was indistinct. The maximum density was recorded at 10:00(3 885.2 inds./m3), and the minimum density was observed at 16:25 (2715.9 inds./m3). In the 0-10-m layer, the maximum density was detected in the morning (4 912.1 inds./m3, 7:00), and the minimum density was found at 22:00 (2 785.6 inds./m3). In the 10-20-m layer, the maximum density was observed at 13:00 (3 839.0 inds./m3), and the minimum density was recorded at 22:00 (306.7 inds./m3). The maximum density of 20-30-m layer was observed at 22:00(4 818.3 inds./m3), and the minimum density was detected at 13:00 (1 632.7 inds./m3). In the 30-m bottom layer, the maximum density was observed at 10:00 (5 662.0 inds./m3), and the minimum density was recorded at 19:00 (1 981.9 inds./m3). The WMDsfluctuated from 17.5 m to 24.1 m (mean=20.7 m)without a significant DVM trend (Fig.5d).
3.3.2 DVM of the dominant species
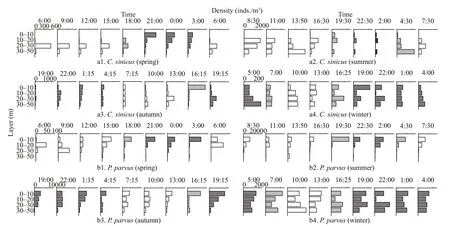
Fig.6 Diel vertical distribution of the zooplankton dominant species
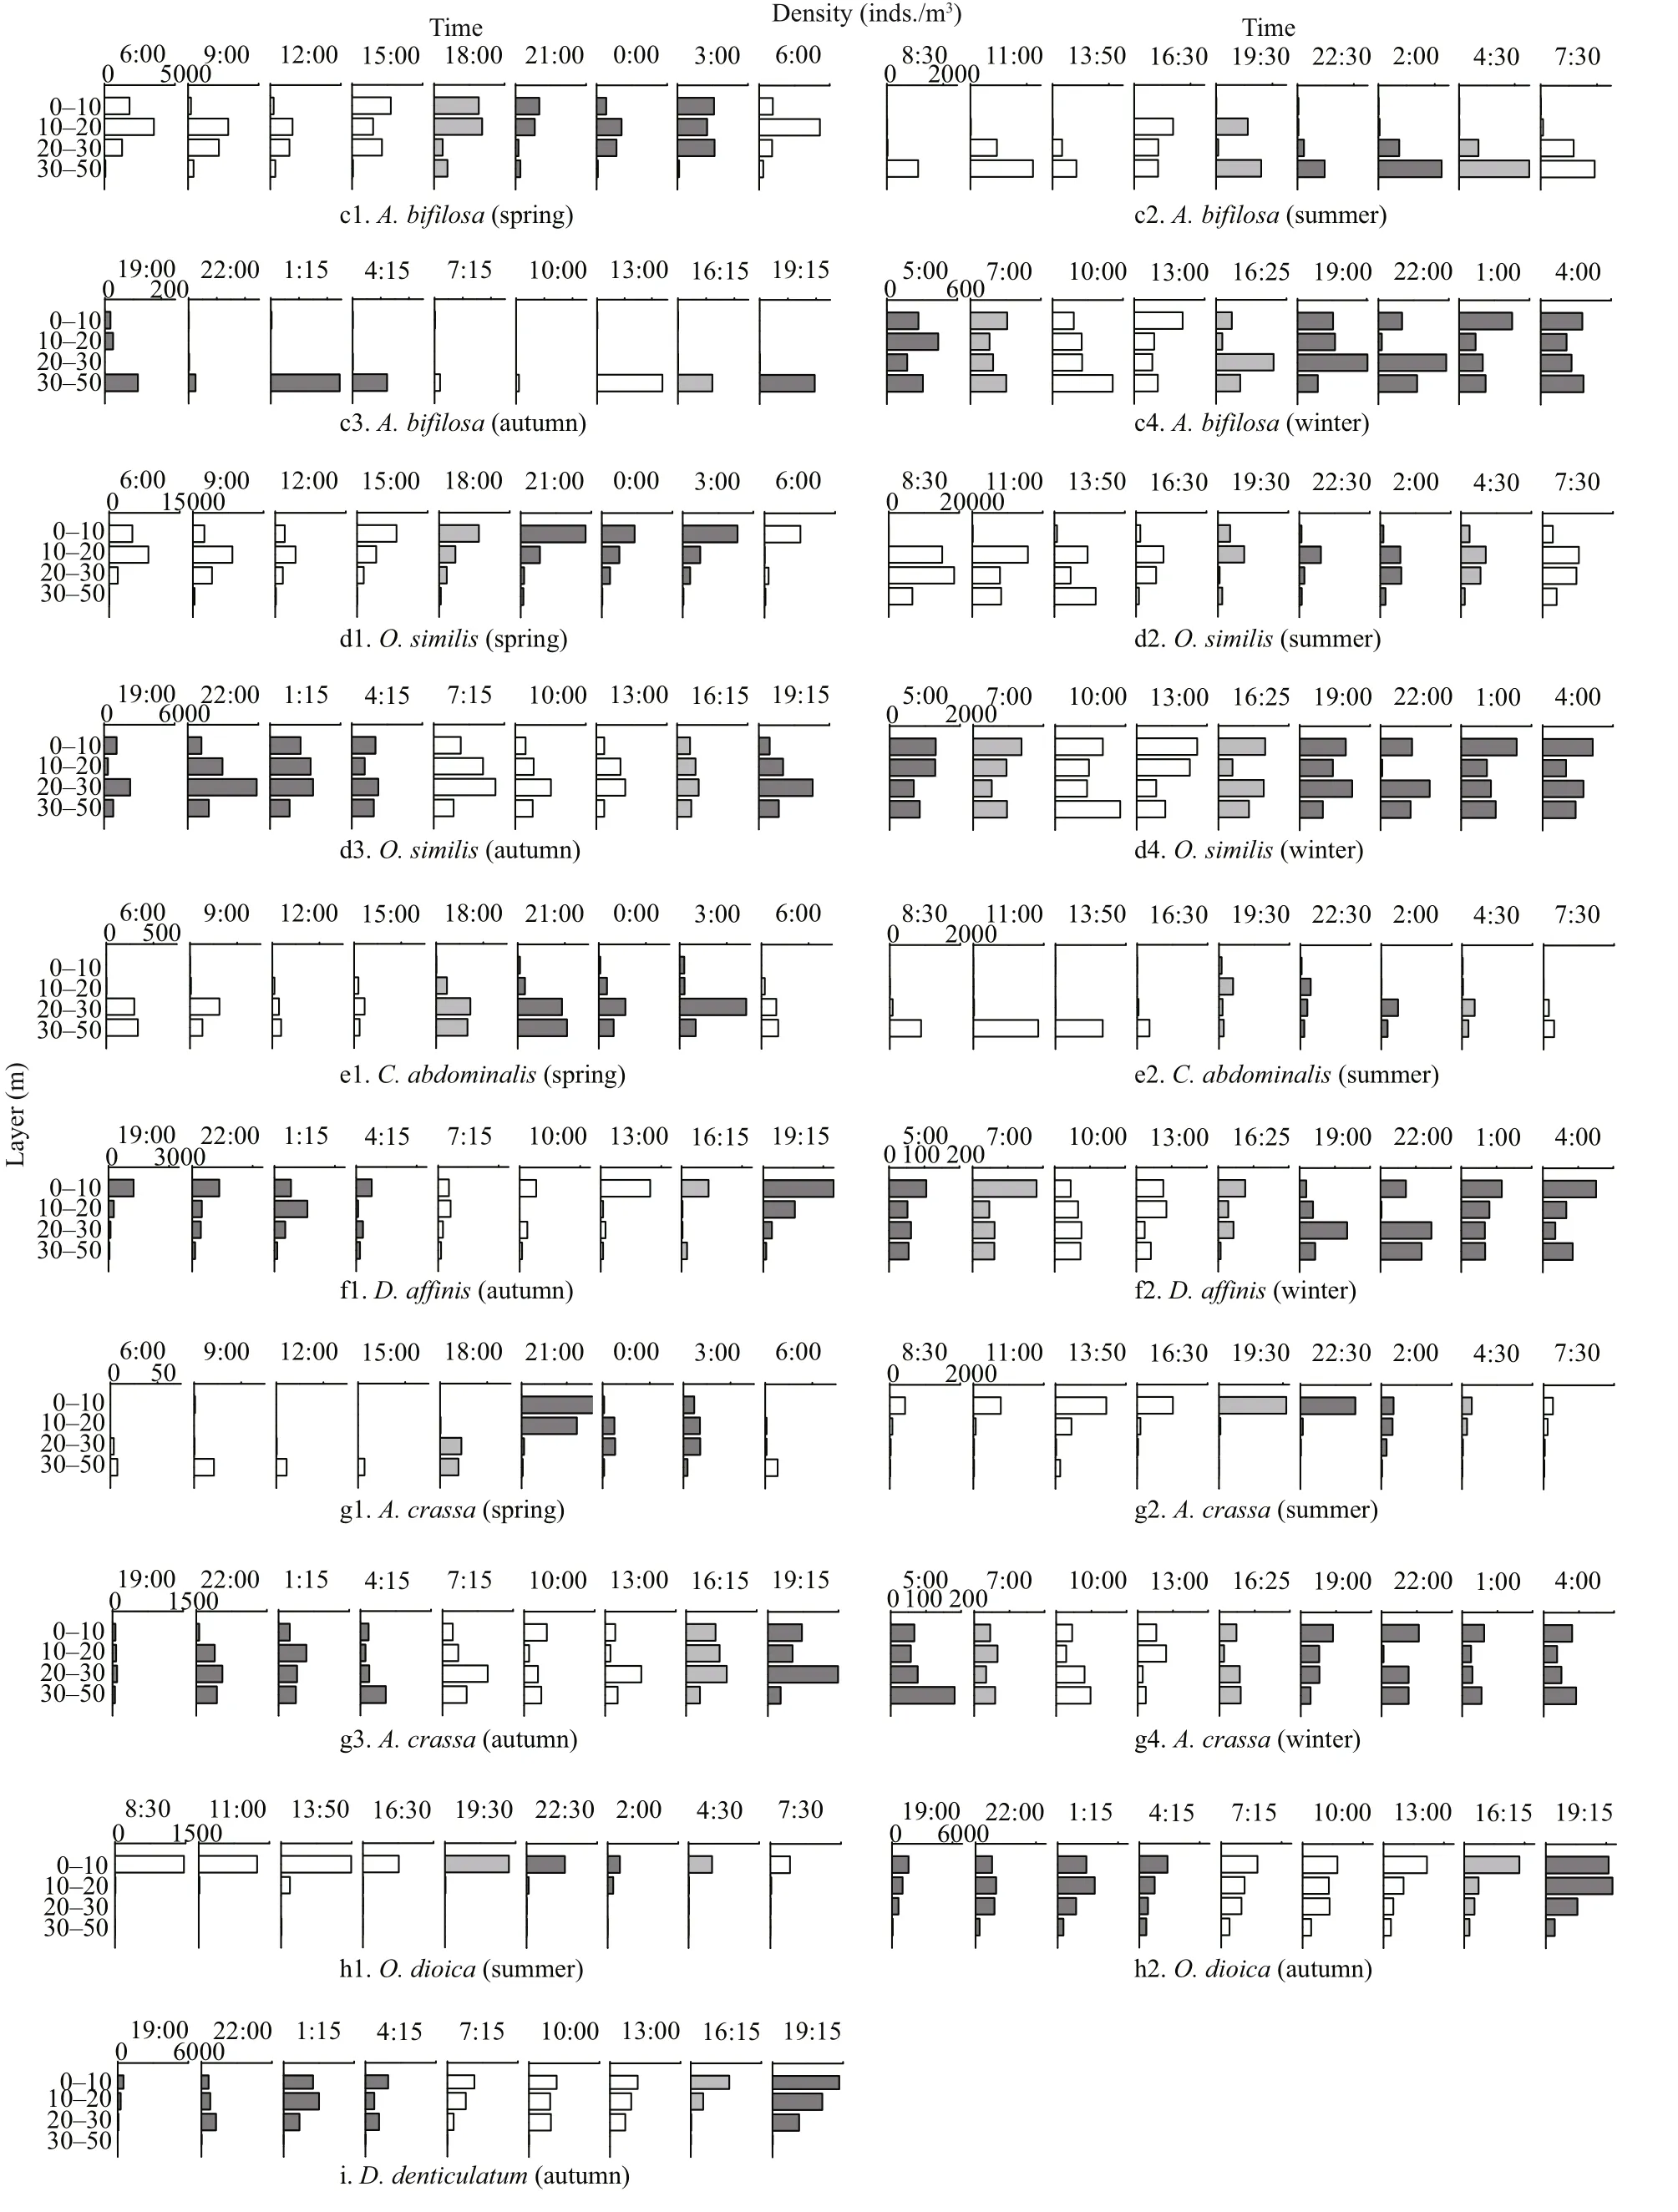
Fig.6 Continued
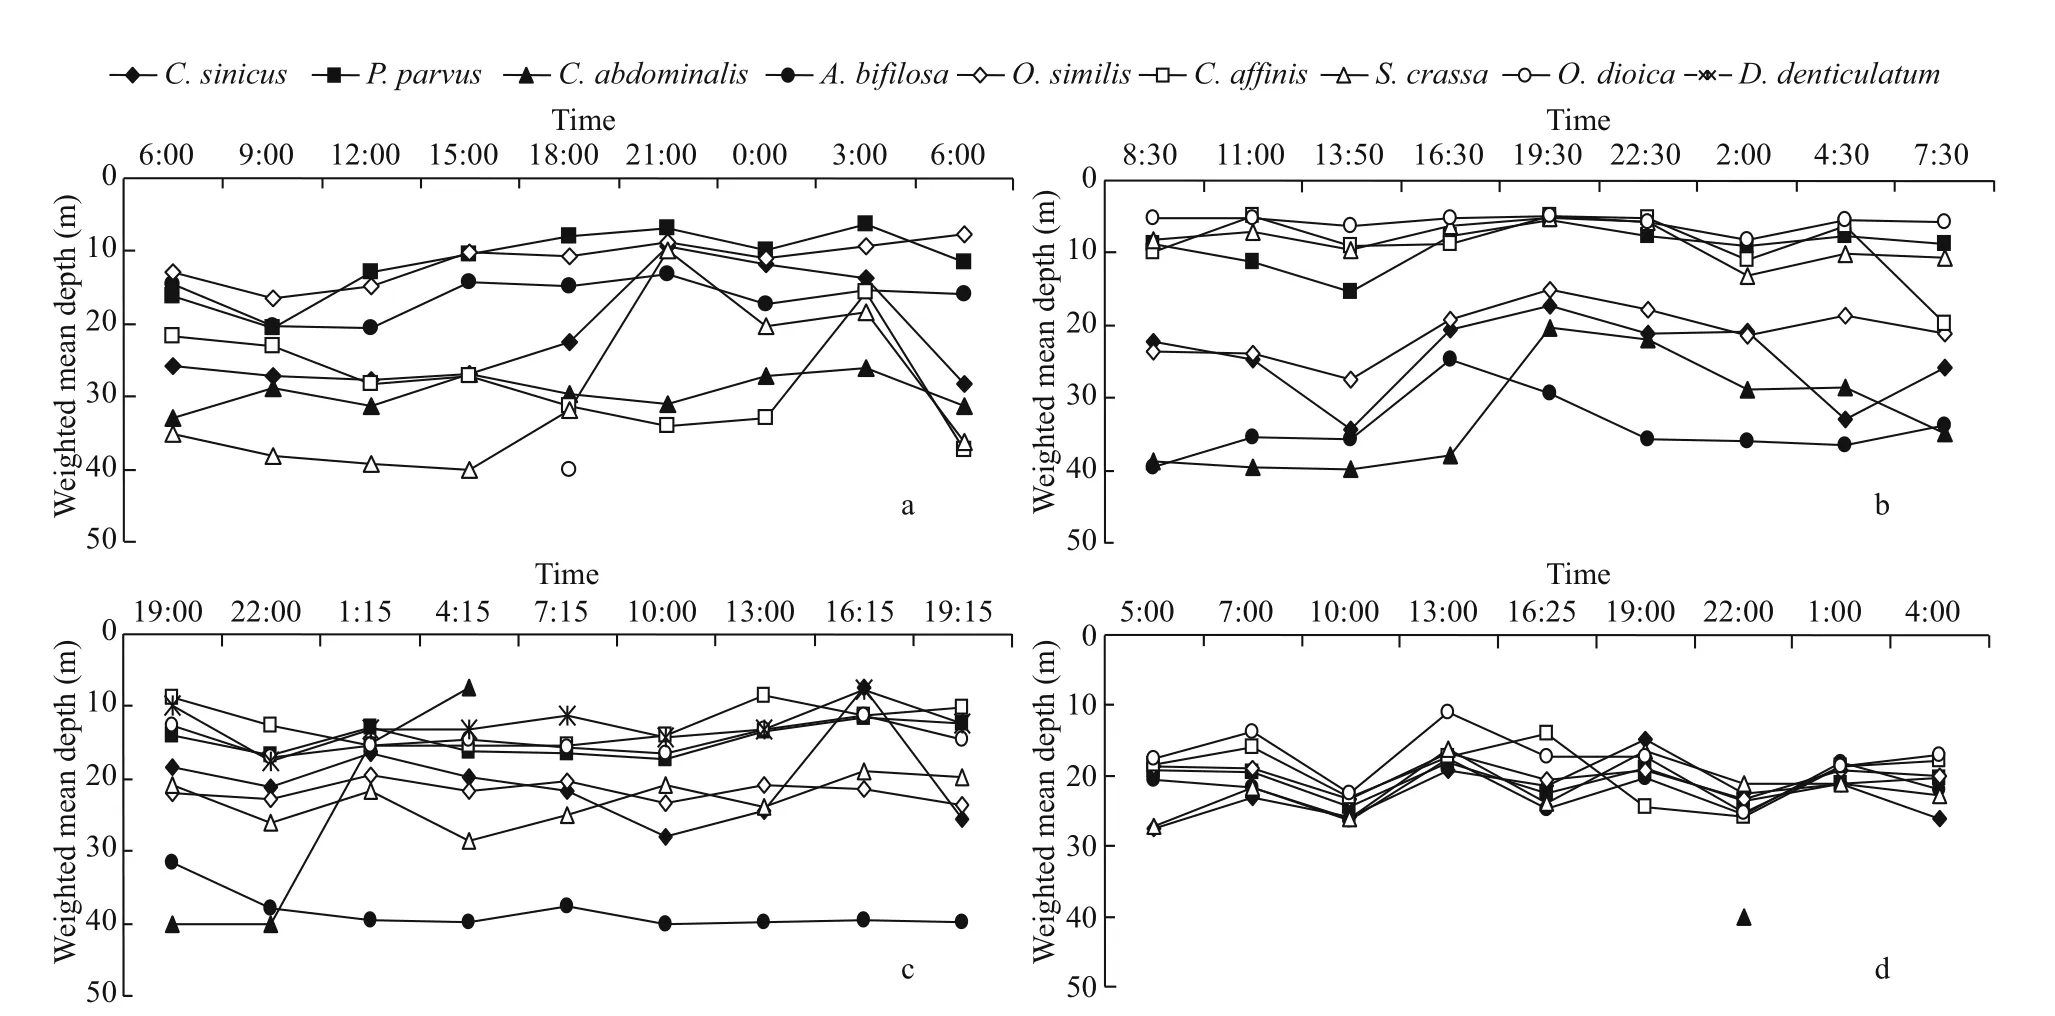
Fig.7 Weighted mean depth (WMD) of dominant species at each sampling time in four seasons
The vertical distributions and diel variations of a single species showed seasonal changes (Figs.6 & 7).Based on vertical distribution and diel variation, four types of vertical migration patterns formed: 1)C.sinicus,P.parvus, andA.crassain spring(Figs.6a1, b1, g1, 7a) andC.abdominalisin summer(Figs.6e2, 7b) showed a remarkable diurnal vertical migration; 2) species that showed no significant vertical migration and were mainly distributed in the upper layers, such asO.similis,P. parvus,O.dioica,andA.crassain summer (Figs.6d2, b2, h1, g2, 7b),andD.denticulatumin autumn (Fig.6i), andD. affi nisin winter (Fig.6f2); 3) species that showed no significant vertical migration and were mainly distributed in the bottom layers, such asC.abdominalisin spring (Fig.6e1) andA.bifilosain autumn (Fig.6c3);and, 4) almost all dominant species in winter showed no significant diurnal vertical variations and were distributed relatively even in the water column(Fig.6a4, b4, c4, d4, f2, g4).
4 DISCUSSION
Species composition and vertical distribution of zooplankton were clearly influenced by the presence of the YSCWM. Previous observations indicated that the species number of zooplankton varies remarkably among seasons because of the transformation of the YSCWM (Yang et al., 2012; Zou et al., 2013; Duan et al., 2016). Our findings agreed with these previous results, and the species number of zooplankton was the highest in autumn. The sea temperature above 30-m depth (especially 15-30 m) in autumn was higher than that in summer (Fig.2b-c), and thus warm water species extended from the northern part of the East China Sea to the YS survived (Wang et al.,2003a). Except temperate eurythermal low-saline species, several warm-water species, such asSugiurachengshanense,Liriopetetraphylla, andDoliolumdenticulatum, have been recorded because of the favorable sea temperature. The species number of zooplankton was low in spring and winter because oflow seawater temperature (Du et al., 2013). Even so,species number in winter was higher than that in spring because the Yellow Sea Warm Current (YSWC)penetrated well in winter (Chen et al., 2020) and transported warm water species (e.g.,Euchaetaplana) into the north YS, thereby increasing the zooplankton number. Generally, the YSWC appeared significant seasonal variability. It is stronger in winter,penetrating well into the YS trough, and becomes weak in summer (Xu et al., 2009).
Zooplankton communities showed significant diff erences between upper layer and deep layer owing to strong vertical stratification (Miloslavić et al.,2015). In this study, zooplankton communities were divided into two diff erent groups, when a thermocline appeared in spring, summer and autumn. However,zooplankton communities showed high similarities in diff erent layers when the thermocline disappeared in winter (Fig.3). In addition, zooplankton assemblages below the thermocline in summer showed high similarity with zooplankton assemblages in winter(Fig.3). Thus, the thermocline in the YS greatly aff ected the zooplankton community structure.
Generally, zooplankton density is greatly associated with phytoplankton in marine systems (Du et al.,2014; Júnior et al., 2014). Their interdependent relations are considered important factors that aff ect vertical distributions of zooplankton (Hays, 2003).Zooplankton density in the South China Sea is higher in the thermocline layer, where phytoplankton is abundant (Du et al., 2014). In a subtropical marine system, the highest value of zooplankton density is consistent with the maximum chlorophyll-alayer(Júnior et al., 2014). However, RELATE analysis showed that phytoplankton density had the lowest correlation with zooplankton community structure in the present study (Table 3). Indeed, phytoplankton density in present study was 10 times that in the South China Sea (103cells/m3; Li et al., 2013). Therefore,due to the high productivity in YS, food was not the restrictive factor that limited zooplankton distribution.A thermocline, in which water temperature and density gradients vary intensely, is considered a barrier that prevents the vertical migration of zooplankton (Cheng et al., 1965; Júnior et al., 2014).Many species, such asP.parvusandO.similis, cannot move vertically through a strong thermocline, thereby influencing the zooplankton DVM (Fig.6).
C.sinicus, a primary dominant species in the YS,mainly spread above 30-m layers when the YSCWM formed in spring (Fig.6a1).C.sinicusshowed a significant DVM, which was consistent with the observation of Kang et al. (2013). During daytime,C.sinicuswas mainly distributed in the 20-30-m layer and migrated to the 0-20-m layer at nighttime(Fig.6a1). The YSCWM was strong in summer, andC.sinicuswas mainly distributed below 10 m. High surface temperature in summer greatly limits the distribution ofC.sinicus, andC.sinicusis concentrated in the YSCWM (Li et al., 2004). The YSCWM was considered an oversummering site forC.sinicus(Pu et al., 2004). Similar toC.sinicus, some cryophilic zooplankton species in other stratified systems are concentrated in cold water below thermoclines and avoid warm surface water (Schnack-Schiel et al.,2010; Miloslavić et al., 2015). Moreover,C.sinicusshowed an obvious diel migration pattern; that is, it mainly stayed in the 30-50-m layer during daytime and migrated to the 10-20-m layer at nighttime(Fig.6a2). In autumn, the YSCWM faded, andC.sinicusmigrated through the weakly stratified layer and occupied all the layers due to strong swimming ability and wide-temperature-range adaptability (Fig.6a3).C.sinicusunderwent diel migration, covered the 20-50-m layer during daytime,and migrated to the surface at nighttime. The thermocline in the YS disappeared completely in winter (Fig.2d) because of surface cooling and strong vertical mixing (He et al., 1959), andC.sinicusspread in the whole water column and did not undergo diel migration (Fig.6a4).
Previous study demonstrated that the thermocline in a subtropical stratified system limited the vertical distribution of zooplankton, which typically resides in epipelagic warm water (Pagès and Gili, 1991). The distribution patterns ofP.parvuswere similar to that those observed by Pagès and Gili (1991).P.parvuswas which mainly spread above the thermocline when the YSCWM appeared (Fig.6b1, b2, b3).P.parvusshowed seasonal DVM patterns in present study. In spring,P.parvusspread in the surface layer at nighttime and migrated to the deeper layers during daytime. Wang et al. (2002) suggested thatP.parvusstops growing at temperature below 5 °C. The temperature at the 30-50-m layer, which was <5.5 °C,may be unsuitable forP.parvusgrowth. Thus,P.parvuswas mainly distributed at 10-30-m layer during the daytime. When the YSCWM was strong in summer,P.parvuswas blocked by the thermocline in the top two layers and its highest density was detected in the 0-10-m stratum (Fig.6b2). The temperature favorable forP.parvusis 13-24 °C (Zhang et al.,2006), and thus the temperature in the 0-10-m layer may be suitable to reside in present study. The YSCWM gradually disappeared in autumn, andP.parvusdid not undergo diel migration and were basically restricted above the 30 m during daytime and at nighttime (Fig.6b3). Similar toC.sinicus,P.parvusspread in the whole water column and did not undergo diel migration when the YSCWM disappeared in winter.
Aidanosagittacrassais the dominant species of chaetognaths in the YS and its biomass accounts for 43%-88% of the total biomass of chaetognaths (Huo et al., 2010). Liu et al. (2007) indicated thatA.crassais a eurythermal and psychrophilic species, and its preferred feeding temperature is 10-15 °C. In addition,A.crassais a carnivorous zooplankton,whose distribution pattern is similar to the distribution patterns of food organisms, such asC.sinicus,P.parvus, andO.similis(Nagasawa, 1991). The present study suggested that the vertical distribution ofA.crassahad seasonal variations during the formation and gradual disappearance of the YSCWM,and its distribution pattern was similar to the distribution patterns of food organisms (Fig.6). As a strong swimmer,A.crassacrossed the weaken thermocline and underwent diurnal migration in spring, was distributed in the 30-50 m during daytime,and migrated above 30 m at nighttime (Fig.6g1). In summer,A.crassashowed no obvious DVM when the YSCWM was strong and was mainly distributed above 20-m depth (Fig.6g2). Yang and Li (1995)showed thatP.parvusis the dominant food organism ofA.crassain summer. The result in the present study was consistent with Yang’s observation, and the vertical distribution ofA.crassawas similar to that ofP.parvus(Fig.6b2, g2). Thus, suitable temperature and abundant food may be responsible for the distribution ofA.crassaabove 20 m. In autumn,A.crassashowed no significant DVM while the YSCWM was gradually disappearing, and it mainly stayed above the 30-m depth (Fig.6g3). When the thermocline in the YS disappeared completely in winter (Fig.2d),A.crassawas found in the whole water column and did not undergo diel migration(Fig.6g4).
5 CONCLUSION
Annual zooplankton community succession was aff ected by the forming and fading of the YSCWM,and the species number and density of zooplankton varied significantly among seasons. Phytoplankton density was not the main factor that aff ected the vertical distribution of zooplankton. The existence of YSCWM resulted in significant diff erences between the zooplankton communities above and below the thermocline, and seasonal thermocline considerably influenced zooplankton DVM in northern YS. When thermocline was weak in spring and autumn, most species spread above the thermocline and underwent diel migration. The YSCWM was strong in summer,all species was limited above or below the thermocline.Zooplankton species were found in the whole water column when the thermocline disappeared in winter.
6 DATA AVAILABILITY STATEMENT
The datasets generated and/or analyzed during the current study are available from the corresponding author on reasonable request.
7 ACKNOWLEDGMENT
We are indebted to the captain and crew of the R/VDongfanghong2, and appreciate the kind help of Yousong Huang and Donghui Xu for sample collection on board. We thank the two anonymous reviewers for helpful comments and suggestions on this manuscript.
 Journal of Oceanology and Limnology2021年4期
- Journal of Oceanology and Limnology的其它文章
- Numerical study of the seasonal salinity budget of the upper ocean in the Bay of Bengal in 2014*
- Study on evaluation standard of uncertainty of design wave height calculation model*
- A fast, edge-preserving, distance-regularized model with bilateral filtering for oil spill segmentation of SAR images*
- A Gaussian process regression-based sea surface temperature interpolation algorithm*
- Climatology and seasonal variability of satellite-derived chlorophyll a around the Shandong Peninsula*
- Sources of sediment in tidal flats off Zhejiang coast, southeast China*
