A fast, edge-preserving, distance-regularized model with bilateral filtering for oil spill segmentation of SAR images*
Wandi WANG , Hui SHENG ,**, Yanlong CHEN ,2, Shanwei LIU , Jijun MAO ,Zhe ZENG , Jianhua WAN
1 China University of Petroleum, Qingdao 266580, China
2 National Marine Environmental Monitoring Centre, Dalian 116023, China
3 Surveying and Mapping Institute of Shandong Province, Jinan 250102, China
Abstract Marine oil spills are among the most significant sources of marine pollution. Synthetic aperture radar (SAR) has been used to improve oil spill observations because ofits advantages in oil spill detection and identification. However, speckle noise, weak boundaries, and intensity inhomogeneity often exist in the oil spill regions of SAR imagery, which will seriously aff ect the accurate identification of oil spills. To enhance marine oil spill segmentation of SAR images, a fast, edge-preserving framework based on the distance-regularized level set evolution (DRLSE) model was proposed. Specifically, a bilateral filter penalty term is designed and incorporated into the DRLSE energy function (BF-DRLSE) to preserve the edges of oil spills, and an adaptive initial box boundary was selected for the DRLSE model to reduce the operation time complexity. Two sets of RadarSat-2 SAR data were used to test the proposed method. The experimental results indicate that the bilateral filtering scheme incorporated into the energy function during level set evolution improved the stability oflevel set evolution. Compared with other methods, the proposed improved BF-DRLSE algorithm displayed a higher overall segmentation accuracy (97.83%). In addition,using an appropriate initial box boundary for the DRLSE method accelerated the global search process,improved the accuracy of oil spill segmentation, and reduced computational time. Therefore, the results suggest that the proposed framework is eff ective and applicable for marine oil spill segmentation.
Keyword: level sets; bilateral filter; marine oil spill segmentation; synthetic aperture radar (SAR) imagery
1 INTRODUCTION
Marine oil spill accidents, which have caused various types of environmental damage, have frequently occurred at diff erent scales (Rischard,2001; Chiau, 2005; Wang et al., 2019). Marine oil pollution is generally due to illegal ship discharges and large ship and oil rig accidents, such as the British Petroleum (BP) Deepwater Horizon oil spill accident(in 2010, northern Gulf of Mexico). Alves et al.(2016) stated that in the Eastern Mediterranean,during oil spill accidents, off shore oil spills may spread and reach the shoreline very quickly under certain weather and oceanographic conditions.Monitoring and research on off shore oil spills can solve the marine ecological and environmental damage caused by oil spills (Cisneros-Montemayor and Sumaila, 2010; Cheng et al., 2011). Synthetic aperture radar (SAR) is a well-established remote sensing tool for the detection of oil spills, and SAR has been proven to useful in clean-up operations after oil spill events (Jackson and Apel, 2004; Solberg,2012).
The segmentation of marine oil spill regions in SAR images is an important research topic (Topouzelis and Psyllos, 2012; Gautama et al., 2016; Espeseth et al., 2020). However, case studies using SAR data for marine oil spill accidents are insuffi cient. Unlike the state-of-the-art deep learning strategies that requirelabeled large amounts of oil-spill sample data to train complex models, the level set algorithm can directly segment a single SAR image. In recent years, the level set algorithm has been widely used in SAR images segmentation (de Andrade et al., 2017). For marine oil spill segmentation from SAR images,Karantzalos and Argialas (2008) presented a geometric level-set segmentation method for the detection of possible oil spills in SAR imagery. Ganta et al. (2012) proposed a level set model based on illumination reflectance to segment the oil spill areas in SAR satellite images. These two methods could not avoid the impact of speckle noise in SAR images.Shao et al. (2013) presented an integrated method involving spatial-based spatial fuzzy C-means and a level-set method for oil spill segmentation. Liu et al.(2015) presented a variational level set SAR image obtained with an oil spill detection method based on fuzzy clustering. These two methods use the boundary of the clustering result as the initial border of the level set. However, there are situations in which the initial border intersects with the real water-oil boundary due to the inaccuracy of clustering, which leads to unstable curve iterations and inaccurate segmentation results.To address random noise issues, Yang et al. (2014)developed a shape-initialized and intensity-adaptive level set method. To reduce the eff ect of noise, they proposed an effi cient Markov random field (MRF)embedded level set method to improve the robustness of segmentation (Yang et al., 2015). These two methods lose the edge details of areas with low backscattering. Wu et al. (2017) presented a two-stage method for the segmentation of oil spill images. In the first stage of this method, a filtering technique is applied to suppress the backscattering of the SAR image. However, filtering blurs the edges of the oil spill area. Song et al. (2018) presented an improved active contour model for marine oil spill segmentation.In this method, SAR images are filtered twice,resulting in the loss of the edge details of oil spills. Li et al. (2014) proposed an improved reconstruction algorithm for Compact-Polarimetry (CP) SAR on oil spill detection. Zhang et al. (2018) proposed a semiempirical ocean surface model for Canadian RADARSAT Constellation Mission (RCM) CP mode,and suggested that the new CP mode is helpful for monitoring of the ocean oil spill. However, due to the diversity of SAR data acquisition and ocean surface conditions, it is diffi cult to propose a general reconstruction model to achieve accurate extraction of oil spill.
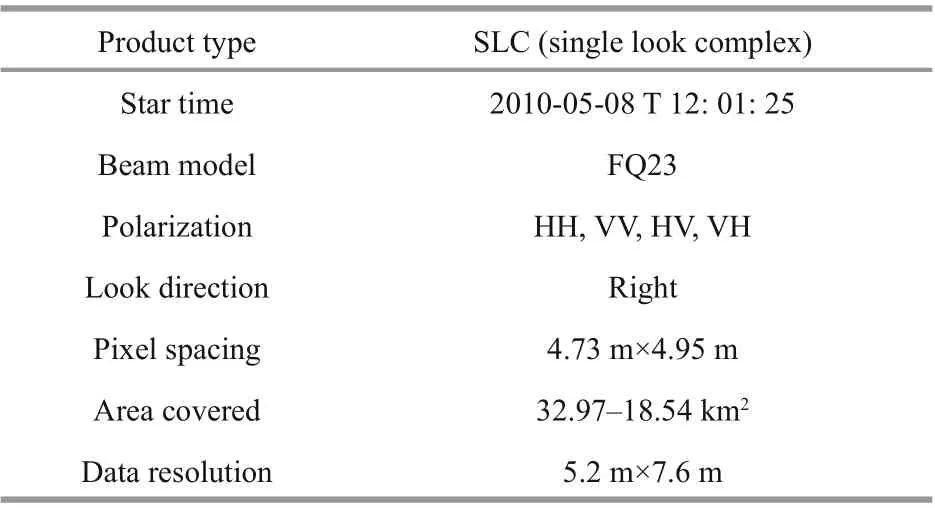
Table 1 Main information for the Radarsat-2 data used in this study (Dataset 1)
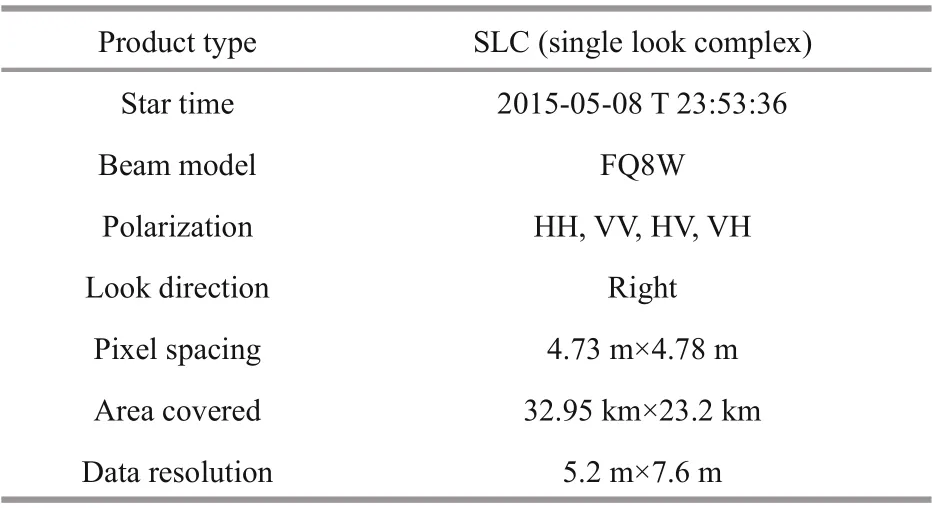
Table 2 Main information for the Radarsat-2 data used in this study (Dataset 2)
To solve the aforementioned issues and improve oil-spill segmentation performance, we proposed a fast, edge-preserving, distance-regularized level set evolution model with bilateral filtering (BF-DRLSE)for oil-spill segmentation from SAR images. The proposed BF-DRLSE algorithm mainly involves a bilateral filtering scheme and a better initial box boundary. The BF-DRLSE algorithm can smooth the SAR image without blurring the oil spill edge, and provides a better initial frame boundary for the DRLSE model to accelerate the model convergence.
2 MATERIAL AND METHOD
2.1 Remote sensing data
In this study, two sets of remotely sensed Polarimetric Radarsat-2 data were used. The Radarsat-2 SAR images over the ocean were acquired via fine quad-polarization imaging of the Gulf of Mexico. The first scene was acquired on May 8, 2010 with a space resolution along the azimuth and a range direction resolution of approximately 5 m. The second scene was acquired on May 8, 2015 with the same spatial resolution during an oil spill event. Tables 1 &2 present information for the two scenes. To validate the eff ectiveness of the proposed BF-DRLSE algorithm, SAR images with Vertical Vertical (VV)-The images of Dataset 1 were determined to contain oil spills and water. The type of oil is crude oil.polarization that contain diff erent marine oil spill regions were used as the test dataset (Figs.1 & 2).Because it is a tremendous amount of work to classify the total test area based on geographical knowledge and visual interpretation, we restricted the accuracy assessment to three areas ofinterest (AOIs)for two sets of remotely sensed data.
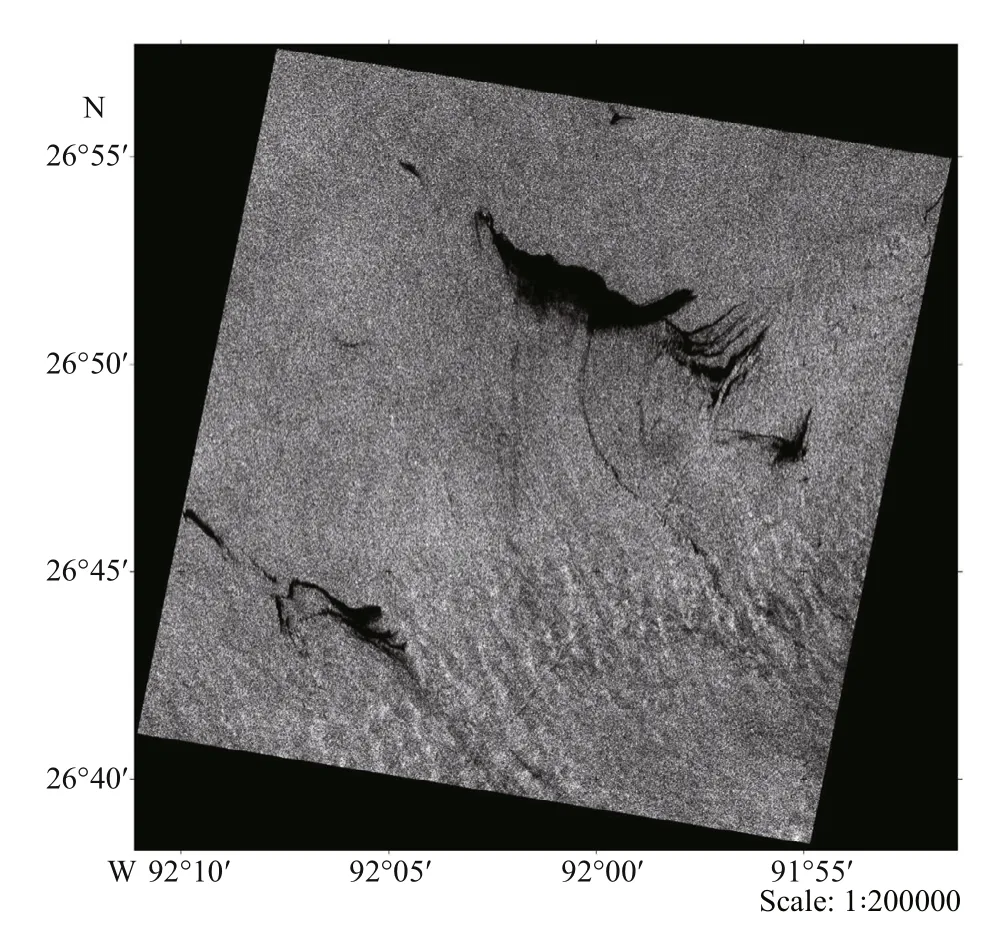
Fig.1 Marine oil spill images from RadarSat-2 SAR in VVpolarization backscatter imaging mode used in this study (Dataset 1)
2.2 Methodology
2.2.1 Improved DRLSE with a bilateral filter penalty term (BF-DRLSE algorithm)
Osher and Sethian (1988) proposed the level set method to track moving boundaries in 1988, in which the contour is formed by inserting a 2D plane into a 3D surface to represent the level set of the contour.Figure 3 shows that the 3D surface intersects the 2D plane exactly where the curve is located. The red 3D surface is called the level set function (LSF). The black boundary of the 2D white plane is the collection of all points at height zero, so it is called the zero level set. The level set algorithm attempts to move the contour of a zero LSF to the object boundaries by minimizing a cost function.
A contour can be expressed as (x,y,t), and the level set evolution equation can be expressed as:
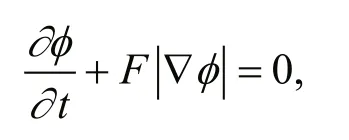
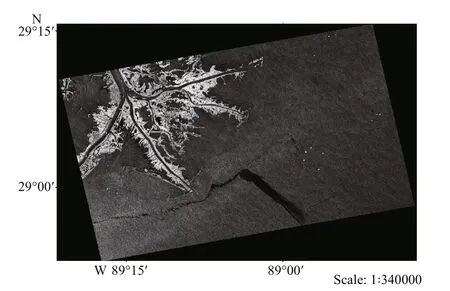
Fig.2 Marine oil spill images from RadarSat-2 SAR in VVpolarization backscatter imaging mode used in this study (Dataset 2)
whereφrepresents the zero level set of the level set The images of Dataset 2 were determined to contain oil spills and water. The type of oil is crude oil.function,Fis the speed function that controls the motion of the contour,tis a temporal variable, and ∇is the gradient operator.
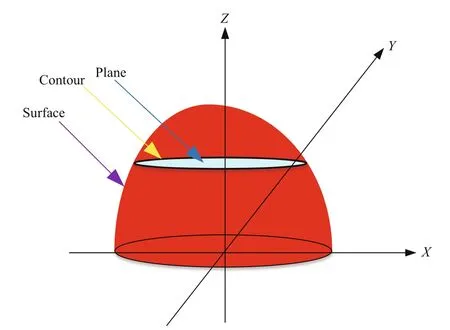
Fig.3 Schematic diagram oflevel set method
In conventional level set methods, the LSF typically develops irregularities during its evolution, and these irregularities generally cause numerical errors that influence the signed distance property, eventually aff ecting the stability oflevel set evolution. To solve this problem, reinitialization solution was introduced to restore the regularity of the LSF and maintain the stability of the level set evolution (Sussman et al.,1994; Sethian, 1999; Osher and Sethian, 1988; Li et al., 2010). A standard method for reinitialization is to solve the steady state form of the following evolution equation:

where sign(φ0) is the sign function,φ0is the LSF to be reinitialized. The steady state solution of evolution equation is a signed distance function under ideal conditions (Sussman and Fatemi, 1999; Li et al.,2010).
However, in the process of reinitialization using function of ∂φ/∂t, the level set function is periodically corrected, which is a very complex computation and has the high temporal complexity of the algorithm(Zhang et al., 2013). To overcome this issue, Li et al.(2010) proposed a DRLSE model with a distance regularization term and an external energy term.DRLSE method can drive the level set function close to a signed distance function without reinitialization,which reduce the number ofiterations and computational time and ensures sufficient numerical accuracy (Li et al., 2010).
The DRLSE model energy formula with distance regularization is defined by:
E(φ)= μRp(φ)+Eext(φ),
whereRp(φ) is the level set regularization term,Eext(φ)is the external energy, μ is a constant.Rp(φ) is defined by:

wherepis a potential (or energy density) function.The definition of the potentialpfor distance regularization is as follows.
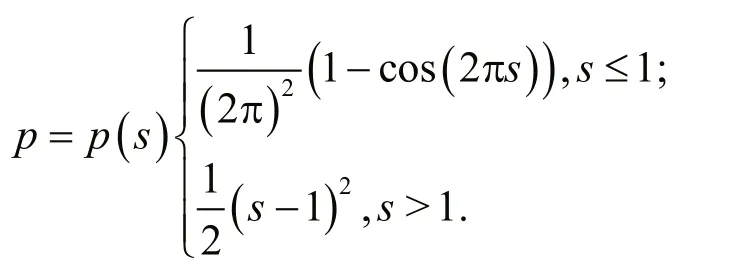
The energyEext(φ) is designed to be at a minimum when the zero level set of the LSF is located at a desired position.Rp(φ) eliminates the need for reinitialization by correcting the deviation between the level set functionφand the sign distance function sign(φ0).
LetIdenote an original marine oil spill SAR image in the domainΩ. The convolution inRp(φ) is used to smooth the SAR image and reduce noise. This edge indicatorgroughly captures the marine oil spill boundaries fromI.gis defined by:
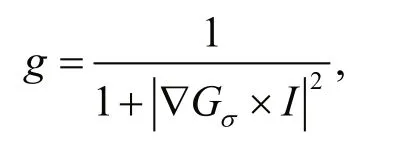
whereGσis a Gaussian kernel.
Edge indicatorgis included in the energy function for an LSF proposed by Li et al. (2010), and the energy functionalEext(φ) was defined as follows:
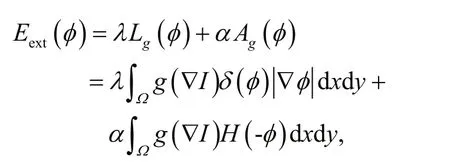
whereλandαare the coefficients of the energy functionalsLg(φ) andAg(φ), respectively,δ(φ) andH(-φ) are the Dirac delta function and the Heaviside function, respectively. The termLg(φ) is the line integral. In this study,Lg(φ) is minimized when the LSF contour is located at the marine oil spill boundaries inI. The energy functionalAg(φ) is the weighted area of the non-oil region ofIin this study and is used to slow the shrinking or expanding of the zero level contour when it reaches the marine oil spill boundaries.
As an outstanding remote sensing tool, SAR can provide high-resolution images of the marine surface for marine oil spill research. However, speckle noise can seriously aff ect SAR image quality (Argenti et al.,2013). The DRLSE model is an edge-based level set evolution method, and the edge indicator functiongis an important part ofits energy function. To reduce the speckle noise influence, image smoothing with Gaussian filter operatorGσin the edge indicator functiongis performed before level set evolution in the DRLSE method. However, this smoothing tends to blur the boundaries of marine oil spill regions and reduce the segmentation accuracy of marine oil spill regions.
To solve overcome the negative impacts of speckle noise in the DRLSE method, a bilateral filtering penalty term is proposed in this study. Because the well-known bilateral filtering operator has proven to be a remarkable denoising and edge-preserving method (Tomasi and Manduchi, 1998; Zhang et al.,2016; Fawwaz et al., 2018; Routray et al., 2018), it is adopted in this study to achieve noise suppression,precisely preserve oil spill edges, and improve the performance of the DRLSE model.
To simultaneously smooth the image and preserve edge details, a bilateral filter was proposed by Tomasi and Manduchi (1998). The bilateral filter is defined as follows:

whereiandjare the pixel indexes, (k,l) is the center point of the template,h(i,j) is the denoised intensity of pixel (i,j),f(k,l) is the intensity of the pixel at (k,l), andw(i,j,k,l) is the weight coeffi cient. The weightsw(i,j,k,l) are computed based on the neighborhood
approach. For the center samplef(k,l), the weightw(i,j,k,l) is computed by multiplying the following two factors:

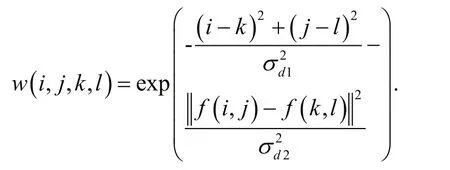
In the filtering process of the bilateral filter, the SAR image is convoluted based on the template with weightw(i,j,k,l):

whereÎis the filtered SAR image, andIis the original input SAR image to be filtered.
According to the above discussion, the improved DRLSE energy formulation with a bilateral filtering penalty term is defined by:
E(φ)= μRp(φ)+Eext(φ)+βEb(φ),
whereβis a constant, andEb(φ) is the bilateral filtering penalty energy.
In this study,Eb(φ) is designed as:

whereÎis the SAR image smoothed with the bilateral filter.
The energy functionalEb(φ) computes the convolution of SAR images with a bilateral filter. For the special case ofg=1, this energy is exactly associated with the edge of the oil spill.Eb(φ) will reduce the iteration speed when the level set contour approaches the oil spill boundaries.Eb(φ) is introduced to smooth SAR images without blurring oil spill edges. Here,gis used to slow the shrinking or expanding of the level set curve.
In this paper, the Dirac delta functionδand Heaviside functionHin the functionalEb(φ) are approximated by the following smooth functionsδεandHε, which are defined as follows:
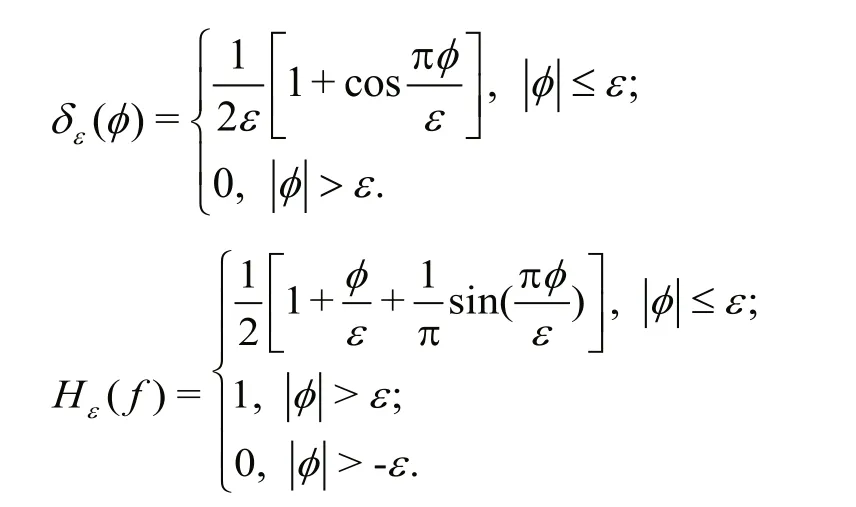
where the parameterεis set to 1.5.
The steady state solution of the gradient flow equation is the minimized energy function ofE(φ).The gradient flow equation is defined by:
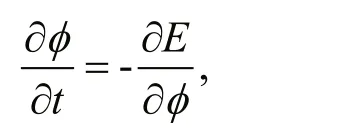
where ∂E/∂φis the Gâteaux derivative of the functionalE(φ).
The Gâteaux derivative of the functionalRpas follows:

According to the above analysis, the gradient flow equation ofE(φ) can be reformulated as follows.
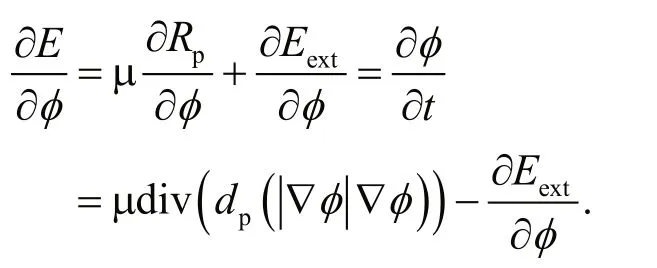
Minimize the energy functionEb(φ) and find the steady-state solution of the gradient flow equation.

According to the gradient flow equationEb(φ) andE(φ), the BF-DRLSE energy function with bilateral filtering penalty term can be reformulated as follows.

The minimization of the energy functional with a bilateral filtering penalty term can be obtained by the following iteration process.

The flow diagram of the level set evolution in the BF-DRLSE algorithm is illustrated in Fig.4. The pseudo-code is given in Table 3.
2.2.2 Improved initial box boundaries
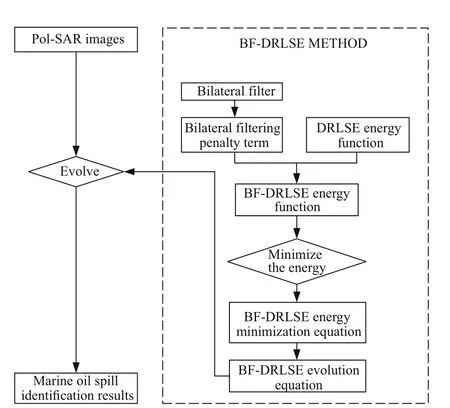
Fig.4 The flowchart of the algorithm
The DRLSE model can iterate the drive curve of any shape to the target boundary. The DRLSE model can drive the initial box boundary of any shape to the target boundary. However, if the initial box boundary is far from the target boundary, the curve evolution may require more complicated calculations that result in slower iteration of the level set curve and aff ect the accuracy of the final segmentation. To improve the estimation of the initial target contour positions, a method of obtaining a threshold using a histogram of VV-polarization SAR images is introduced. The advantages of the method include its simple computations and easy implementation. In this method of estimating the initial contours, the optimal threshold is selected using the 2-mode method between the peaks and valleys. The improved initial box boundaries accurately surround the oil spill boundary in this approach, making it faster and more accurate than the original BF-DRLSE algorithm.Notably, image-driven forces are used to drive the level function to the boundaries of the object ofinterest rather than assuming a rectangular initial box boundary. The concept of this method is demonstrated in Fig.5, and the initial guess of the initial box boundary is shifted by image-driven forces to the boundaries of the oil spill.
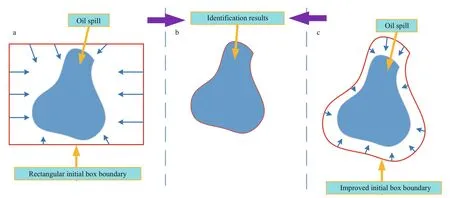
Fig.5 The concept of the proposed method

Table 3 Description of the pseudo-code of the BF-DRLSE algorithm
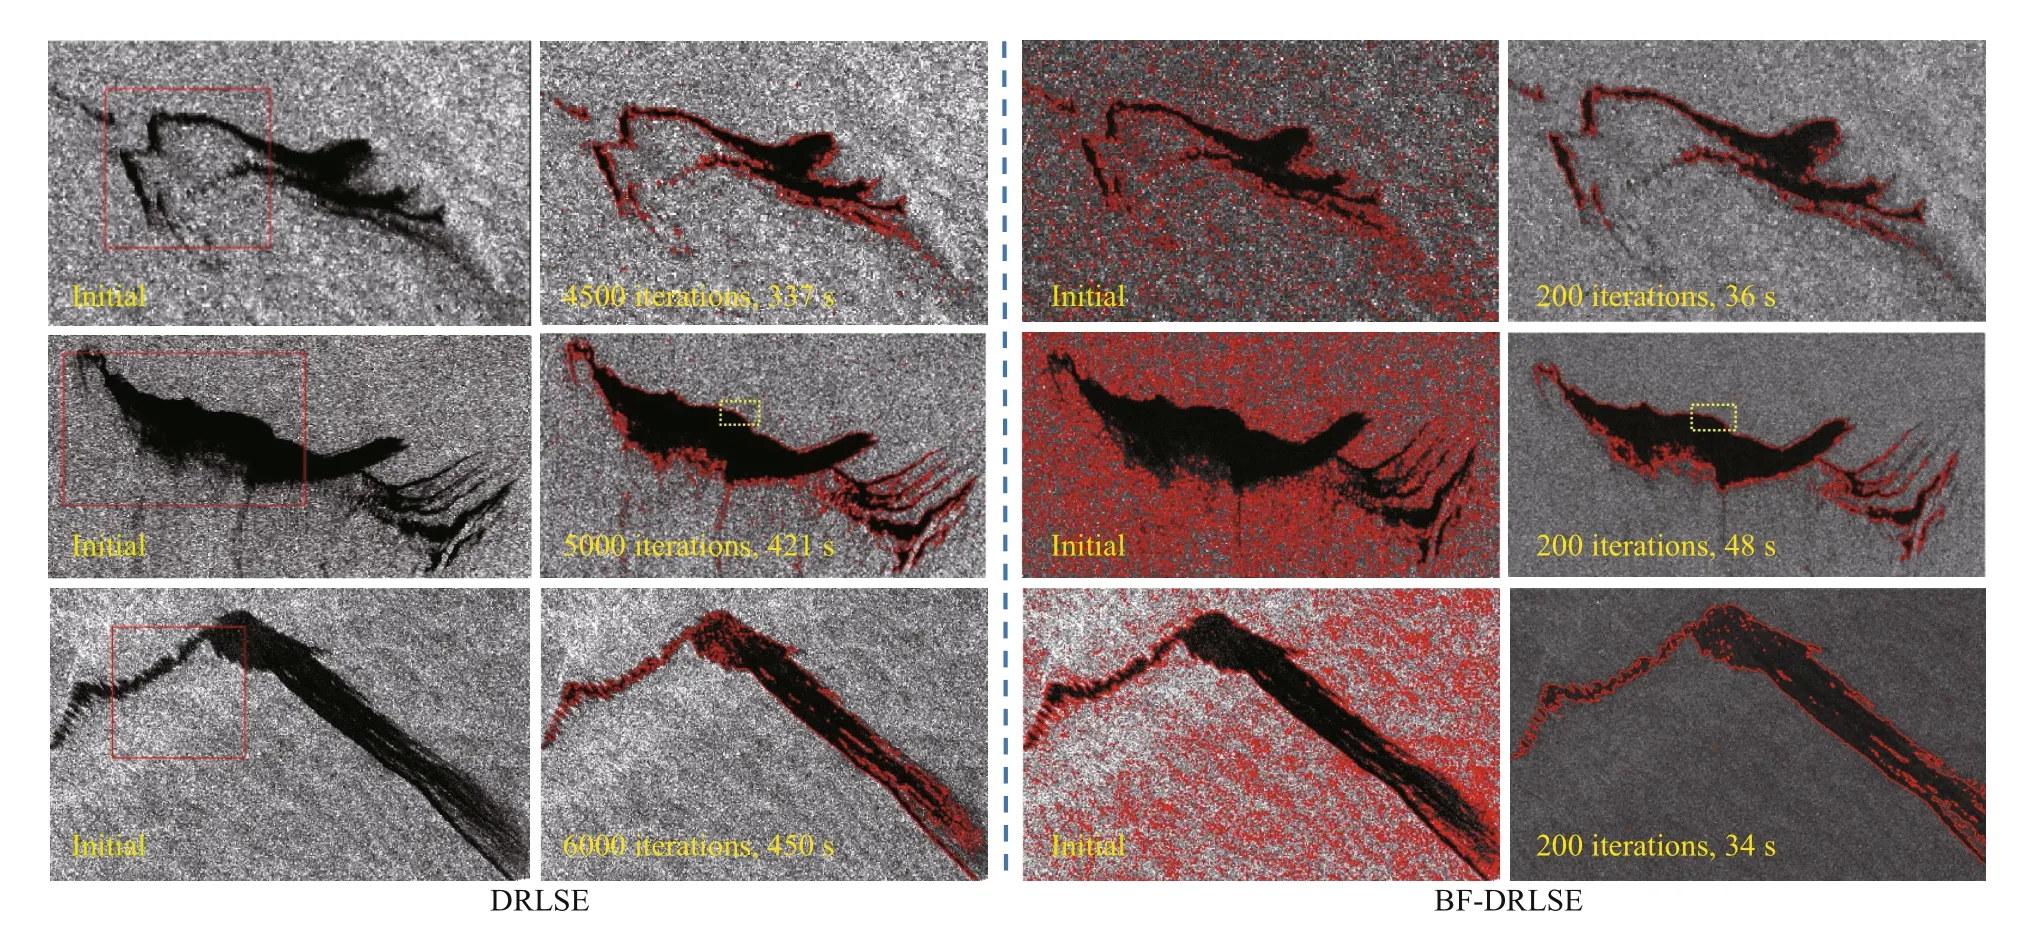
Fig.6 Results of the DRLSE and BF-DRLSE method at the initial and final times
3 RESULT AND DISCUSSION
3.1 Running effi ciency of the BF-DRLSE algorithm with an improved initial box boundary
The experimental results for the AOIs are shown in Fig.6. Significant diff erences were observed between the convergence results of the DRLSE and BFDRLSE algorithms. The BF-DRLSE model ran for 200 iterations and converged, and the DRLSE model ran to the more than 4 500 iterations. Figure 6 show the convergence results with diff erent level set initializations using the DRLSE method and the BFDRLSE algorithm, respectively. The first column shows diff erent level set initializations. The second column shows the convergence results of the DRLSE method and the BF-DRLSE algorithm. Figure 6 shows that most of the boundaries between seawater and oil spills can be detected using both initial box boundary. However, the final convergence result depends on the initialization of the level set. The DRLSE method ignores correlations among neighboring pixels; thus, the zero LSF often stops iterating at noisy points, which leads to inaccurate identification, as shown in red. The BF-DRLSE algorithm can use an improved initial box boundary to accurately surround the oil spill boundary. Notably,the BF-DRLSE method is much more robust against noise than the DRLSE method, and it can preserve more details. Moreover, the BF-DRLSE algorithm obtains more-accurate results and has a shorter execution time than the DRLSE method.
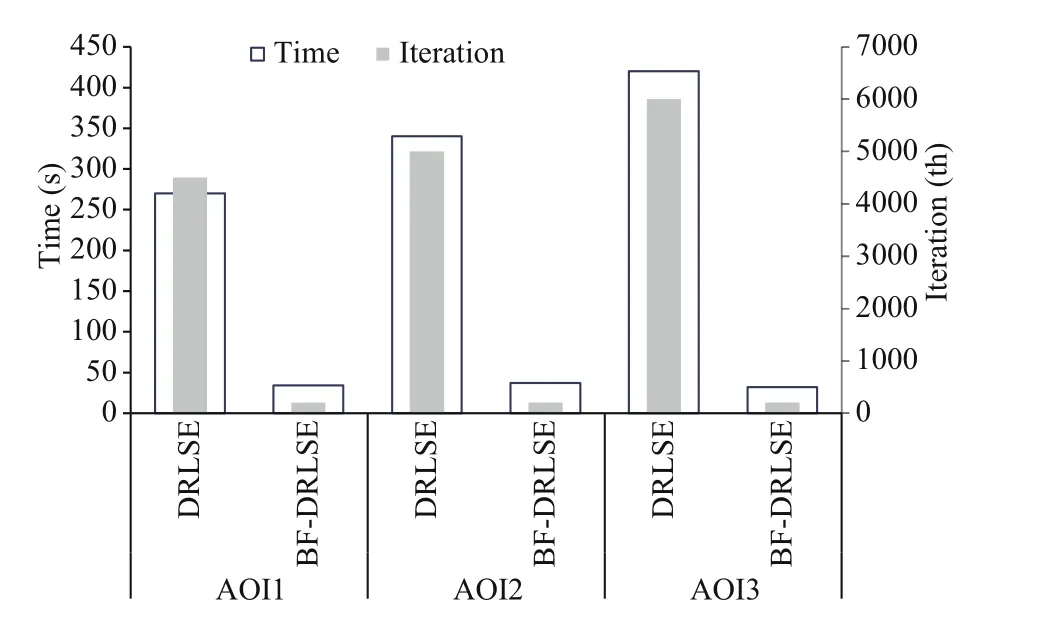
Fig.7 Time index and number ofiterations for diff erent initial box boundaries of AOI1 to AOI3
Figure 7 illustrates the runtime and number ofiterations for diff erent strategies. The execution times of the algorithm based on the rectangular initial frame are longer than those based on the improved initial contour when identifying the oil spills from all AOIs.These experimental results confirm that the improved initial box border provides a relative guarantee that the BF-DRLSE algorithm will achieve ideal convergence, thereby reducing the convergence time for oil spills in the AOIs.
3.2 Noise suppression without blurring edges in SAR images
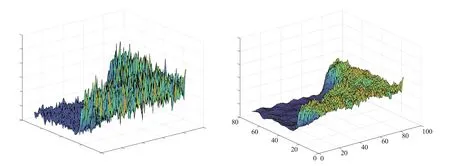
Fig.8 Image pixel value distribution

Table 4 The assessment of edge preservation eff ectiveness in the SAR images based on ESI
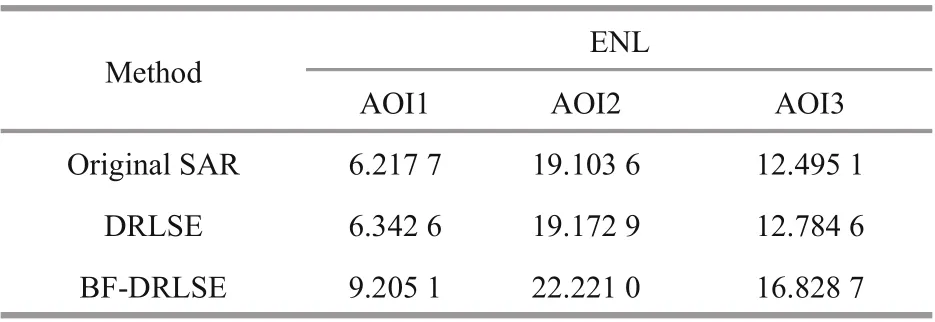
Table 5 The assessment of filtering eff ectiveness for an SAR images based on ENL
The BF-DRLSE algorithm can precisely preserve the oil spill edges in the segmentation results. The selected region in the dashed rectangle of the AOI1 image in Fig.6 is used as an example, and the pixel value distribution in the gray frame in the figure is shown in Fig.8. The boundary of an oil spill is often very weak and blurry due to the low contrast between the seawater and the oil spill (Jubai et al., 2006; Song et al., 2013), leading to the intensity distributions of the oil slick region and seawater having considerable overlap. The DRLSE method considers only the intensity distribution information, which limits its performance. Figure 8a indicates that the edges are greatly aff ected by noise, resulting in a very rough boundary between seawater and an oil spill. However,the proposed BF-DRLSE algorithm considers the correlations among neighboring pixels, and it does not stop the iteration of the zero-order set function at noisy points; thus, the boundary between seawater and an oil spill is accurately identified. Figure 8b clearly shows that the BF-DRLSE algorithm proposed in this study can be used to denoise SAR images and eff ectively preserve the variations in SAR image edge values so that the edges are not blurred.
To analyze the performance of the BF-DRLSE algorithm quantitatively and objectively, the image quality metrics, such as the equivalent number oflooks (ENL) (Adler et al., 2004) and the edge save index (ESI) (Tang et al., 1996), were calculated. ESI reflects how well the edges are preserved in an image after noise reduction compared with those in the original image.
A high value of ESI indicates that edge details are eff ectively conserved. The corresponding formula is as follows:
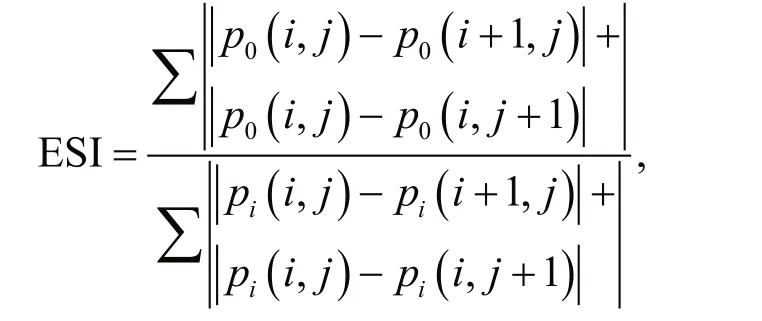
wherepiis the original image,p0is the despeckled image,iis the row number of the image andjis the column number. The ESI values are given in Table 4.
ENL is a metric that quantifies noise reduction in homogeneous areas of SAR images, and the ENL values increases as noise reduction improves. The ENL equation is defined as follows:
ENL=u2/σ2,
whereuis the mean of the pixel values in the AOI,andσis the standard deviation of pixel values. The ENL vales are presented in Table 5.
Tables 4 & 5 present the results of the quantitative metrics used to assess images based on the DRLSE and BF-DRLSE algorithms. The tables clearly show that the edge preservation and denoising results for the BF-DRLSE algorithm are better than those for the DRLSE method.

Table 6 Accuracy assessment of AOI1 classification results based on confusion matrix
3.3 Segmentation results and accuracy analysis
To comprehensively validate the eff ectiveness of the proposed BF-DRLSE algorithm in marine oil spill segmentation, we compared the BF-DRLSE algorithm with the DRLSE method, the DRLSE after bilateral filtering (BF) method, the Otsu method, and the Kittler and Illingworth (KI) method. Three state-ofthe-art speckle filters and segmentation procedures were implemented for comparison: the polarization SAR simultaneous sparse coding filter, which was incorporated into the DRLSE energy function (PSSCDRLSE) (Xu et al., 2016), the effi cient MRF embedded level set method (MRF-LSM) (Yang et al.,2015), and the improved active contour model (ACM)(Song et al., 2018). Note that the goal of this study is not to rank these technologies based on performance but rather to judge whether the algorithm is suitable for the SAR image in terms of the accuracy of the experimental results. Figure 9 compares the segmentation results for three sets of experimental data using the BF-DRLSE algorithm, MRF-LSM, the DRLSE model, the DRLSE after BF method, the Otsu method, the KI method, the PSSC-DRLSE model,and the improved ACM method. Figure 9i demonstrates the interpretation images. Figure 9a shows that the DRLSE model generally reaches the boundaries of oil spill regions, but the segmentation results contain many small detected regions that are not oil spill regions, which illustrates that the DRLSE model is sensitive to noise; therefore, it often stops the iteration of the zero LSF, leading to many false alarms. The segmentation results obtained with the DRLSE after BF method shown in Fig.9b exhibit poor segmentation performance. Figure 9c-d illustrates the results of the Otsu and KI methods,respectively. Although the results are visually better than those of DRLSE after BF, many false alarms still exist. Figure 9h displays that the MRF embedded level set model can roughly yield continuous boundaries between oil spills and seawater. Figure 9f presents that PSSC-DRLSE could basically find the contour of the oil spill, but there are many wrong contours. The robustness of DRLSE itself and the excessive de-speckle capability of the PSSC filter result in loss of the edge details of oil spills. Figure 9g indicates that segmentation eff ect of the improved ACM model is improved compared with those of the KI, Otsu, and PSSC-DRLSE, but the oil spill edge is partly blurred due to over-smoothing. The BF-DRLSE algorithm achieves the best performance with accurate boundaries for oil spill regions, and there are only a few mis-segmented areas.
The accuracy of the proposed algorithm and the other methods was manually evaluated by comparing the identified oil spill with the interpretation image.Specifically, the accuracy was determined based on the overall accuracy (OA) and kappa coeffi cient. For these metrics, large values reflect accurate classification.
The kappa equation can be formulated as:

whereris the number of rows in the error matrix;xiiis the number of observations along the diagonal of the error matrix;xi+andx+iare the marginal sums of rowiand columni, respectively; andNis the total number of observations.
OA is computed as follows:

wherexjjis the number of correctly segmented pixels.
To evaluate the performances of diff erent methods,this paper uses the confusion matrix and Kappa statistics to quantitatively analyze the experimental results of the BF-DRLSE model. Tables 6-8 give the OA and kappa coeffi cients of the eight methods.Except for the Otsu and KI methods, the overall accuracies of the classification methods are above 71%, and the kappa coeffi cients are greater than 0.70.Compared with the other methods, BF-DRLSE shows a significant improvement in the overall classification accuracy and kappa coeffi cient.Furthermore, the recall, precision, and F-measure of the experimental results based on BF-DRLSE are mostly better than those based on the other methods,which shows that BF-DRLSE can obtain oil spill classification results that are better than those of other methods. The results of these three groups of experiments confirm that BF-DRLSE is more suitable for oil spill classification than those of other methods are.
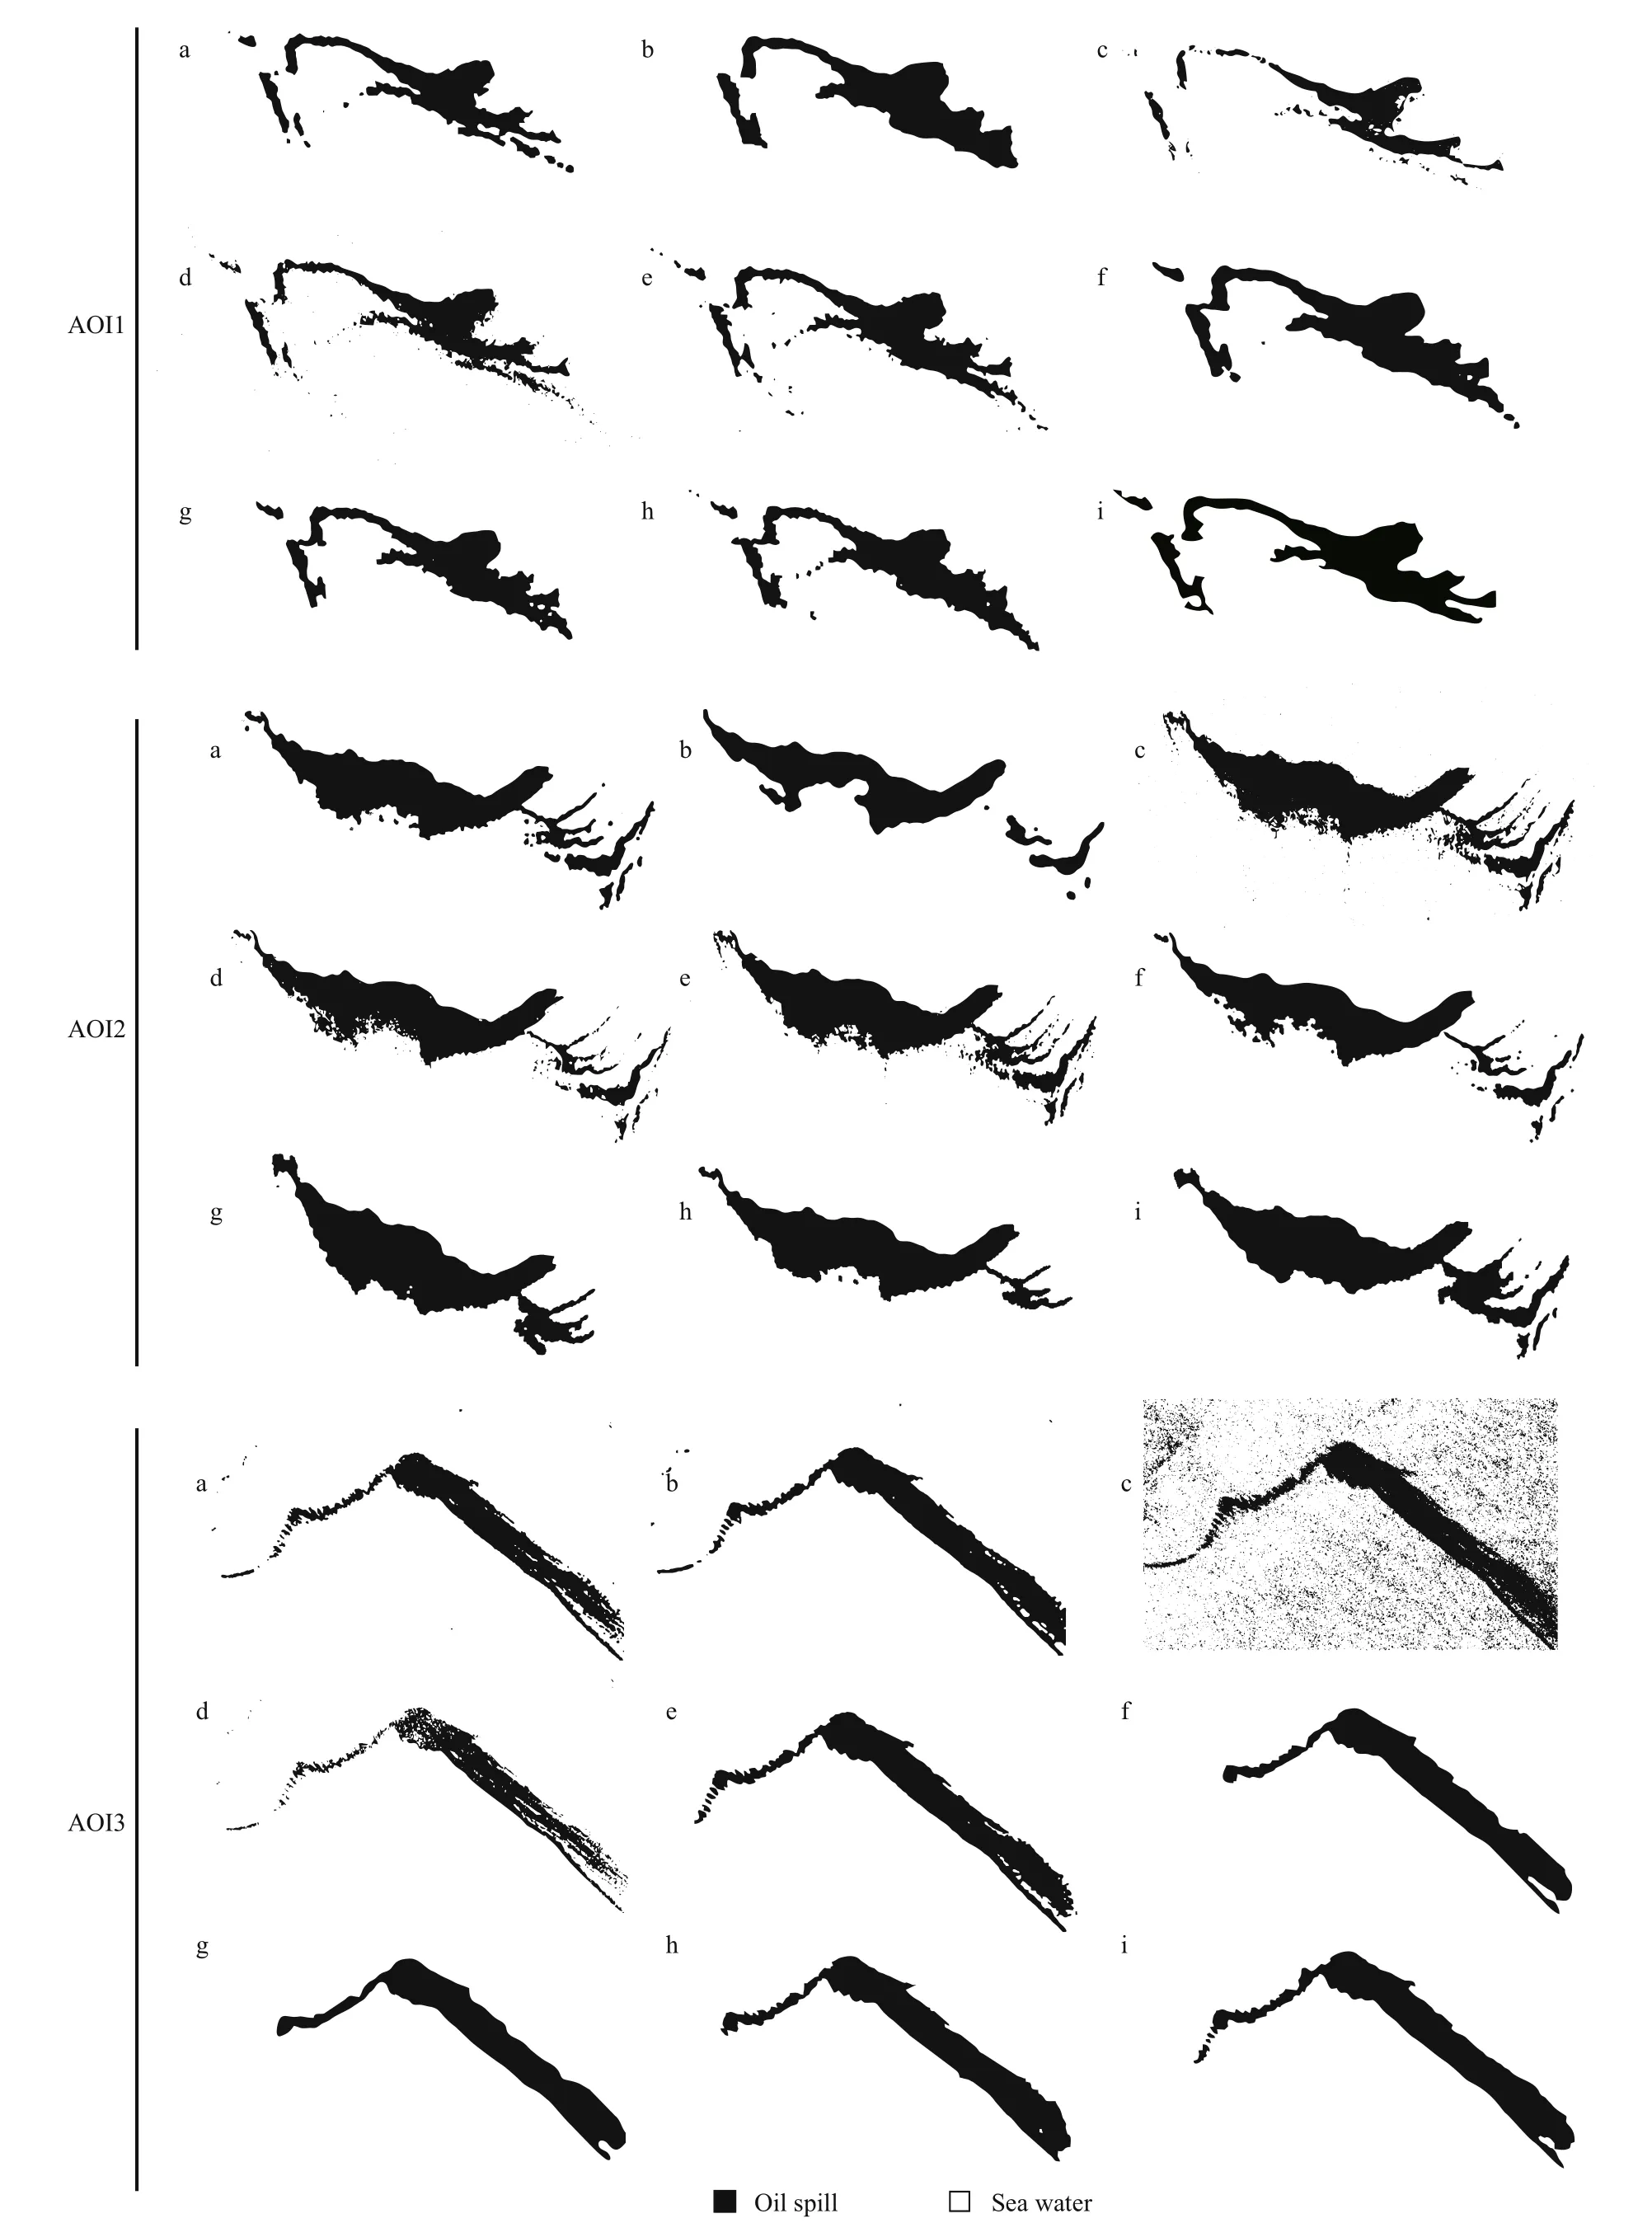
Fig.9 Visual segmentation results for oil spills based on areas ofinterest (AOI)

Table 7 Accuracy assessment of AOI2 classification results based on confusion matrix

Table 8 Accuracy assessment of AOI3 classification results based on confusion matrix
The confusion matrix of the oil-spill classification results using the BF-DRLSE algorithm is reported in Table 9. According to the confusion matrix,classification error was caused mainly by the misclassification of water as oil.
4 CONCLUSION
In this study, an advanced segmentation framework BF-DRLSE is proposed. The proposed BF-DRLSE segmentation framework can more accurately find the boundaries between seawater and oil spills from SAR images having speckle noise and blurred boundaries.The main contributions of segmentation framework BF-DRLSE are summarized below.
(1) The accurate segmentation of oil-spill edges is crucial for extracting oil-spill information. A bilateral filtering scheme is incorporated into the energy function during the level set evolution process, and it is capable of smoothing SAR images without blurring edges by minimizing the energy. The noise is filtered and the oil-spill edges are maintained, indicating that the selected bilateral filtering scheme improves the accuracy of oil-spill segmentation over traditionalmethods.
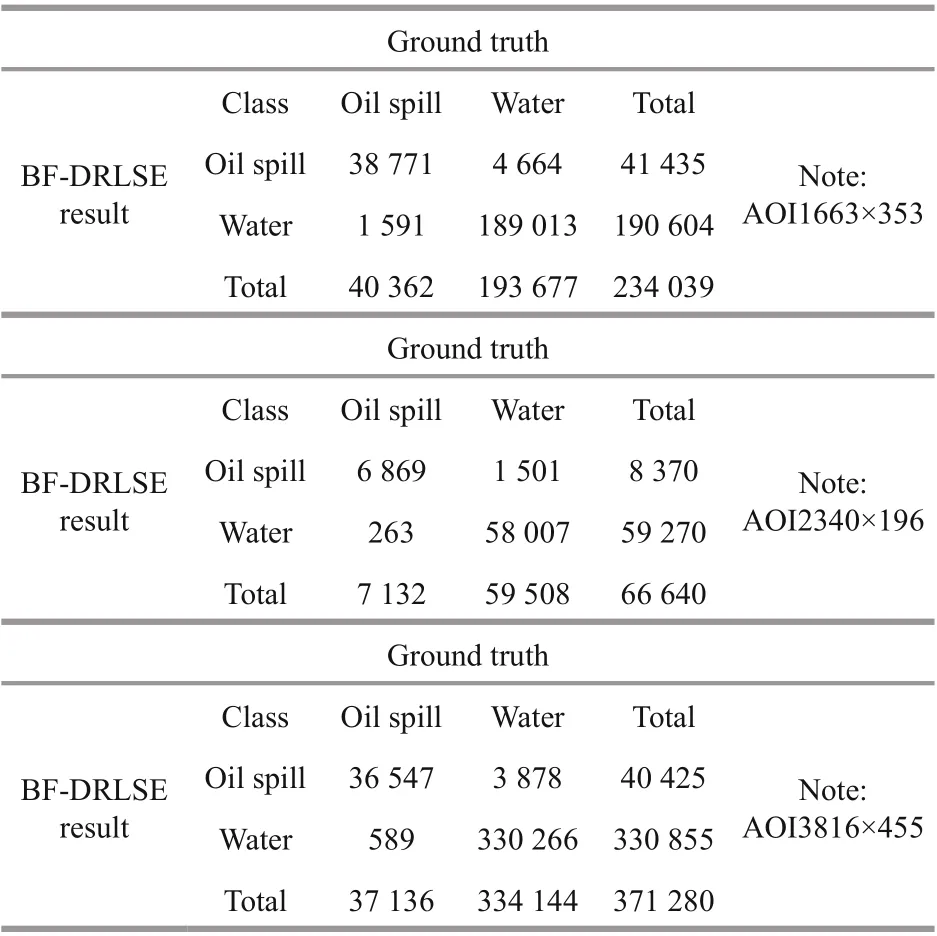
Table 9 Confusion matrix of AOIs using BF-DRLSE
(2) The eff ectiveness of the improved BF-DRLSE algorithm with an optimal initial box boundary was validated, and satisfactory experimental results were obtained. The results reveal that optimized initial box boundaries were helpful in approximating the feature boundaries of the area ofinterest. This approach not only decreased the computational time but also improved the classification accuracy.
(3) The combined usage of the optimal initial box boundary and the BF-DRLSE algorithm improved segmentation performance, thereby verifying the eff ectiveness and applicability of the proposed framework for marine oil spill segmentation.
5 DATA AVAILABILITY STATEMENT
The datasets generated during and/or analyzed during the current study are available from the corresponding author on reasonable request.
6 ACKNOWLEDGMENT
The authors thank the reviewers and editors for their professional and diligent works.
 Journal of Oceanology and Limnology2021年4期
- Journal of Oceanology and Limnology的其它文章
- Numerical study of the seasonal salinity budget of the upper ocean in the Bay of Bengal in 2014*
- Study on evaluation standard of uncertainty of design wave height calculation model*
- A Gaussian process regression-based sea surface temperature interpolation algorithm*
- Climatology and seasonal variability of satellite-derived chlorophyll a around the Shandong Peninsula*
- Sources of sediment in tidal flats off Zhejiang coast, southeast China*
- Characteristics of dissolved organic matter in lakes with diff erent eutrophic levels in southeastern Hubei Province,China*
