Heavy metals in sediments of Yellow Sea and East China Sea: Chemical speciation, distribution, influence factor, and contamination*
Miao ZHAO , Shenghui ZHANG , Haitao HAN , Dawei PAN ,**
1 Key Laboratory of Coastal Environmental Processes and Ecological Remediation, Yantai Institute of Coastal Zone Research(YIC), Chinese Academy of Sciences(CAS); Coastal Environmental Processes, Research Center for Coastal Environment Engineering Technology of Shandong Province, YIC, CAS, Yantai 264003, China
2 University of Chinese Academy of Sciences, Beijing 100049, China
Abstract Metal species and the degree of environmental pollution are related to the hydrogen sulfide(H 2 S), an important product of early diagenesis that can react with metals to form stable compounds. To investigate the eff ects of H 2 S to metals and evaluate metal environment eff ect in the sediments of the East China Sea (ECS) and Yellow Sea (YS), geochemical characteristic and spatial distribution of nine heavy metals and H 2 S profile were studied. Higher H 2 S content and lower metal content was observed in the sediments 10 cm in depth in the North Yellow Sea and the west coast of South Korea. The pollution load index ( I pl) indicates that the southern coast of Shandong Peninsula underwent moderate pollution ( I pl=1) of heavy metals and no heavy metal pollution appeared in other areas ( I pl <1). To some extents, the ecological risk of Cd and As enrichment was moderately severe in all stations. The chance of heavy metal combination to be toxic in ECS and YS during summer was 21%. In addition, correlation between H 2 S content and metals in both solid and porewater phases was obvious, corroborating important eff ect of H 2 S on metal distribution.Moreover, H 2 S could aff ect the spatial distributions of heavy metals in porewater directly and be indicative of potential biological eff ects of combined toxicant groups in the study region.
Keyword: hydrogen sulfide; heavy metal; East China Sea and Yellow Sea; sediment; porewater; risk assessment
1 INTRODUCTION
Heavy metals are involved in almost every aspect of marine life and play a dual role in marine biogeochemical cycles. Most heavy metals (such as cobalt, cadmium, etc.) act as basic micronutrients at low concentrations but pose a threat to marine biota at higher concentrations because of the bioaccumulatable,nonbiodegradable, and toxic nature (Gu et al., 2012;Varol and Şen, 2012). Heavy metals are derived mainly from modern sewage and industrial emissions,and their flux into the aquatic environment is usually through waste dumping, and riverine and aeolian processes (Bak et al., 1997). Heavy metals that discharged into the ocean would be further accumulated in the sediments by the physical adsorption, coprecipitation, complexation, and ion exchange. For instance, dissolved arsenic and copper can be absorbed into sediment by precipitating amorphous iron oxyhydroxides; cobalt can easily form complexes and be incorporated into sediment;and molybdenum tends to coprecipitate with pyrite(Bryan and Langston, 1992; van de Velde et al., 2020).The absorption of heavy metals into sediment always goes with the redox reaction and particle-reaction,and these processes can significantly aff ect heavy metal biogeochemical processes (Liu et al., 2015).Additionally, metals can be released back to porewater from solid phases during the processes of organic matter mineralization, dissimilatory reduction, and pH decrease (van de Velde et al., 2017).
Heavy metals can be concentrated in sediments for 103-105times of those in overlying water, and the metal effl uxes from sediment to overlying seawater were usually in a very low level (Bryan and Langston,1992). Therefore, the total concentration of heavy metals in solid phase could not reflect their potential toxicity precisely (Tessier et al., 1979). Diff erent chemical speciation of metals have diff erent environmental behaviors and ecotoxicology, metal fractionation has been proved critical in assessing their bioavailability and mobility in previous studies(Massas et al., 2009; Nagajyoti et al., 2010). In addition, the ratio of metals in solid phase and porewater is associated closely with their toxicity and fate of metals (He et al., 2017). Therefore, it is of great importance to study the metals fractionation and metals content in porewater.
In addition to sediment type, organic content,hydroxide ofiron and manganese, bioturbation, and pH, sulfide is a critical factor on the concentration,toxicity, and destiny of metals (Chapman et al., 1998;Burton et al., 2006; He et al., 2017; Shyleshchandran et al., 2018). Substantial evidence has demonstrated that the deposition and release of heavy metal can be aff ected by sulfide significantly. For instance, acid volatile sulfide (AVS) played a major role in controlling the concentrations of heavy metal and reducing the biotoxicity of heavy metals in sediments(Machado et al., 2004). Mineralization of sulfur and iron would impose on the circulation of various metals such as arsenic, cobalt, and iron (Malkin et al.,2014). As an important reducing product of early mineralization process, hydrogen sulfide (H2S) can react with metals in the formation of metallic sulfide(e.g., FeS, PbS, and ZnS), and many divalent transition metals (e.g., Ni2+, Cd2+, and Cu2+) can be incorporated during transformation of FeS to pyrite (Morse and Luther III, 1999). The biogeochemical cycles of heavy metals and sulfur in solid has attracted a great interest in the past few decades (Giblin and Howarth,1984; He et al., 2011; Li et al., 2017). However,investigations on the impact of H2S in porewater on the speciation, distribution toxicity of heavy metals are very limited. Therefore, it is essential to delineate the relationship between sulfide and heavy metals in porewater.
Heavy metal circulation during mass exchange between continental shelf and open sea is an important part of global material cycle process. The Yellow Sea(YS) and East China Sea (ECS) is one of the largest continental shelves in the world with a total surface area of 1.2×10⁶km2, of which ~75% are in 50-100-m water depths. The YS and ECS not only have a wide shelf, typical muddy areas, complex current systems(coastal and warm), and diverse organisms, but also influenced by the Changjiang (Yangtze) River and Huanghe (Yellow) River having large sediment discharge (Yang and Liu, 2007; Liu et al., 2014).Meanwhile, due to the adjacency to the most economically developed region of China, large amounts of metals from various anthropogenic sources are released into the ECS and YS via atmospheric deposition and land runoff (Duce et al.,1991; McKee et al., 2004; Viers et al., 2009).Therefore, the ECS and YS is an ideal place to study the influence of natural and anthropogenic factors on heavy metals biogeochemistry. To study the chemical speciation, distribution, influence factor of heavy metals and evaluate the relationship between H2S and potential heavy metal hazards in ECS and YS sediments, vertical distribution of heavy metals (Cd,Cr, Cu, Pb, Zn, As, Co, Ni, and Mn) in porewater and the heavy metal fractionation (acid soluble, reducible,oxidizable, and residual fraction) were studied.
2 MATERIAL AND METHOD
2.1 Sediment sampling
In total, 12 sediment cores from six stations were collected in the ECS (F4, middle area of the ECS;W1, Zhejiang coastal region) and YS (H5, northern Yellow Sea; A2, southeastern coast of Shandong Peninsula; B5, west coast of South Korea; C3, middle of the YS) on board the R/VDongfanghong2from 25 June to 12 July, 2018 (Fig.1). At each site, two parallel sediment cores were sampled via PVC core liners(10-cm inner diameter; 20-cm long) and covered with overlying water immediately. Upon retrieval, cores were carefully inspected and only those with a visually undisturbed surface were used for further measurements. Well-preserved sediment samples for microsensor H2S profiling were measured using commercial micro-electrodes (20-μm tip diameter,Unisense A.S., Denmark) at in situ temperatures to avoid artefacts. The other sediment cores were sliced every 2 cm and porewater was collected using Rhizon Soil Moisture Samplers under N2in a glove bag to prevent any oxidation of the reduced species present in sediments. Sediment slices were sealed in plastic bags and extracted porewater samples were transferred into 10-mL polyethylene plastic bottles soaked in nitric acid for more than 24 h (Ji et al., 2018). All of the above pretreated samples were sealed and stored at 4 °C prior to analyses.
2.2 Analysis of porewater
Samples were analyzed immediately after they arrived at laboratory. Identification of metals (Cd, Pb,Cr, Zn, As, Co, Cu, Mn, and Ni) in porewater was carried out using inductively coupled plasma mass spectrometer (ICP-MS) (ELAN DRC II, Hong Kong)in accordance with the China’s National Standard Method (State Environmental Protection Administration of China (SEPA), 2004). Samples for SO42ˉ analysis were diluted 10 times and measured by ion selective electrode method with an ion chromatograph (Dionex ICS3000, USA). A total organic carbon analyzer(TOC-VCPH, Shimadzu, Japan) was used to measure total carbon (TC) and dissolved organic carbon(DOC), and DOC content was obtained by first acidifying the sample to remove the dissolved inorganic carbon (DIC), then subtracting the DOC from the TC to obtain the DIC content (Kao et al.,2003).
2.3 Analysis of solid phase chemistry
Sediment slices were first lyophilized in a freeze dryer, and then ground in an agate mortar. The grain size of sediments at all depths was measured with a laser particle size meter (Marlvern Mastersizer 2000F, Britain) after removing shell and other larger particles. Dried samples for total organic carbon(TOC) and metal contents determination were passed through a 100-mesh sieve and mixed. The metals(Cd, Cr, Cu, Pb, Zn, As, Co, Ni, and Mn) in the YS and ECS were continuously extracted using a modified Community Bureau of Reference (BCR)three-step leaching method (Rauret et al., 1999; Gao and Chen, 2012). In this study, the studied metals were divided into the following four groups: (1) acid soluble fraction (weak acid sensitive and exchangeable): easy to dissolve, migrate, and transform, reflecting the impacts of human sewage discharge and biotoxicity; combine with carbonate,highly sensitive to pH; (2) reducible fraction(combine with iron-manganese oxides): can reflect environmental pollution from human activities; (3)oxidizable fraction (bind to sulfides and organic matter): reflect the results of aquatic activities and human discharge of organic-rich wastewater; and (4)residual fraction: generally present in lithogenic minerals such as silicates, primary, and secondary minerals, the result of natural geological aeolian deposits. They are not easily released under natural conditions, can be stabilized in sediments for a long time, and are not easily absorbed by plants; the residual fraction is aff ected by mineral composition,rock weathering, and soil erosion (Han et al., 2005).The treated solute samples were evaluated by ICPMS (Perkin-Elmer Optima 7000 DV, USA). In addition, atomic emission spectrometry (Thermo IRIS Intrepid II) was used to analyze the Al content and calculate the enrichment factor (EF) for each element in sediments. TOC and total nitrogen (TN)were measured with elemental analyzer (Vario Micro cube, Germany) after removing the inorganic carbon by adding HCl.
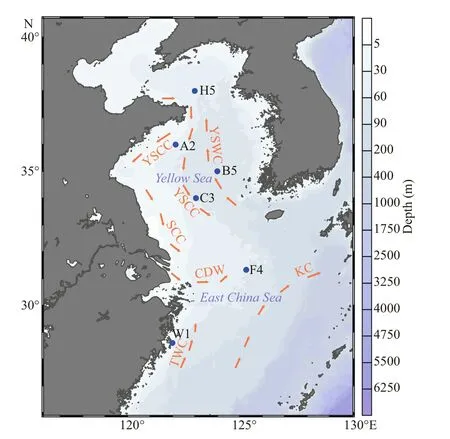
Fig.1 Locations of sampling stations and circulation system
2.4 Statistical analysis
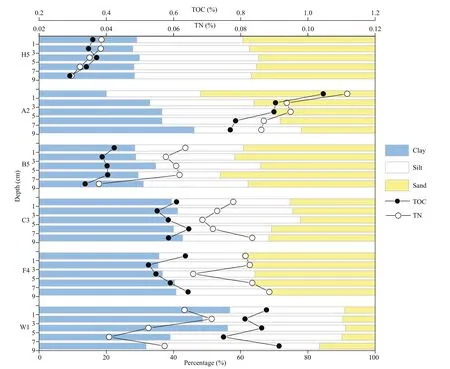
Fig.2 Vertical profile of sediments grain size composition, total organic carbon concentration and total nitrogen concentration
One-way analysis of variance (ANOVA), Tukey’s test, and the two-samplet-test were performed to demonstrate the diff erences between treatments.SPSS 22.0 (SPSS Inc. Chicago, IL, USA) was used for regression analysis. AP<0.05 was considered statistically significant. R packages: Corrplot and Ocean Data View 5.3.4 were used for graphic works.Standard substances (GBW07314, GBW07315) were used to test the accuracy of metal measurement, the method error was controlled within 5% (Table 1). In addition, the pollution load index (Ipl) (Tomlinson et al., 1980), geoaccumulation index (Igeo) (Mǜller,1969), ecological harm coeffi cient (Eri) (Hakanson 1980), enrichment factor (EF) (Kaushik et al., 2009;Sakan et al., 2009), and mean eff ects range-median(ERM) (Carr et al., 1996; Zhang et al., 2019) were also applied to assess the environment eff ects of heavy metals in ECS and YS sediments. Furthermore,the upper continental crust values (Taylor and McLennan, 1995) were used as references for unpolluted sediments, and the Earth’s average shales metal content (Turekian and Wedepoh, 1961) was chosen as the metal background concentration for indicators calculation (Al was chosen for normalization to calculate EF).
3 RESULT
3.1 General features of sediment and porewater
The research stations spanned in a large area and are aff ected by various natural and human factors, the sediments characteristics diff er from area to area, thus the grain size compositions, TOC, and TON at each station were measured and the results are shown in Fig.2. The mean percentage of sand content in H5 and B5 was high, while in A2, C3, F4, and W1, clay content was high. Sand content in sediments was the lowest at W1 station. TOC content showed a downward trend at the depth of 0-2 cm. TOC content unevenly distributed in C3, F4, and W1 in depth,while decrease from top to bottom in other stations.The distribution trend of TN was similar to TOC and the mean content is shown in Table 2. The TOC% was positively correlated with clay composition (R=0.588,P<0.001), but negatively related with sand content(R=-0.625,P<0.001), revealing that the enrichment capacity of fine-grain was higher than coarse-grain(Xing et al., 2011). The value of the carbon/nitrogen ratio (TOC/TN) was used to determine the source of organic: TOC/TN>12, terrestrial organics; TOC/TN<8, marine-derived organic matter (Sampei and Matsumoto, 2001). Values of TOC/TN are shown in Table 2. Organic matter in W1 was influenced by land derived input, which is closer to land while marine plankton provided more organic matter for the sediments of B5. Organic matter in other stations was aff ected by the combination of two factors.

Table 1 Certified and measured heavy metal concentrations of the standard reference materials (GBW07314, GBW07315)(unit: mg/kg, except for Al in % and for Mn in mg/g)
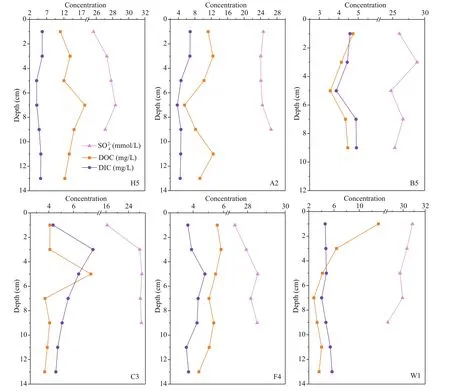
Fig.3 Vertical profiles for SO 42ˉ, DIC, and DOC at sampling stations
The vertical distributions of SO42ˉ, DIC, and DOC in sediment porewater are shown in Fig.3. There were no obvious vertical variations of SO42ˉ and DIC in the sediment porewater within 10 cm. DIC concentrations were lower than that of DOC except W1 and B5.Furthermore, a markedly hypoxic in the Fujian and Zhejiang coastal region during the summer was inferred based on bottom O2concentrations at W1 (Table 2).

Table 2 General characteristics of sediment and porewater in study area
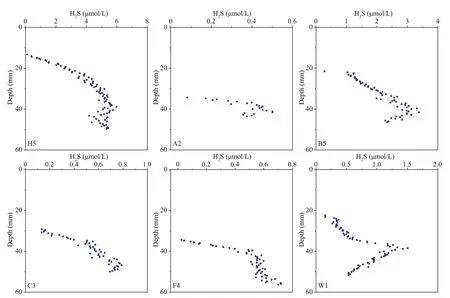
Fig.4 Microsensor depth profiles for H 2 S at sampling stations
3.2 Microsensor H 2 S profile
H2S porewater distributions in this study are shown in Fig.4. Generally, H2S concentration was below the detection limit (0.1 μmol/L) in the surface sediments because of the high oxygen concentration(Holmer and Storkholm, 2001). H2S was increasing gradually with the increase of depth and usually reached a maximum at 3-5 cm. The maximum H2S values (H2SMAX) are shown in Table 2, and the values and microsensor depth profiles of H2S were consistent with those in the southern North Sea (van de Velde et al., 2016). The formation of H2S was mainly resulted from sulfate and sulfate reducing bacteria, which relied on the degradable organic matter under anaerobic conditions. Therefore, the distribution of H2S was mainly associated with the content of organic matter and sulfate (Nedwell and Abram, 1978; Pester et al., 2012). We found that the maximum value of H2S in H5 (5.99 μmol/L) was higher than those in other tested stations, while maximum value of H2S was lower in A2 (0.50 μmol/L). Concentrations of DOC in porewater of H5 were high (>11.0 mg/L), which promoted the activity of sulfate-reducing bacteria and enhanced the sulfate reduction rate. The content of SO42ˉ in A2 was low(<26.5 mmol/L), which was the limitation of sulfate reduction in A2. We found that the spatial distributions of H2S were similar at C3 and F4, probably because of the similar SO42ˉ contents and DOC concentrations in these areas.
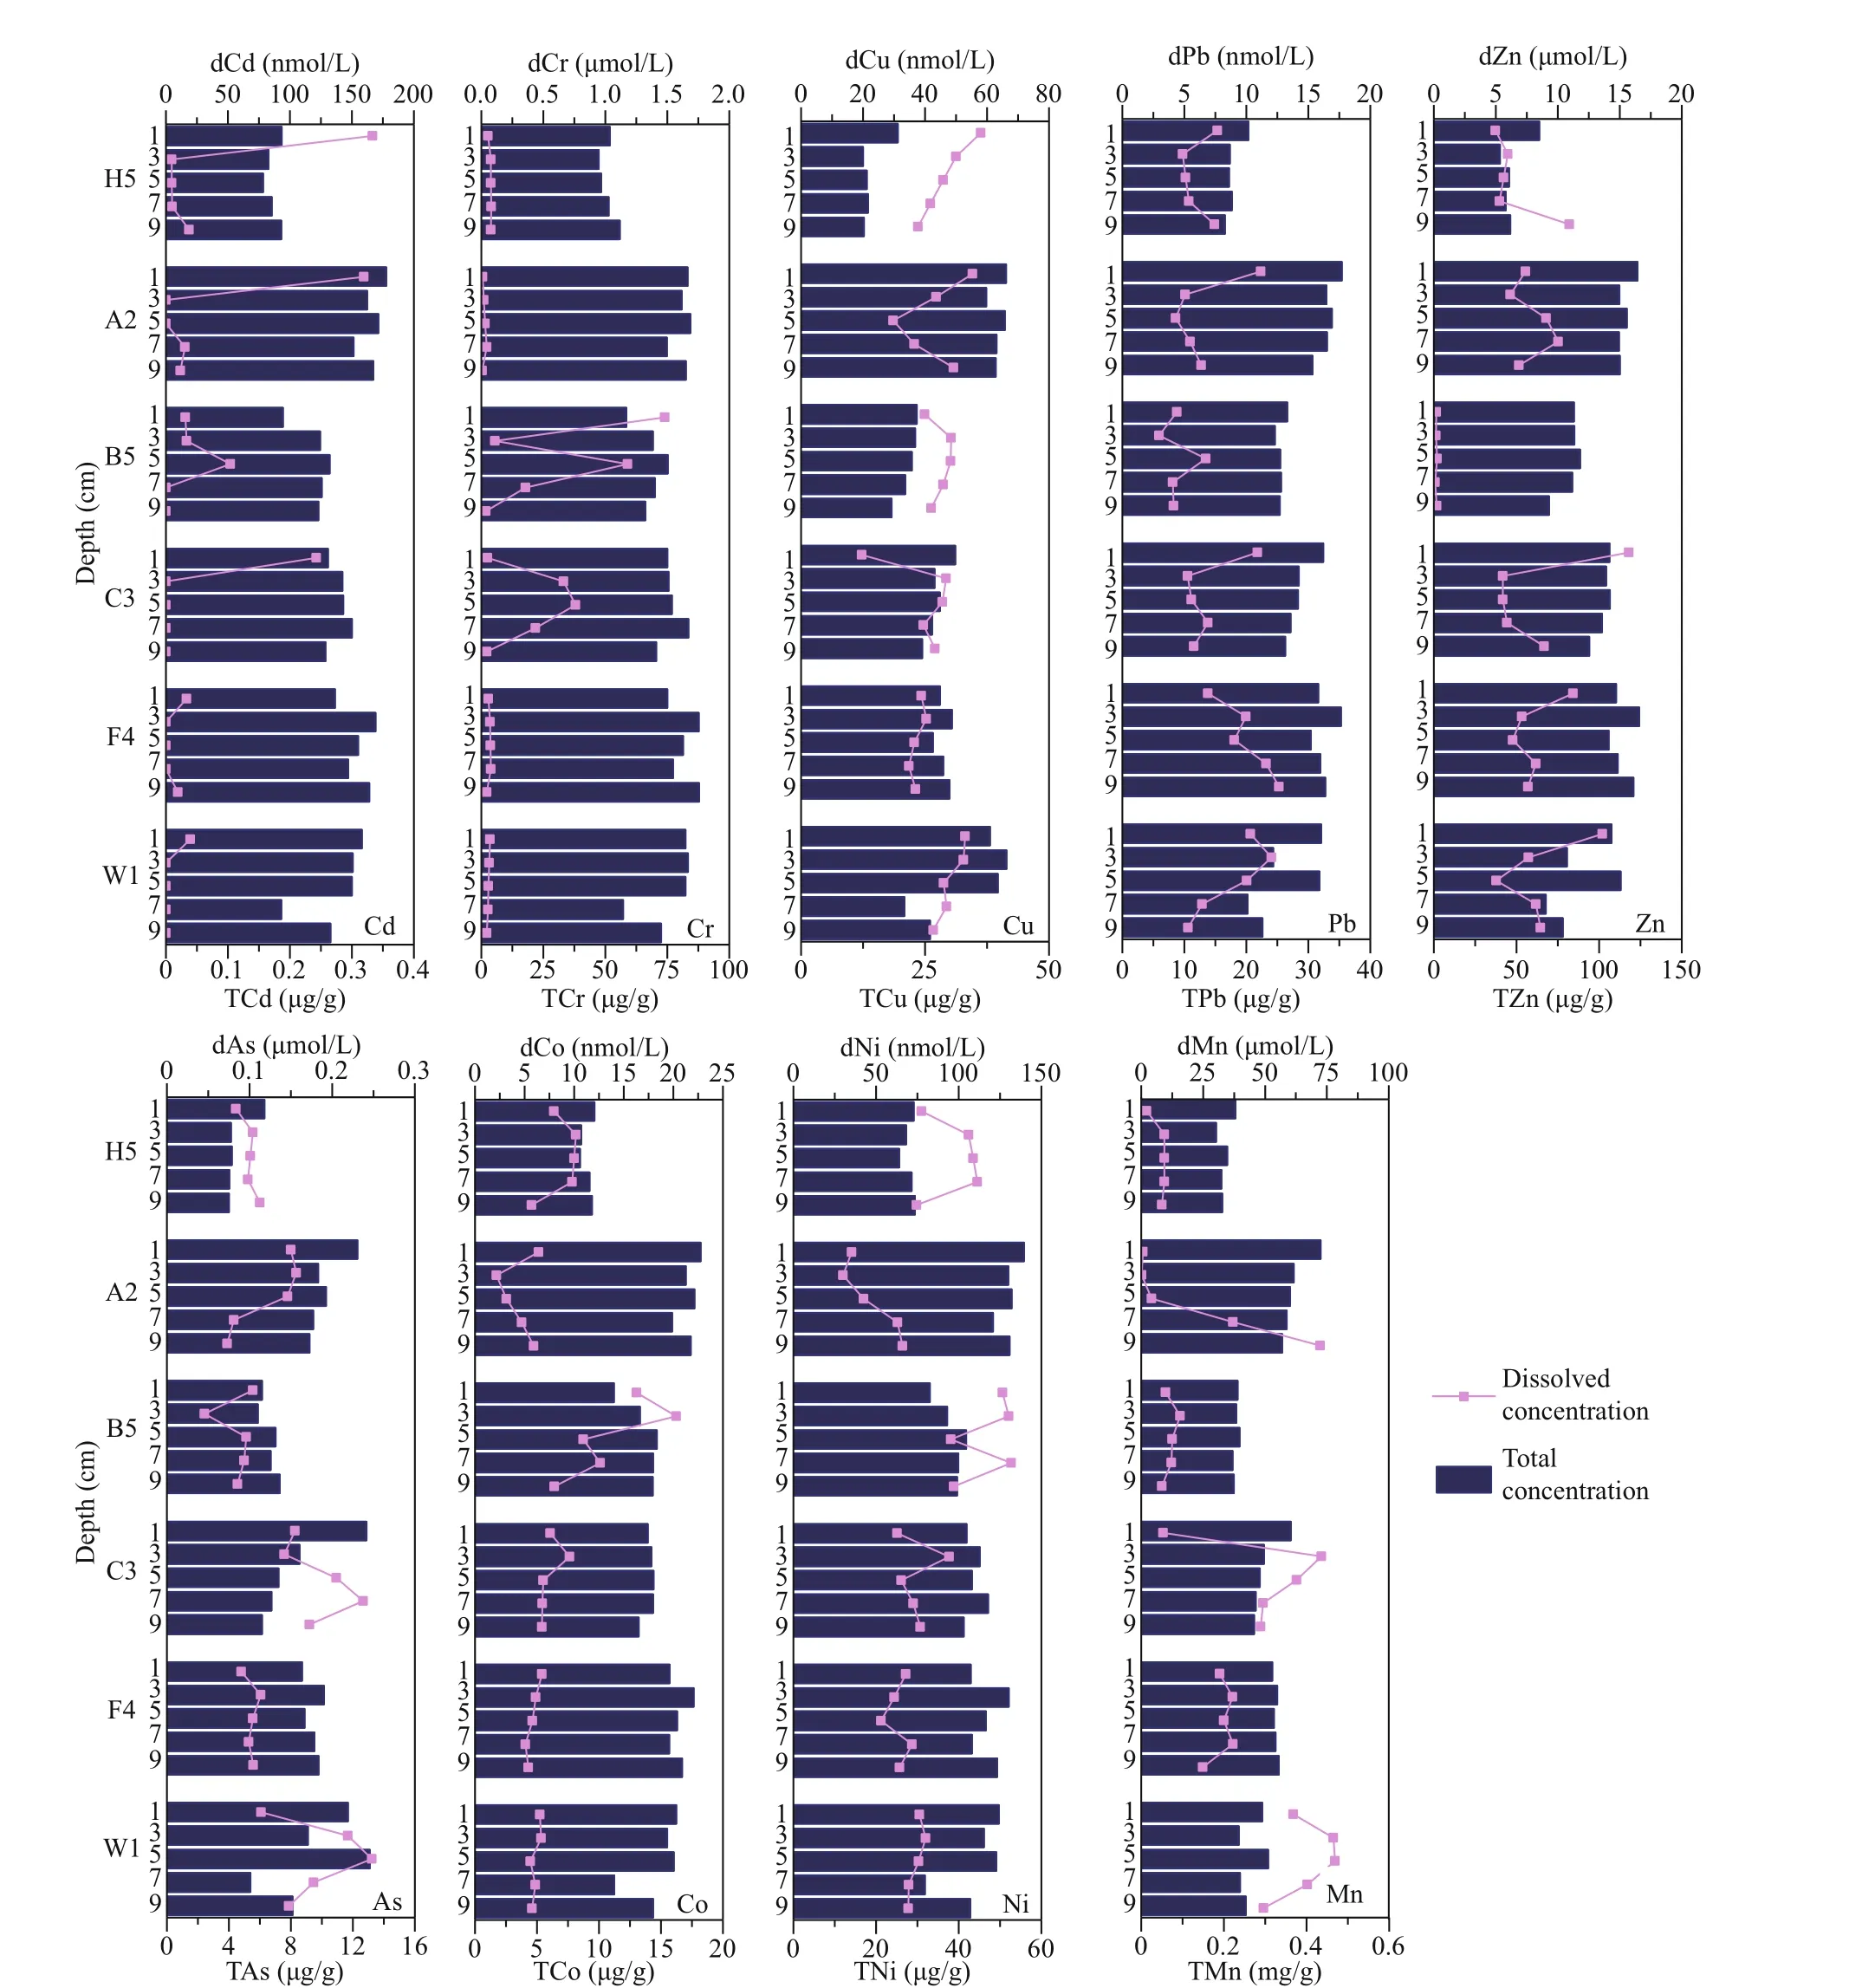
Fig.5 Variability of dissolved metals (dCd, dCr, dCu, dPb, dZn, dCo, dNi, dAs) in porewater and total metals (TCd, TCr,TCu, TPb, TZn, TCo, TNi, TAs; sum of the four fractionations) in sediment in ECS and YS
3.3 Distribution of heavy metals
Vertical distributions of Cd, Cr, Cu, Pb, Zn, As, Co,Ni, and Mn in the porewater at diff erent stations are depicted in Fig.5. Cd concentrations were about 1 nmol/L in the uppermost porewater samples, and close to the detection limit with the increase of depth.The maximum Cr value was 0.078 μmol/L found in a sample at H5. There were no significant diff erences of mean content of Cu in the study area (0.039-0.048 μmol/L). High values of Co and Ni were mainly concentrated at B5 and H5, while low values mainly appeared at A2. Co and Ni were significantly correlated (R=0.87,P<0.01), indicating that they hadconsistent removal routes and sources. High values of Zn and Pb distributed at A2 while low values of them at H5 and B5. Zn concentrations were relatively higher compared with those of other heavy metals.Though Zn and Pb concentrations varied greatly, a significant positive correlation (R=0.50,P<0.01) was found between them and their lowest values appeared at station B5. Meanwhile, Co and Ni had significant negative correlations with Zn and Pb in porewater samples (R=0.62,P<0.01 for Co and Zn;R=0.42,P<0.01 for Co and Pb;R=0.61,P<0.01 for Ni and Zn;R=0.46,P<0.01 for Ni and Zn), which is similar to a study in North Sea where Cd concentrations were very low in porewater (van de Velde et al., 2017). The contents of As were higher at C3 and W1. The Mn depth profiles of porewater varied greatly at diff erent stations.
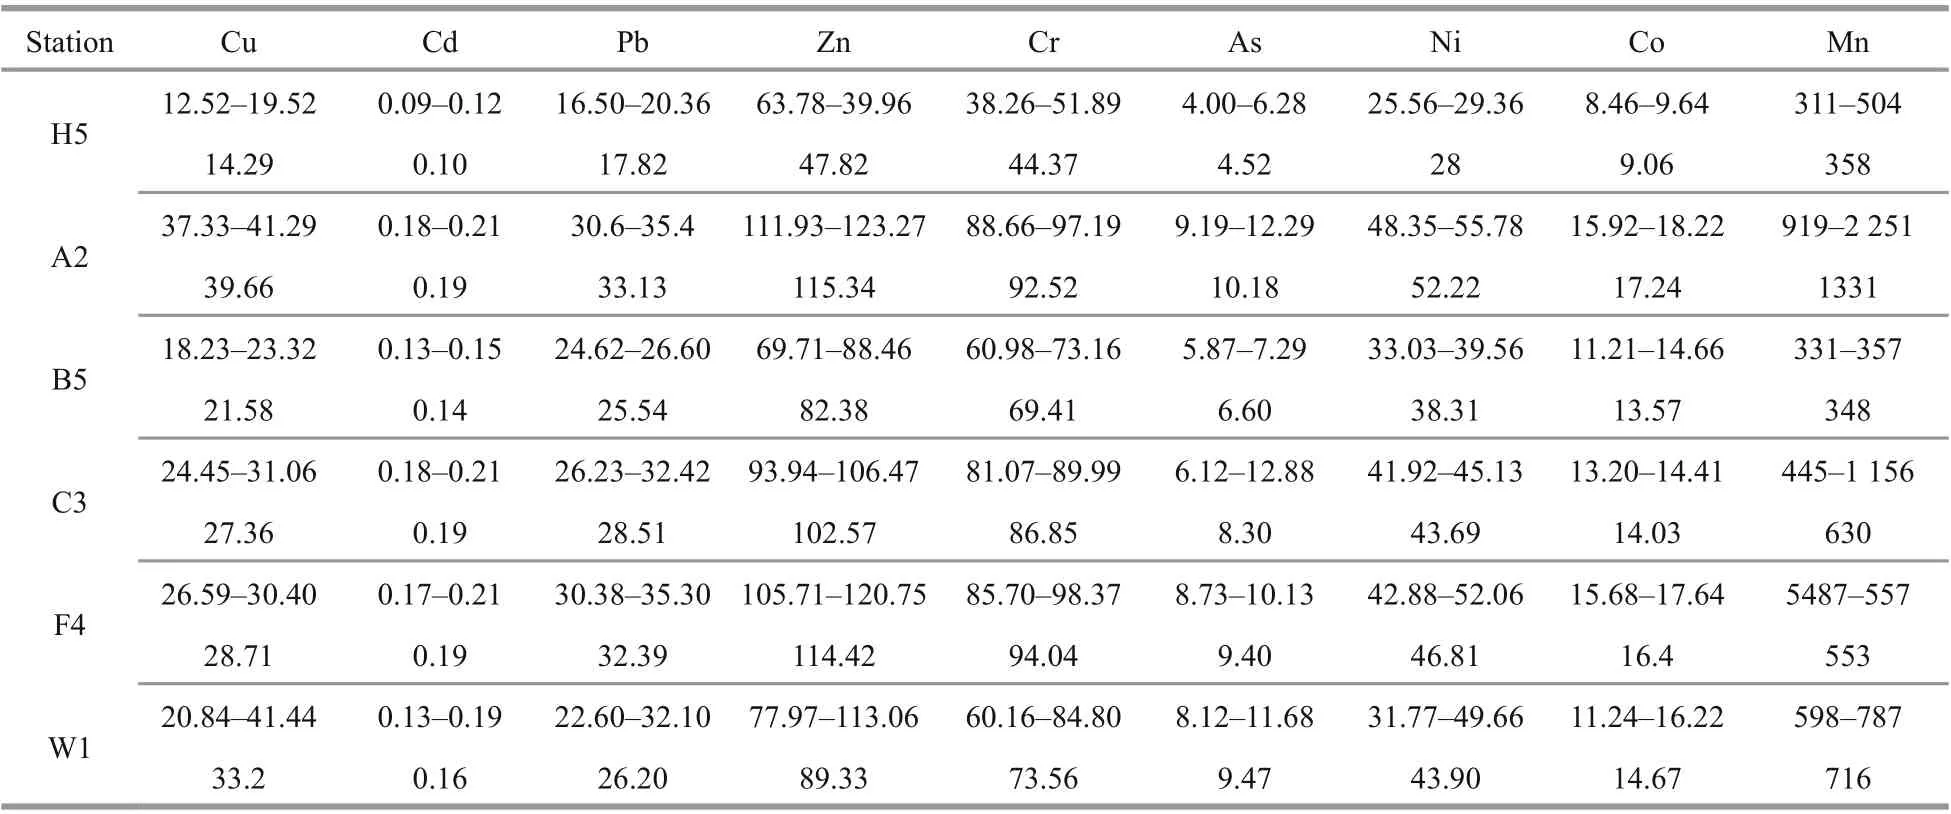
Table 3 Summarized heavy metal concentrations in sampled sediments (unit: mg/kg)
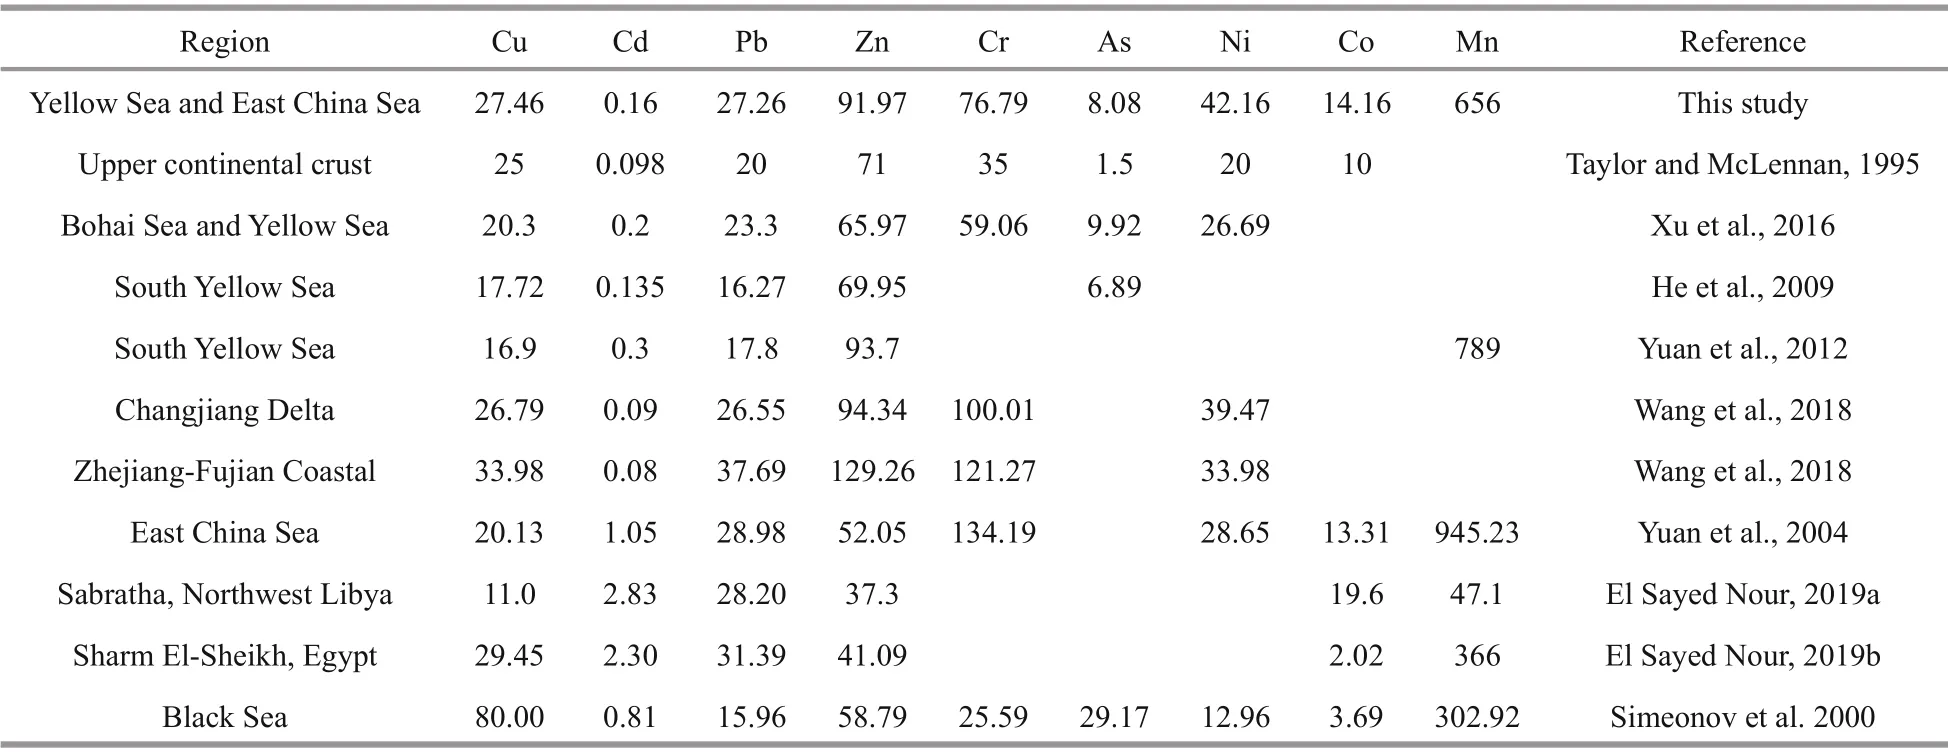
Table 4 Average reported upper continental crust values and relative values for surface sediments from other locations(unit: mg/kg)
Total concentrations of metals within 10 cm are shown in Fig.5. Low values of total Mn were mainly at B5 and H5, while the maximum Mn concentration occurred in the uppermost layer at B5. This Mn distribution trend in sediment was consistent with that in porewater. Average heavy metal concentrations in sediments were in a decreasing order of Zn>Cr>Ni>Cu>Pb>Co>As>Cd (Table 3). This trend is also consistent with results from studies in the Bohai Sea in which the mean Cd concentrations were the lowest and Zn concentrations were the highest (Gao and Chen, 2012). Overall, the ranges and mean metal concentrations we obtained in the study region were close to the values obtained by other studies (Table 4).The average concentrations of all heavy metals in the study area were higher than those of the upper continental crust. Compared with the investigation about heavy metals from the Black Sea, the mean concentrations of Cu, Cd, and As in our study were significantly low, while other metals were high.Moreover, Zn and Mn contents in sediment of YS and ECS were relatively high compared with some coast of the Africa in Libya and Egypt.
4 DISCUSSION
4.1 Metal fractionation
Diff erent chemical speciation of heavy metals was closely associated with their mobility and biological toxicity (Jia et al., 2018). Metal fractionation in the investigated area was shown in Fig.6. Residual fraction occupied the highest proportion, generally more than 75% except Mn. This result is consistent with previous research of the Bohai Sea that Cr, Ni,Pb, Zn, and Cu were preferentially bound to the residual phase (Li and Jing, 2015). Average percentages of acid soluble Cd, Co, Ni, Cr, Cu, Zn,As, and Pb were accounts for merely 1.57%, 6.4%,3.3%, 0.9%, 4.1%, 3.2%, 3.2%, and 4.5% respectively.Moreover, the acid soluble fraction was generally considered the weakest bonded metals with most mobility and potential toxicity (Gao and Chen, 2012).Therefore, the low percentages of acid soluble metals indicated low mobility and environmental toxicity in the ECS and YS. Meanwhile, significant negative correlations were found between some acid soluble metals in solid and their concentrations in porewater(R=-0.95,P<0.05 for Mn in H5;R=-0.98,P<0.05 for Zn in A2). This further indicated that acid soluble fraction was important in metal reciprocal transformation between solid phase and water phase.For Cd, Cu, Zn, As, and Pb, the reducible group percentages (2.3% for Cd, 16.0% for Cu, 6.3% for Zn,17.3% for As, 15.8% for Pb) were generally higher than the acid soluble and oxidizable groups. This may be due to reducible Fe-Mn minerals that have a strong ability to absorb these metals (Jain and Loeppert,2000; Trivedi and Axe, 2000). When these heavy metals enter the sediment, they would be adsorbed onto iron and manganese (oxyhydr)oxides (Stockdale et al., 2010). In deeper layers, these heavy metals would be released into the porewater when (oxyhydr)oxides were reduced by organic matter (van de Velde et al., 2016). For Cr, Co, and Ni, the oxidable fraction was the main non-residual speciation, and the ratio accounted for 3.7%, 10.1%, 9.2%, respectively. This reflected high affi nity of sulfide and organic matter to these metals (Huerta-Diaz et al., 1998). In addition,oxidable fraction mainly include two types, organicbind metals and sulfide-bind metals, and there were spatial diff erences in the main components of oxidizable fraction of diff erent metals. In the study area, significant positive correlations between oxidable fraction of Pb, Mn, and TOC were found in YS sediments. Meanwhile, significant positive correlation between oxidable fraction of Cd and TOC was also found in ECS sediments. The significant correlations between TOC and metals above revealed that organic-bind might be the primary form of the oxidable fraction of Pb and Mn in YS and Cd in ECS,while other metals might be reserved mainly via sulfide-bind (Chen et al., 2020).
4.2 Metals in solid and their environmental eff ect and source
Five popular methods were used to assess sediment metals pollution and potential ecologic risk (Table 5).Iplcan directly reflect the contribution degree of each heavy metal to pollution which calculated by the contamination factor (Fi) (Tomlinson et al., 1980). In this study, theIplvalue was 1.00 in A2 and less than 1 in other stations. It meant that no metals pollution was found in most region, while moderate pollution in A2.Igeois a quantitative index to study heavy metals pollution and is widely used to assess heavy metals pollution in sediments. After calculated, mostIgeovalues were less than 0 except Pb in F4 and Mn in A2,indicated that no pollution in most areas and slightly Pb pollution in F4 and Mn pollution in A2.Eriwas also used to assess potential metals ecological risk, which was established by Swedish scholar Hakanson (1980)by applying the principle of sedimentology. According the criterion, Cu, Pb, Cr, and Zn were without ecological risk in study areas (Eri<40), moderate potential ecologic risk (40<Eri<80) with Cd in H5, B5, and W1, and severe potential ecologic risk (80<Eri<120) in other stations. In addition, considering that heavy metals in sediments are always present in the form of complex mixtures, we used the mean ERM quotient method to determine the possible biological eff ects of combined toxicant groups. The calculated mean ERM quotients in this study were 0.14, 0.29, 0.21, 0.24, 0.26, and 0.24 in order from north to south, suggesting that the combination of heavy metals had a 21% possibility of being toxic (0.11<ERM<0.5) in the ECS and YS. The enrichment factor has been widely used to assess the influence of anthropogenic activities on sediment heavy metal contamination (Çevik et al., 2009; Kaushik et al., 2009). As shown in Table 5, Cu, Cd, Pb, Zn, Co,Ni, Mn, and Cr exhibited minor enrichment (1<EF<3)in most sampls, while As exhibited moderately severe enrichment in the study region during summer.Although the range and mean concentrations of As were normal, the As enrichment was still striking,especially at station W1 (EF=7.51), which was located in China’s largest fishing ground of Zhoushan Archipelago. In general, the heavy metals pollution conditions in H5, B5, and W1 was mildly better than that in A2, C3, and F4. The concentration of Pb in F4,Mn in A2, Cd in A2, C3, F4, and As in all station have risen above environmental evaluation criteria.Therefore, we should control the inflow of these metals into the sea and decrease the ecological risk.
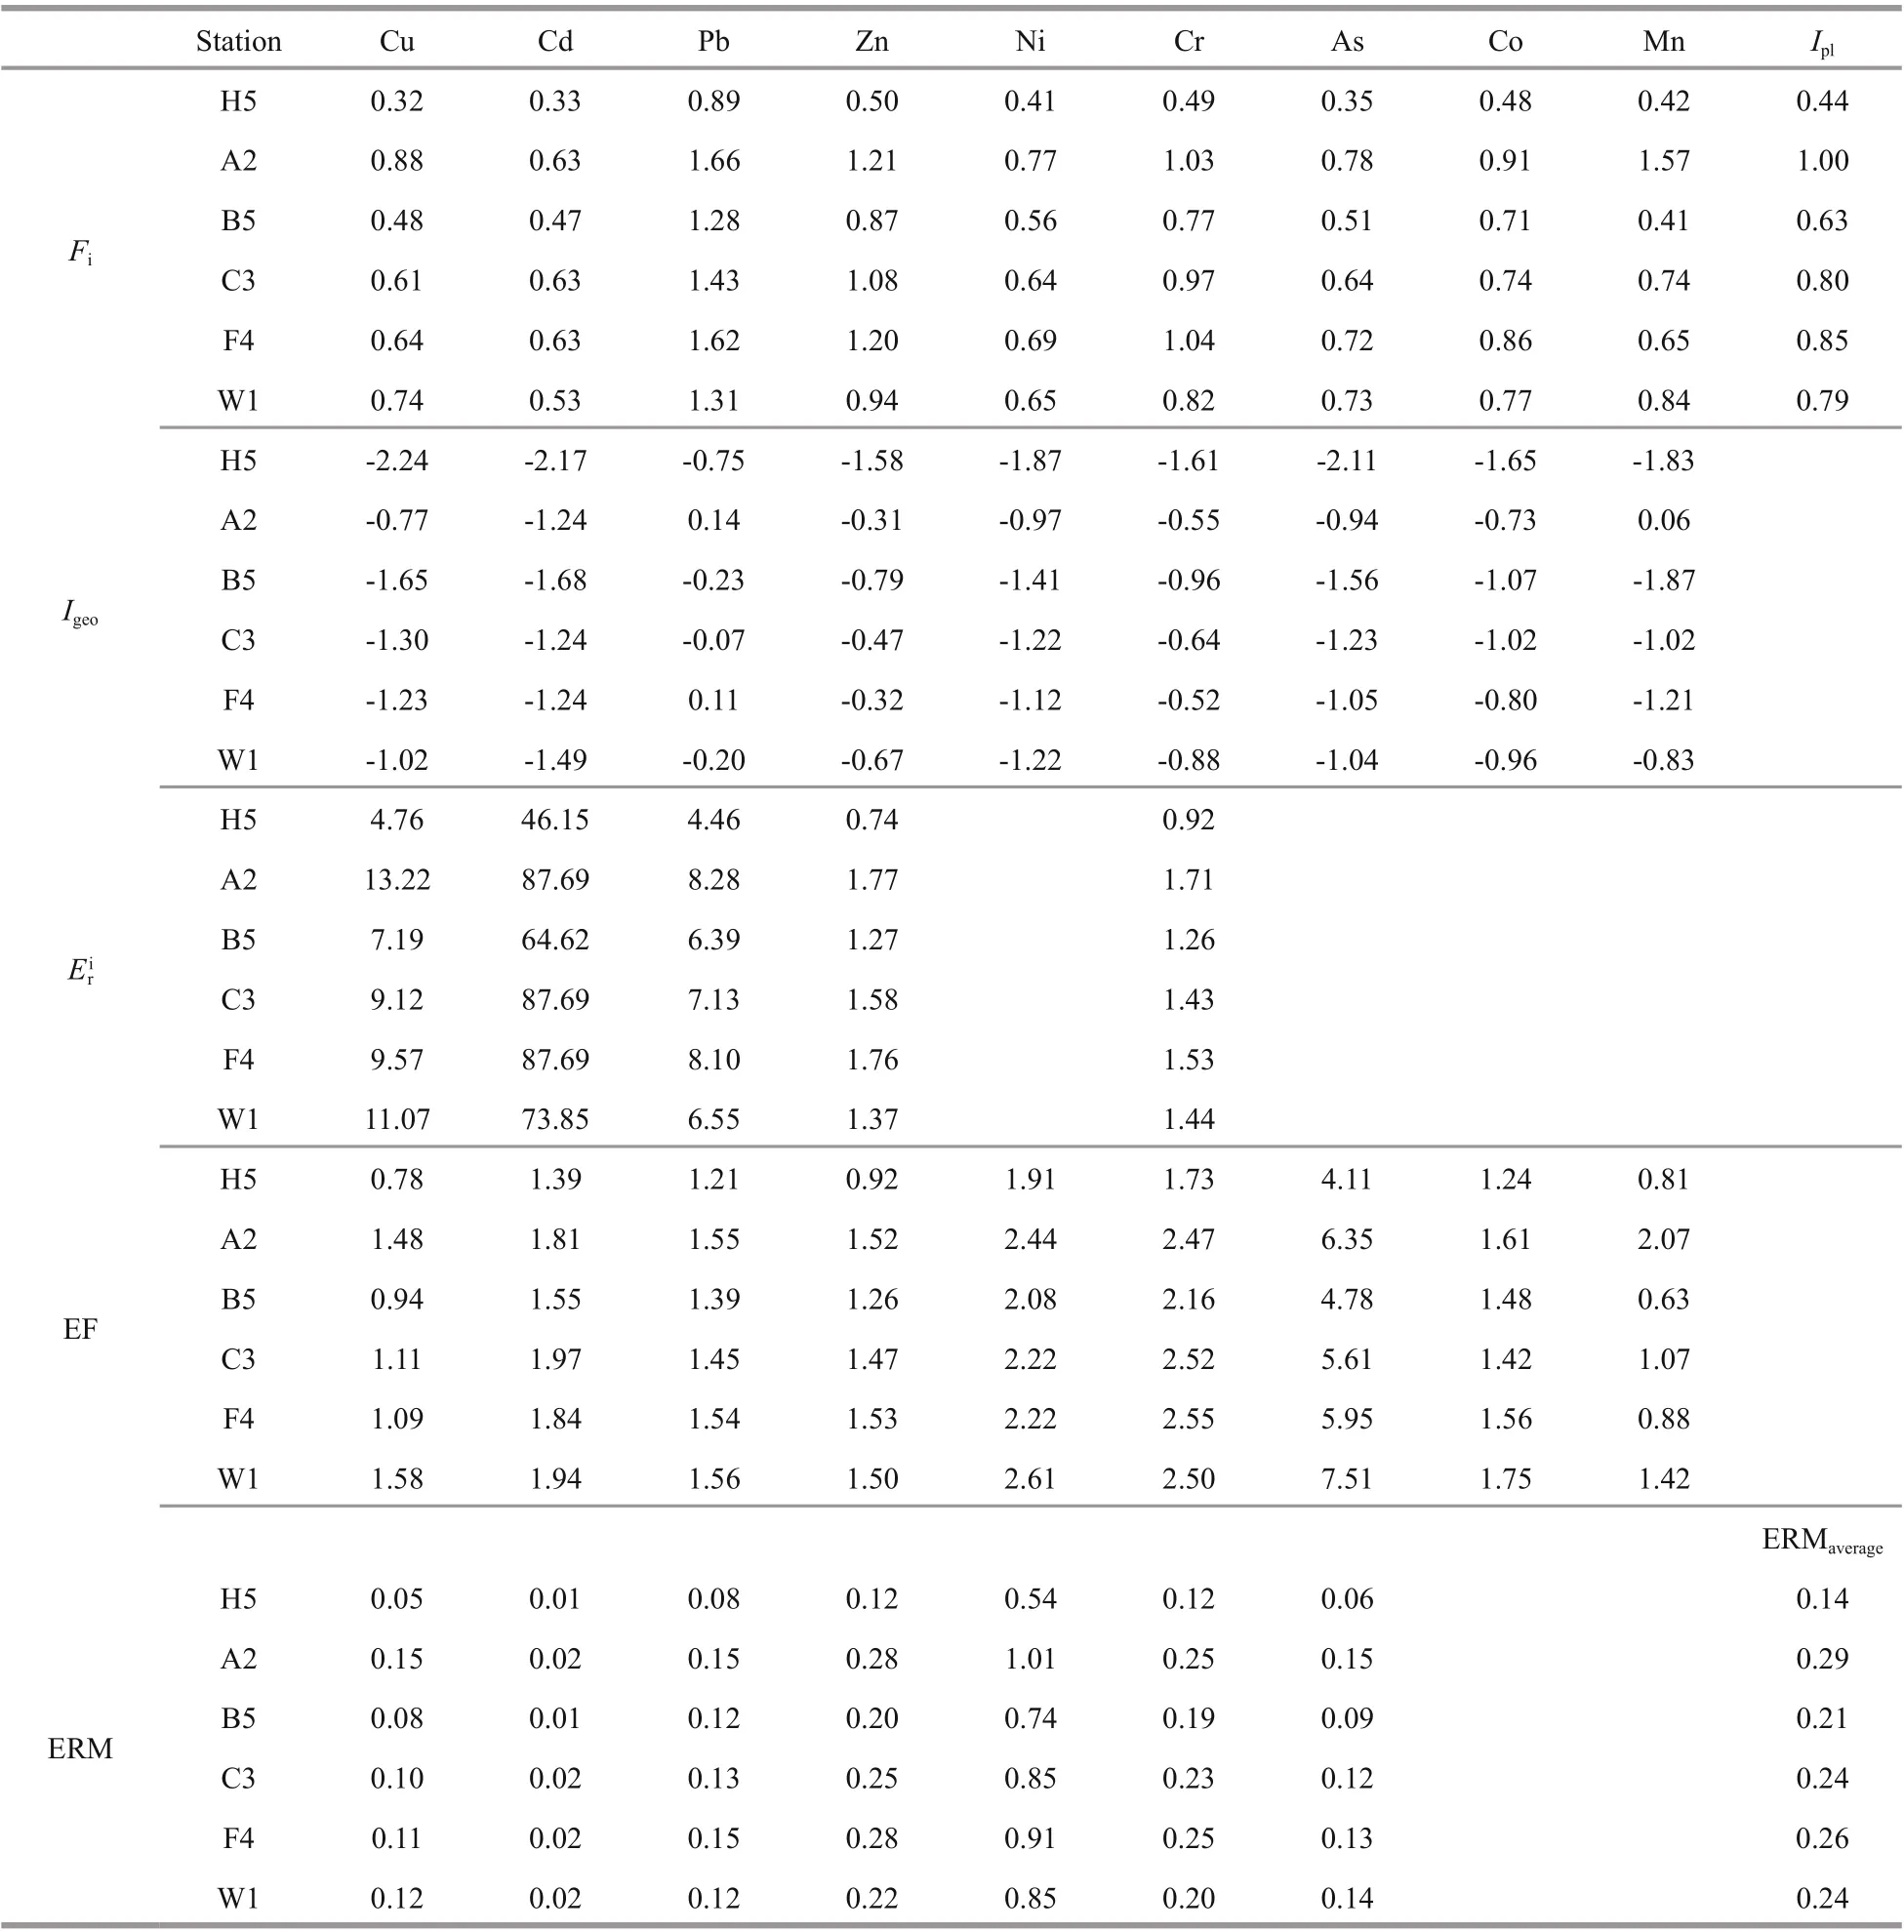
Table 5 Assessment indicators for sediment metal pollution and ecological eff ects in study area
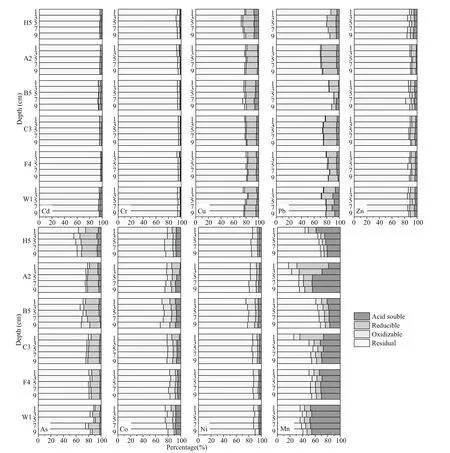
Fig.6 Diff erent groups of heavy metals in ECS and YS sediments during summer
The potential relationship between heavy metals and their source issues can be revealed by correlation analyses and Principal Components Analysis (PCA)of TN, TOC, and metals (Figs.7 & 8). All results indicate that there was a significant positive correlation between diff erent heavy metals, indicating they had similar biogeochemical processes. The plot drawn with the scores of the first two principal components can be used for classifying metals. The first principal components (PC1) had very high positive loadings of all elements, which accounts for 81.6% of variance and showed an intense intrinsic connection between all studied parameters. Our result show TOC was correlated with composition of clay. Thus, the distribution of these metals was related with the natural weathering (Song et al., 2017). Principle component 2(PC2=8.8%) classified metals into two categories,including a positive loading of Mn, Cu, and TOC, and a high negative loading of Cr, Zn, Pb, and Al. Cr, Zn,Pb, as well as Al, are more likely originated from sediment release. Given the EF results of As, the study area is generally enriched by As. Therefore, PC2 can be considered as an anthropogenic (Zhao et al., 2020).
4.3 Influence of H 2 S on distribution of heavy metals
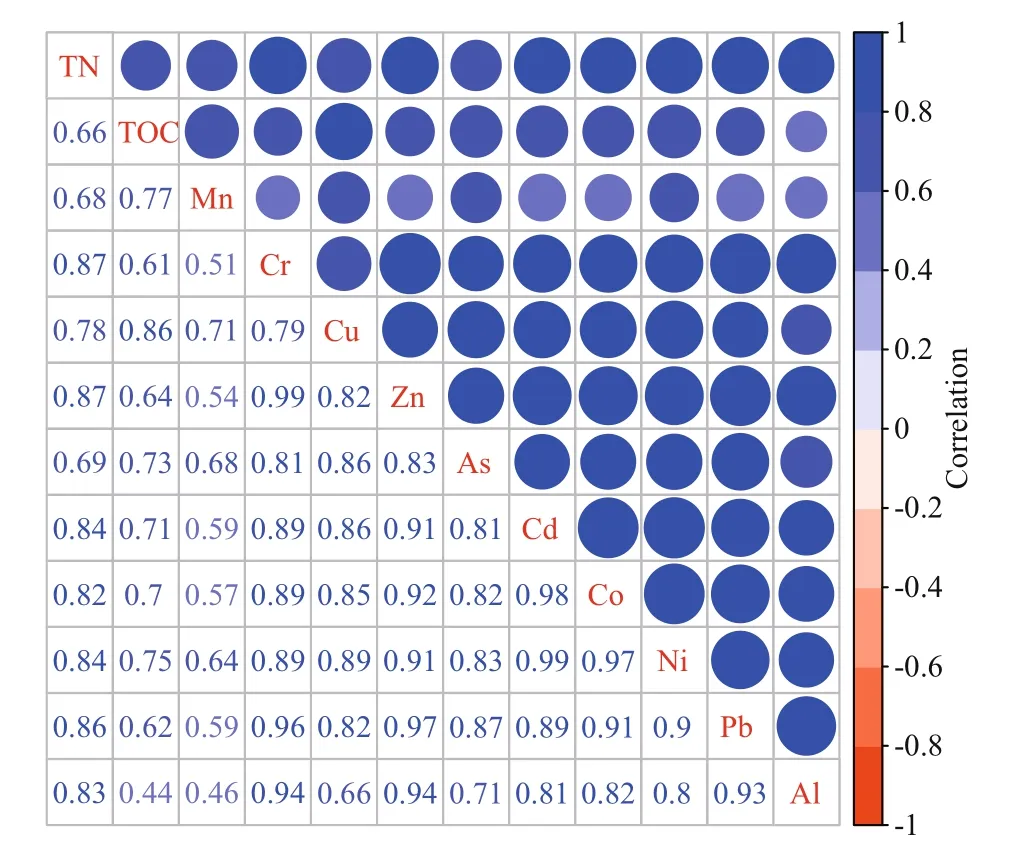
Fig.7 Correlation analyses between total nitrogen (TN),total organic carbon (TOC), and heavy metals in sediments of YS and ECS
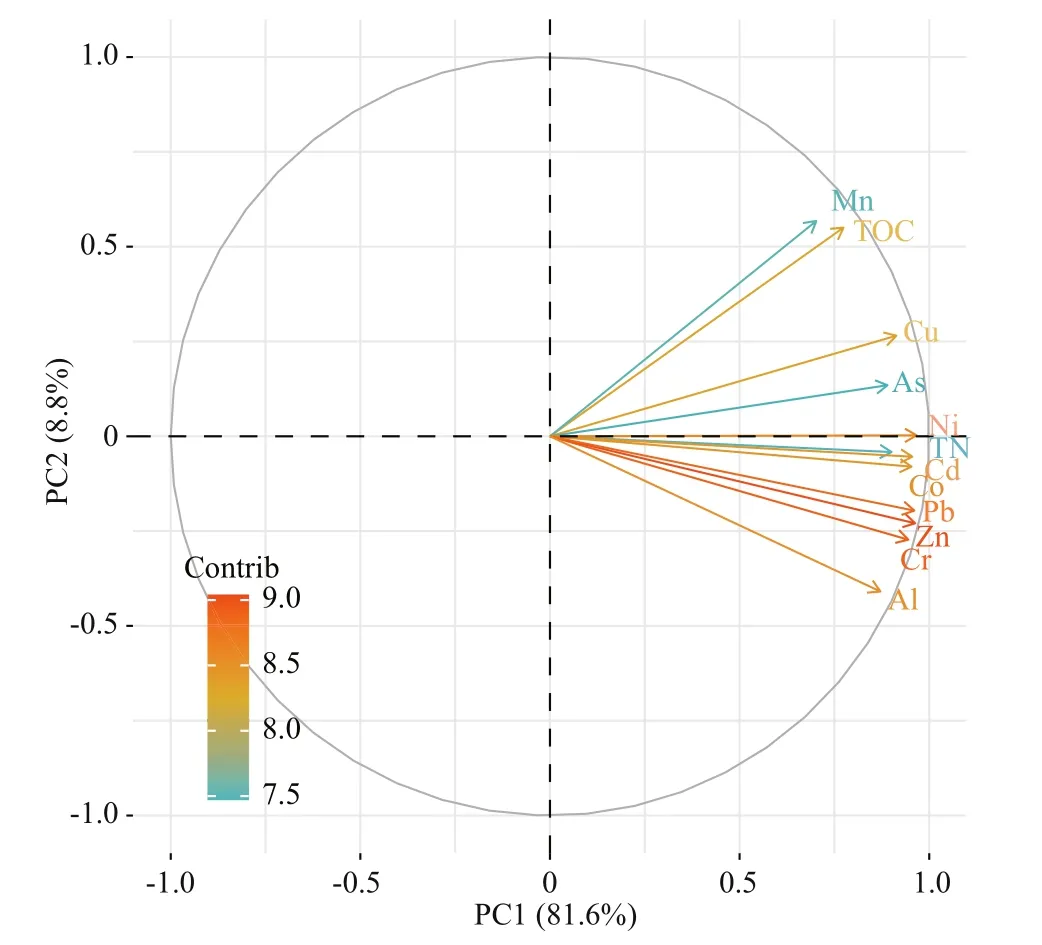
Fig.8 Component plot of total nitrogen (TN), total organic carbon (TOC), and heavy metals in sediments of YS and ECS
Numerous investigations have considered sulfide as an indicator for the assessment of heavy metals pollution in the aquatic environment, and sulfate reduction was of critical importance to control the levels of metals (Chen et al., 2020). Thus, it was needed to explore the influenced of H2S to metals behavior in porewater. In Fig.6, there were obvious reduction in all stations at 3-5 cm depth of Pb and Zn,suggesting that H2S can react with them rapidly and this result is consistent with Morse and Luther III(1999)’s finding about the kinetic and thermodynamic mechanisms of metal-sulfide interactions in porewater.Cu is liable to proceed oxidation-reduction reaction and bond with sulfide, resulting in the decrease of Cu content in 3-5-cm depth, where the H2SMAXoccur. In addition, because of the low concentration of Cd,there was no obvious distribution trend and no obvious relationship was found between Cd and H2S in this study. As for Co, Ni, Cr, As, and Mn, these metals cannot react with H2S easily and quickly,hence these three metals had no corresponding distribution trends with H2S (Morse and Luther III,1999).
In solid phase, the low values of total metal concentrations appeared in H5 and B5, where H2S were relatively higher compared with other stations(Figs.4 & 5). Meanwhile, significantly negatively correlations between H2SMAXand total heavy metal concentrations were found in this study (R=-0.97,P<0.01 for Cr;R=-0.93,P<0.01 for Co;R=-0.96,P<0.01 for Ni;R=-0.97,P<0.05 for Zn;R=-0.95,P<0.01 for As;R=-0.98,P<0.01 for Cd;R=-0.93,P<0.01 for Pb). This may be explained by the relatively strong reduction environments at H5 and B5, which could be resulted in the reduction and dissolution of oxidized heavy metals. The dissolved heavy metals either migrated upward to the surface of sediments and precipitated after re-oxidation, or migrated downward to form insoluble substances under reduction conditions and accumulated back into the deeper layers (Barbanti et al., 1995). In addition, the H2SMAXwas also negatively correlated with acid soluble Cu (R=-0.96,P<0.05), Zn (R=-0.90,P<0.05), reducible As (R=-0.84,P<0.05), Zn (R=-0.93,P<0.01), oxidizable Pb (R=-0.82,P<0.05), As(R=-0.96,P<0.05), and residual Cu (R=-0.88,P<0.05), As (R=-0.90,P<0.05). This indicated that acid soluble Cu and Zn, reducible As, Zn, as well as oxidizable Pb and As, were greatly influenced by H2S.
In addition, the diff erence between metals extracted simultaneously (SEM) and AVS was generally used to indicate the toxic eff ects of heavy metals on aquatic organisms and sediment quality in previous studies(Hinkey and Zaidi, 2007; Zhuang and Gao, 2014).However, it needs to take a long time and variety of reagents for the measurement of AVS and SEM currently. In this study, a significant negative correlation was found between H2S and mean ERM quotients as shown in Fig.9, indicating that H2S can also accurately reflect the potential biological eff ects of combined toxicant groups in sediments. Therefore,we could use H2S to assess potential biological toxicity risk of metals. According to the formula obtained via the relationship between H2S and ERM,when H2S>7.1 μmol/L, ERM<0.1, sediments will only have a 9% likelihood of being toxic. Compared with AVS, the determination of H2S is simple and fast.Therefore, we suggest using the H2S content for the prejudgment of bio-toxic of heavy metals in sediments.
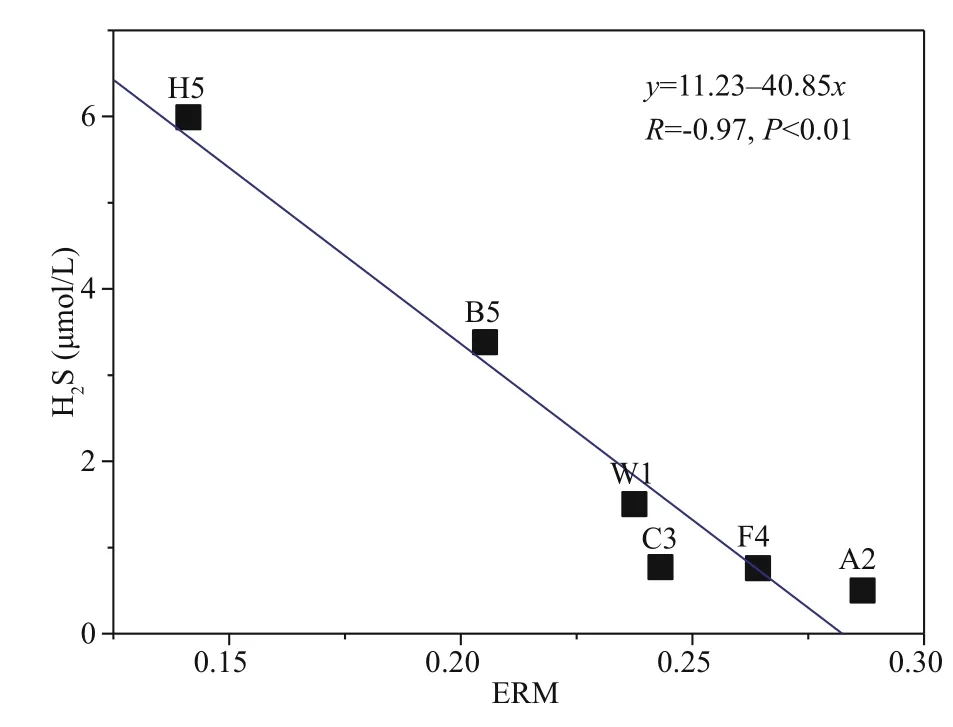
Fig.9 Relationship between H 2 SMAX and mean ERMquotients in ECS and YS sediments during summer
5 SUMMARY AND CONCLUSION
In this study, profiles of H2S, SO42ˉ, DOC, TOC, TN along with fractions of Mn, Cd, Pb, Cr, Zn, As, Co,Cu, and Ni in ECS and YS sediments were collected and measured. Sulfate reduction mainly occurred in the North Yellow Sea and the west coast of South Korea sediments within 10 cm. H2S emerged gradually with the increase in depth and usually reached a maximum at around 3-5 cm. H2S was aff ected by DOC concentrations and sediment type. Sediment heavy metal concentrations were ranked in decreasing order of Mn>Zn>Cr>Ni>Cu>Pb>Co>As>Cd in the ECS and YS. Oxidizable Cr, Co, and Ni were the main non-residual component while reducible Cd,Cu, Zn, As, and Pb were the main non-residual component. For Mn, a considerable proportion was found among all four groups, while the residual group was dominated by other heavy metals at the sampling stations. Meanwhile, metals not only were aff ected by TOC (Mn, Pb, and Cd) and controlled by anthropogenic sources (Al, Cr, Zn, and Pb), but also respond to sulfide (Cd, Co, Pb, As, and Cu), and significantly negative correlations between H2S and total heavy metal concentrations were found in sediments within 10 cm. Our results suggest that heavy metals content in Southeastern coast of Shandong Peninsula were high (especially Mn and Cd), the control of metals emission from related industries needs to be strengthened in coastal areas. W1 station in ECS is an important fisheries area, so the hypoxia and As enrichment should call greater attention to the Fujian-Zhejiang coastal region during summer. In addition,the combination of heavy metals in this study could have a 21% possibility of being toxic and a significant negative correlation was found between H2SMAXand the mean ERM quotients, thus we suggest that H2S can be considered as an indicator for pre-estimating the potential ecological risk of heavy metals in sediments.
6 DATA AVAILABILITY STATEMENT
All data generated and/or analyzed during this study are included in this published article.
7 ACKNOWLEDGMENT
We are thankful to the captain and crew of the R/VDong f anghong2for their help and cooperation during the expedition and in situ investigation.
 Journal of Oceanology and Limnology2021年4期
- Journal of Oceanology and Limnology的其它文章
- Numerical study of the seasonal salinity budget of the upper ocean in the Bay of Bengal in 2014*
- Study on evaluation standard of uncertainty of design wave height calculation model*
- A fast, edge-preserving, distance-regularized model with bilateral filtering for oil spill segmentation of SAR images*
- A Gaussian process regression-based sea surface temperature interpolation algorithm*
- Climatology and seasonal variability of satellite-derived chlorophyll a around the Shandong Peninsula*
- Sources of sediment in tidal flats off Zhejiang coast, southeast China*
