Development of a 50K SNP Array for Japanese Flounder and Its Application in Genomic Selection for Disease Resistance
Qin Zhou,Y-dong Chen,Sheng Lu,Yng Liu,Wen-teng Xu,b,Yng-zhen Li,Lei Wng,N Wng,b,Ying-ming Yng,Song-lin Chen,b,*
a Key Laboratory for Sustainable Development of Marine Fisheries,Ministry of Agriculture,Yellow Sea Fisheries Research Institute,Chinese Academy of Fishery Sciences,Qingdao 266071,China
b Laboratory for Marine Fisheries Science and Food Production Processes,Pilot National Laboratory for Marine Science and Technology(Qingdao),Qingdao 266373,China
Keywords:
ABSTRACT Single nucleotide polymorphism(SNP)arrays are a powerful genotyping tool used in genetic research and genomic breeding programs.Japanese flounder(Paralichthys olivaceus)is an economically-important aquaculture flatfish in many countries.However,the lack of high-efficient genotyping tools has impeded the genomic breeding programs for Japanese flounder.We developed a 50K Japanese flounder SNP array,‘‘Yuxin No.1,”and report its utility in genomic selection(GS)for disease resistance to bacterial pathogens.We screened more than 42.2 million SNPs from the whole-genome resequencing data of 1099 individuals and selected 48 697 SNPs that were evenly distributed across the genome to anchor the array with Affymetrix Axiom genotyping technology.Evaluation of the array performance with 168 fish showed that 74.7%of the loci were successfully genotyped with high call rates(>98%)and that the polymorphic SNPs had good cluster separations.More than 85% of the SNPs were concordant with SNPs obtained from the whole-genome resequencing data.To validate‘‘Yuxin No.1”for GS,the arrayed genotyping data of 27 individuals from a candidate population and 931 individuals from a reference population were used to calculate the genomic estimated breeding values(GEBVs)for disease resistance to Edwardsiella tarda.There was a 21.2%relative increase in the accuracy of GEBV using the weighted genomic best linear unbiased prediction(wGBLUP),compared to traditional pedigree-based best linear unbiased prediction(ABLUP),suggesting good performance of the‘‘Yuxin No.1”SNP array for GS.In summary,we developed the‘‘Yuxin No.1”50K SNP array,which provides a useful platform for high-quality genotyping that may be beneficial to the genomic selective breeding of Japanese flounder.
1.Introduction
Single nucleotide polymorphism(SNP)arrays are a high-quality and convenient genotyping platform.With a SNP array,tens of thousands of SNPs per sample can be simultaneously detected,allowing high-throughput and high-efficiency for genetic research and breeding programs.SNP arrays have been successfully used for germplasm characterization,complex trait dissection,markerassisted selection(MAS),and genomic selection(GS)in several economic species.GS uses genetic markers spanning the entire genome to predict the genomic estimated breeding value(GEBV);animals with high GEBVs are selected for breeding[1].The application of GS in breeding programs has been very successful.For example,in most countries,dairy breeding programs rely on GS with commercial cattle SNP arrays[2,3].
During the past six years,whole-genome sequencing projects for more than 20 fish species in China have been completed[4].The availability of whole-genome sequences for numerous cultured fishes has promoted the development of GS programs and SNP arrays.More recently,several SNP arrays have been developed for aquaculture species,such as Atlantic salmon(Salmo salar)[5,6],common carp(Cyprinus carpio)[7],rainbow trout(Oncorhynchus mykiss)[8],and catfish(Ictalurus punctatus and Ictalurus furcatus)[9].However,to our knowledge,there are no available SNP arrays for any flatfish species or disease-resistance selection in fish.Japanese flounder,Paralichthys olivaceus,is an important aquaculture species in many countries,including China,Republic of Korea,and Japan.Selective breeding for Japanese flounder began in the early 1970s in Japan and in the 1990s in China.However,the sustainability of Japanese flounder aquaculture has faced multiple challenges,such as germplasm degradation,frequent infectious diseases,and a lack of superior breeding strains.Therefore,advanced genomic breeding programs are urgently needed to develop high-quality strains to optimize production and culture management.Several prior studies have attempted to facilitate the selective breeding and aquaculture of Japanese flounder.For example,a microsatellite marker for lymphocystis disease resistance has been reported(Poli9-8TUF)and used for MAS[10],and quantitative trait loci(QTLs)of Vibrio anguillarum disease resistance were identified with a SNP genetic linkage map[11].These results have improved our understanding of the genetic architecture for disease resistance.However,the small number of markers limits the ability of selective breeding programs.GS,selection based on genome-wide SNPs,is urgently needed for disease resistance(a complex trait controlled by several loci)[12,13].
We used next-generation sequencing(NGS)technology to complete the whole-genome sequencing and assembly of the Japanese flounder[14].We also accomplished the GS to bacterial disease resistance based on large-scale genome re-sequencing data[15].Here,we designed,characterized,and validated a 50K SNP array‘‘Yuxin No.1”for Japanese flounder.We used genome resequencing data from 1099 individuals to select high-quality and informative SNPs for the array and validated their genotyping performance.We also obtained good segregation of the population structure and high accuracy of the GEBV estimation when applying the‘‘Yuxin No.1”for GS of bacterial-resistance.These results demonstrate the potential of this array in genomic breeding programs for high disease resistance,as well as other economicallyimportant traits.The SNP array is publicly available to any interested parties.
2.Material and methods
2.1.SNP identification
The SNPs used for the SNP array were from whole-genome resequencing data of 1099 Japanese flounders,including 931 individuals reported by Liu et al.[15]and 168 individuals sequenced in this study(NCBI SRA accession No.SRP253464).Briefly,genomic DNA was extracted from fin tissues and then subjected to Illumina pair-ended sequencing library construction according to the standard protocol(Illumina,USA).Raw reads were produced on the Illumina HiSeq 2000 sequencing platform and quality filtered with quality control(QC)-Chain[16]to remove the low-quality reads,adaptor sequences,and ambiguous nucleotides(Ns).The resultant clean reads were aligned to the Japanese flounder reference genome(NCBI accession No.GCA_001904815.2)with Burrows–Wheeler aligner[17].SNP calling was performed with the Genome Analysis Toolkit(GATK),using default parameters[18],and the putative SNPs were identified by minimal mapping quality values of 20,SNP quality scores of 20,and read base qualities of 30.
2.2.SNP selection
The initial SNP set was filtered with multiple steps and parameters.First,we calculated the minor allele frequencies(MAFs)and missing rates using PLINK(v1.07)[19],and the SNPs with MAF≤0.05 and missing rate≥0.1 were excluded.We tested the Hardy–Weinberg Equilibrium(HWE)using VCFtools(v0.1.14)[20]with the-hwe option and removed SNPs that severely departed from HWE(p<0.01).Next,the selected SNPs with upstream and downstream flanking sequences of 35 base pairs(bp)were submitted to the Affymetrix Axiom®myDesign GW bioinformatics pipeline(Thermo Fisher Scientific Inc.,USA)for probe design.In this pipeline,a p-convert value(between 0 and 1)was assigned to each SNP,representing the probability that the given SNP converts to a reliable SNP assay on the Affymetrix Axiom array system.This score considers the SNP sequence,binding energies,expected degree of nonspecific binding,and hybridization to multiple genomic regions.From the pconvert values and several other QC metrics implemented in the pipeline,the variants were classified as‘‘recommended”(pconvert value>0.6,no interfering polymorphisms(wobble)and poly count=0),‘‘not recommended”(p-convert value<0.4,or no wobble≥3,or poly count>0,or duplicate count>0),‘‘not possible”(on a given strand if we cannot build a probe to interrogate the SNP in that direction,respectively)and‘‘neutral”(others).Only probes designated as‘‘recommended”or‘‘neutral”were retained for further analysis.The flanking sequences of the candidate SNPs were also required to have no other variations or repetitive elements.The GC contents of the flanking sequences ranging from 30% to 70% were retained.
We also filtered the SNPs to ensure an even distribution across the genome.We excluded most A/T and C/G SNP transversions since these markers take up twice as much space on the Affymetrix Axiom array platform.Probes for the final selected SNP panel were anchored on the SNP array with 2000 dish quality control(DQC)probes(negative controls).Finally,we used SNPeff(v4.2)[21]to predict the functional effects of the SNPs on the predicted Japanese flounder gene models.
2.3.Evaluation of the SNP array performance
To assess the performance of the‘‘Yuxin No.1”SNP array,we genotyped 168 Japanese flounder individuals,including 96 that were randomly selected from the genome resequencing sample(for initial SNP discovery)and 72 from the reference population of a GS program[15].
Genomic DNA samples were extracted from each fish and labeled according to the Affymetrix Axiom®2.0 Assay protocol,with a final concentration of 50 ng⋅μL-1and a volume of 10μL.DNA hybridization and array scanning were completed on the Affymetrix GeneTitan Multi-Channel Instrument(Thermo Fisher,USA),which generated raw data in CEL files.These files were imported into the Axiom Analysis Suite software for quality control and genotyping;the sample QC parameters were DQC value≥0.82,call rate(CR)≥0.97,percent of passing samples≥95%,and average CR for passing samples≥98.5%(following the‘‘best practices workflow”).The default SNP QC thresholds were also used to filter the genotypes.
The probe conversion quality of the variants was evaluated by the signal intensity and cluster separation,and the number of heterozygous/homozygous genotype calls were calculated.Based on these metrics,the variants were classified into six categories:‘‘PolyHighResolution”(SNPs had good cluster resolution and at least two examples of the minor allele),‘‘MonoHighResolution”(SNPs had good SNP clustering but less than two samples had the minor allele),‘‘NoMinorHom”(SNPs had good cluster resolution but no samples had the minor allele),‘‘OffTargetVariation(OTV)” (an off-target variant cluster was called),‘‘CallRateBelowThreshold”(SNPs had call rates CR below the threshold,but the other properties were above the threshold),and‘‘Other”(more than one cluster property was below the threshold)[22].
To further test the genotyping quality and accuracy of the SNP array,we randomly selected 96 individuals from the genome resequencing sample and compared the genotypes from the two methods.
2.4.Population structure analysis
Using the genotyping data of 168 individuals from the SNP array,we conducted a principal component analysis(PCA)in GCTA[23]and the first and second components were plotted.
2.5.Application of‘‘Yuxin No.1”in GS for disease resistance
We previously completed a GS program for Edwardsiella tarda(E.tarda)disease resistance using whole-genome resequencing data[15].In this study,we genotyped 72 individuals using‘‘Yuxin No.1,”27 of which(14 males and 13 females)were the parents of 16 families.GEBV was estimated using the weighted genomic best linear unbiased prediction(wGBLUP),and the mid-parental GEBV was used as the GEBV of the corresponding family.Estimated breeding value(EBV)were also estimated by a pedigree-based best linear unbiased prediction(ABLUP)involving five generations.The model used for(G)EBV estimation was defined as
y=Xb+Zg+e

Sixteen families were challenged with E.tarda,so the predictive accuracy of wGBLUP and ABLUP could be assessed by the familylevel GEBV and survival rate.The area under the receiver operator characteristic curves(AUC)[27]was used as an index to illustrate the accuracies of wGBLUP and ABLUP.To estimate the AUC,the survival rates of the 16 families were converted into the binary statistics;we assigned 1 or 0 to the families with survival rates higher or lower than the average value(44.33%),respectively(i.e.,families valued 1 may be used for breeding).The AUC was analyzed in R-pROC[28].
3.Results and discussion
This study aimed to develop a high-quality and standardized genome-wide SNP array for Japanese flounder and to validate the genotyping performance of the array for GS breeding programs.Several factors can affect the design and quality of SNP arrays,such as the quality of the initial SNP set,the SNP filtering and selection parameters,and the SNP array production technology.The two most commonly used SNP array platforms are provided by Affymetrix and Illumina.Both platforms use target hybridization to loci-specific probes,and the probe intensities reflect the abundance of the respective alleles[29].In the Affymetrix array,probes for specified positions are tiled on the array surface to obtain the SNP information(i.e.,chips),whereas the Illumina array uses microscopic beads to anchor the probes.These SNP genotyping platforms have been used in a wide range of genetic studies.High-throughput NGS is a powerful technique to identify genome-wide SNPs,which can be used to select informative SNPs for SNP arrays.
3.1.Sequencing and SNP calling
We conducted whole-genome resequencing of 168 fish and generated 974.9 Gb of sequencing data after quality filtering.These data were combined with the sequencing data of 931 individuals from 90 breeding families that had pedigree information and were phenotypically diverse for disease resistance[15].Finally,3.54 Tb of sequencing data from 1099 individuals were aligned to the reference genome(Table S1 in Appendix A),and more than 42.2 million SNPs were identified.Large-scale genome resequencing of different families allowed us to identify a high-quality and diverse candidate SNP set,which was advantageous for subsequent SNP selection.
3.2.SNP selection and array design
The initial identified SNPs were subjected to several selection steps.First,we filtered the SNPs for MAF≥0.05,missing rate<0.1,and significant departure from HWE(p<0.01).The MAF filtering excluded SNPs with little variation,and the SNPs with high missing rates suggested limited numbers of that genotype in the population.HWE filtering excluded SNPs arising from sequencing errors and natural selection.Thus,these filters removed low-quality SNPs that may have influenced the results.Filtering resulted in a SNP panel of 3 410 891 candidate SNPs,which were submitted to the Affymetrix in silico probe design pipeline;959 651 SNPs passed the p-convert evaluation and were retained.Finally,we selected SNPs that were evenly distributed across the genome,and 48 697 SNPs were anchored on the SNP array,with an average p-convert value of 0.684.
3.3.Characterization of the‘‘Yuxin No.1”SNP array
For the 48 697 SNPs tiled on the array,48 768 probes were synthesized—48 626 SNPs had one probe,and 71 had two probes.The SNPs on the array had an average MAF of 0.177(Fig.1(a)),and the median MAF ranged from 0.115 to 0.189 across 24 chromosomes(Fig.1(b)).Moreover,20%of the markers exhibited high variability(MAF>0.3),and 64.3%had MAF values greater than 0.1(Fig.1(a)).This MAF distribution indicates a high level of polymorphism,which is desirable for genetic analysis,such as genome-wide association studies(GWASs)and linkage mapping.More than 35% of the MAF values were less than 0.1.The general MAF patterns were consistent with the source individuals for genome resequencing(i.e.,from the breeding population and families).This will aid future attempts to improve breeding efficiency and accuracy using genotyping data.
To assess the SNP distribution across the genome,we aligned the loci on the array to the Japanese flounder reference genome and calculated the inter-locus distances.The SNP distribution exhibited a wide but even inter-spacing spectrum.The average spacing between adjacent loci was 9.6 kb(Fig.2(a)),and the inter-SNP spacings were:5125 SNPs spaced<6 kb,5175(10.8%)spaced 6–7 kb,6315(13.1%)spaced 7–8 kb,5471(11.4%)spaced 8–9 kb,5546(11.6%)spaced 9–10 kb,6017(12.5%)spaced 10–11 kb,6557(13.7%)spaced 11–12 kb,and 5964(12.4%)spaced 12–13 kb.Cumulatively,~96% of the gaps between adjacent SNPs were larger than 13 kb.Moreover,the variants were evenly distributed throughout the genome,with an average median distance of 9.8 kb across 24 chromosomes(Fig.2(b)).For most of the regions with large distances between SNPs,only a few SNPs met the selection criteria.
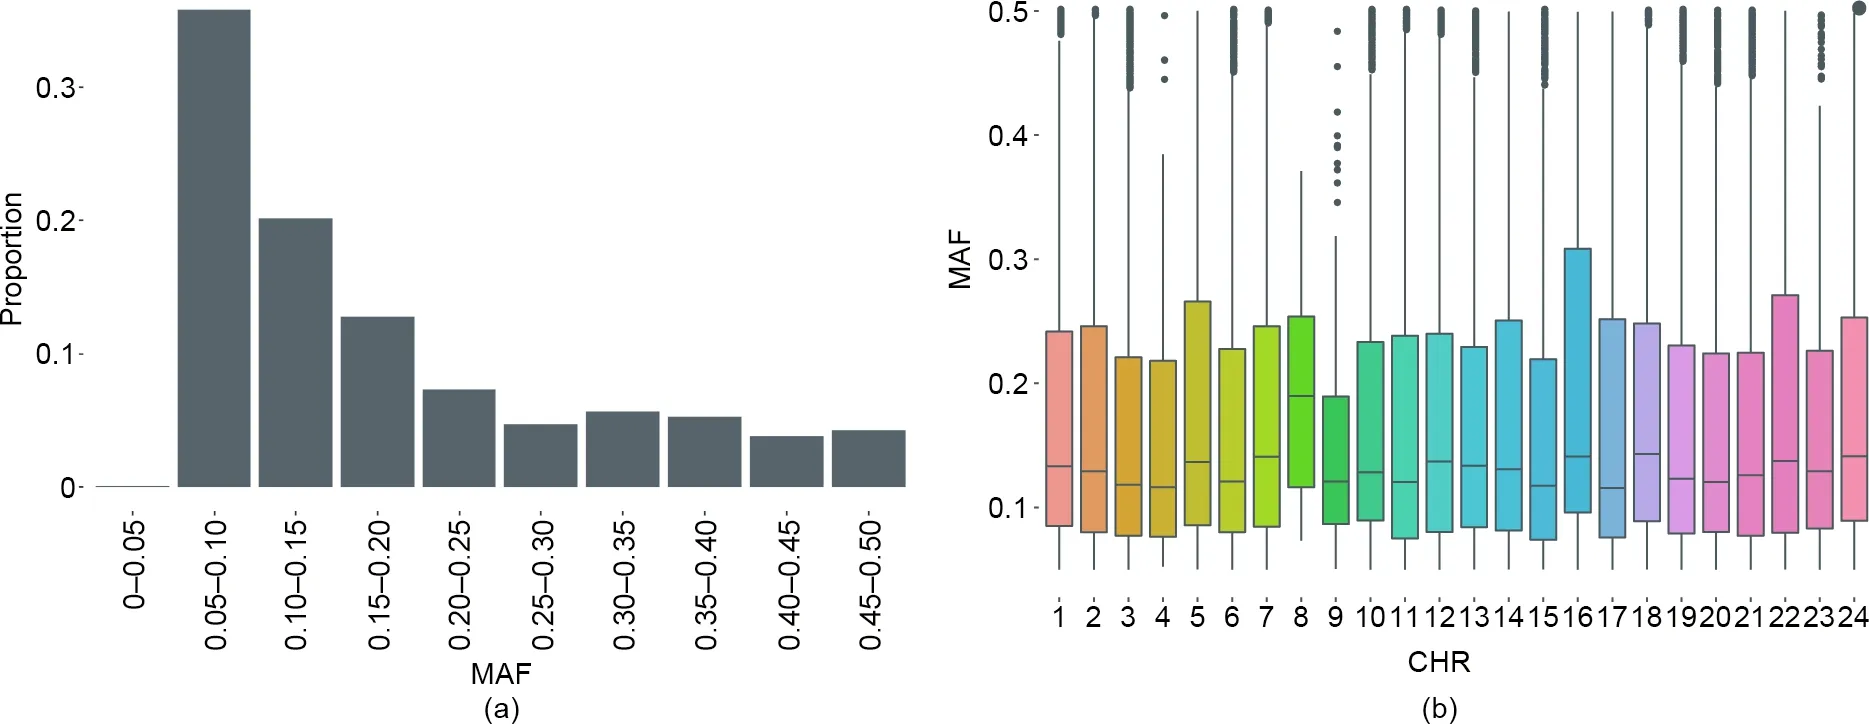
Fig.1.MAFs of the SNPs in the Japanese flounder‘‘Yuxin No.1”SNP array.(a)Proportion of MAFs;(b)MAF distribution across 24 chromosomes.
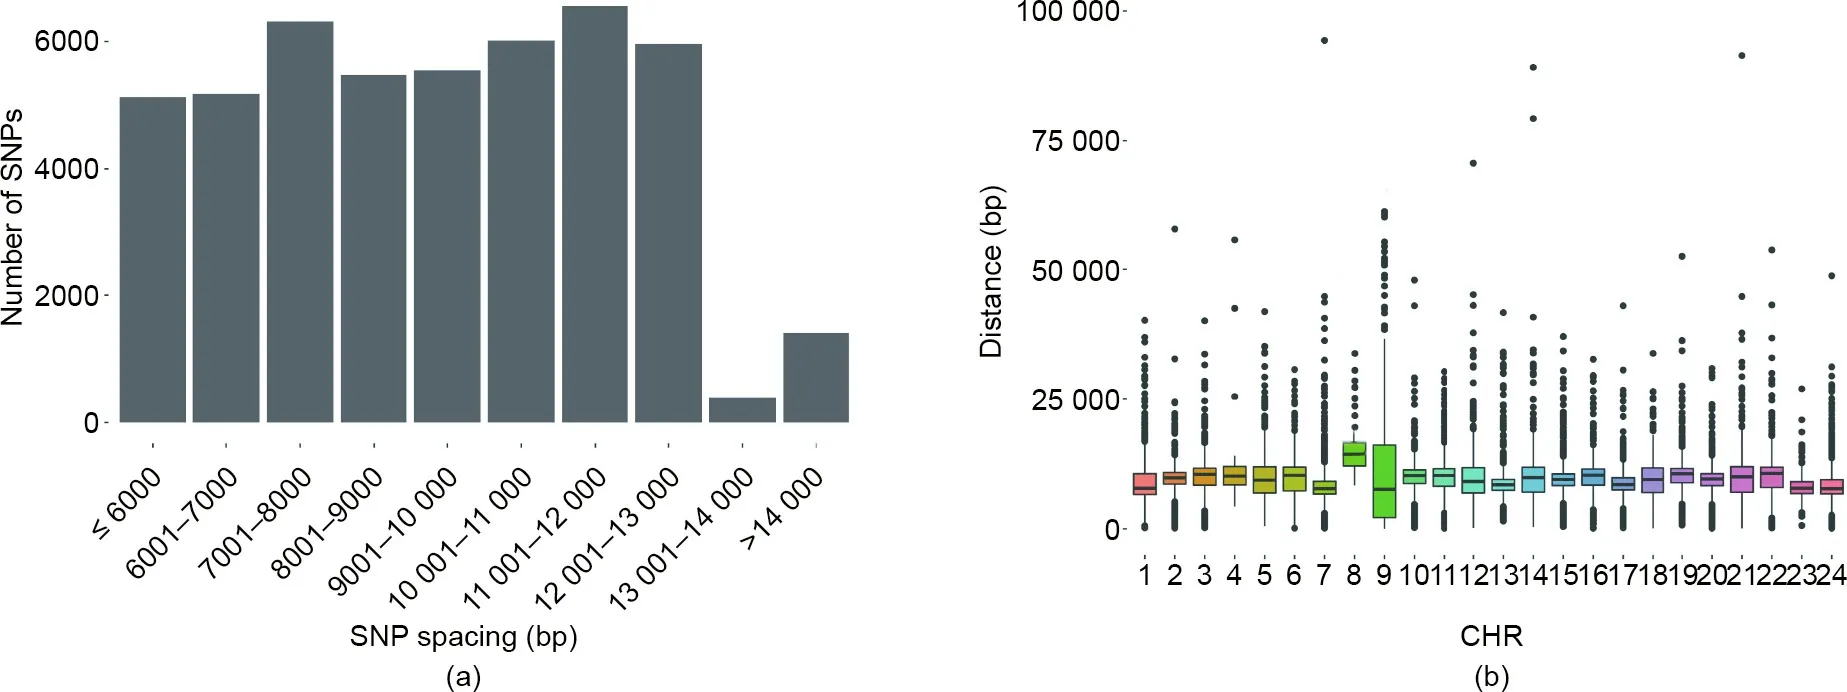
Fig.2.Distribution of loci spacing in the Japanese flounder‘‘Yuxin No.1”SNP array.(a)Inter-loci spacing across 24 chromosomes;(b)distribution of SNPs with different inter-loci spacing.
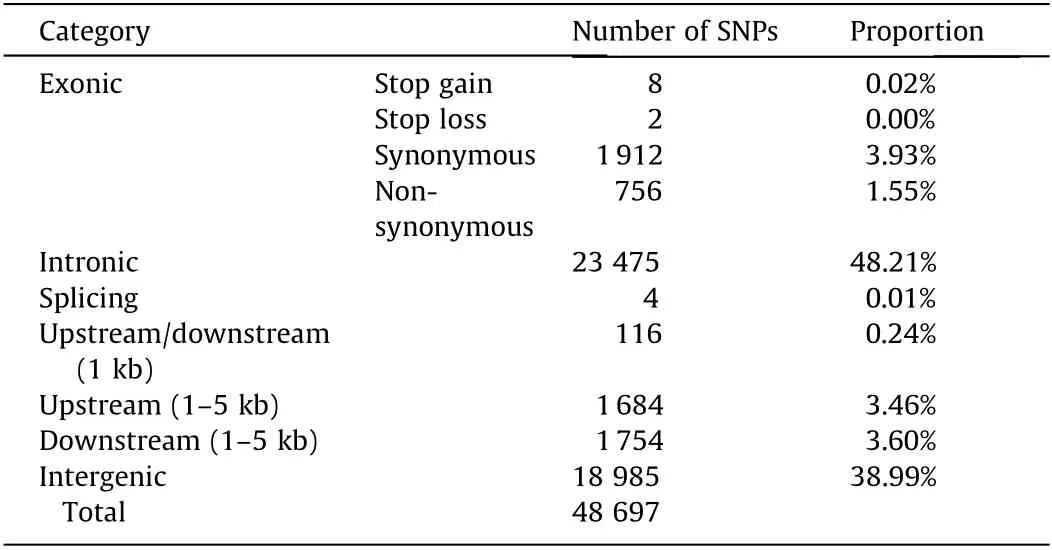
Table 1 The effects of SNP tiling on the Japanese flounder‘‘Yuxin No.1”SNP array.
All of the SNPs tiled on the array were annotated and classified into different genomic groups based on their predicted effects(Table 1).Among the 48 697 SNPs,26 274 SNPs(53.9%)were in genic regions,which included exons,introns,splicing sites,and 1 kb regions of the upstream and downstream sequences of the genes.The two most abundant groups in the genic regions were intronic and synonymous coding SNPs,which contained 23 475 and 1912 SNPs,respectively.The non-genic SNPs included 1684(3.46%)upstream(1–5 kb from the start codons),1754(3.60%)downstream(1–5 kb from the stop codons),and 18 985(38.99%)intergenic SNPs.
3.4.Genotyping performance of‘‘Yuxin No.1”
The performance of the SNP array was evaluated by genotyping 168 DNA samples from the breeding families,166 of which(98.2%)passed the sample QC and CR threshold of 97%.We investigated the conversion performance of the variants on the array for the genotype call rates,cluster separation,polymorphism in the panel,and concordance of the SNP genotypes between the array and resequencing.
Among the 48 697 SNPs on‘‘Yuxin No.1,”36 383 SNPs(74.71%)passed all of the SNP quality criteria.Of these genotyped loci,41.07% were categorized as polymorphic(PolyHighResolution and NoMinorHom),and 33.64%were categorized as monomorphic(MonoHighResolution).The other loci had poor genotyping qualities,exhibited poor performance in the cluster properties,and were classified into as‘‘OTV,”‘‘CallRateBelowThreshold,”or‘‘Others.”A relatively large proportion of monomorphic SNPs were detected(33.64%);some may be false positives from the SNP discovery process or SNPs that cannot be effectively scored due to a lack of suitable assays.Also,the genotyping population is the same as the SNP discovery population,and the genotypes were very similar.Some of these SNPs may be polymorphic if more populations are genotyped.
We also compared the genotypes from‘‘Yuxin No.1”to those from the resequencing.Among a test cohort of 96 fish,95 were successfully genotyped by the array.For the successfully genotyped loci,14 899(41.0%)were 100%concordant with the variants called by resequencing;4002(11.0%),3421(9.4%),and 3162(8.7%)SNPs had concordance rates within 0.95–0.99,0.90–0.95,and 0.85–0.90,respectively.In summary,70% of the SNPs had concordance rates≥85%,indicating cross-validation of the genotyping results from the SNP array and genome resequencing.
3.5.PCA of the population structure
Investigations of the population structure are essential for many population genetic studies.To evaluate if the‘‘Yuxin No.1”SNP array can detect population segregation,we performed a PCA of the SNPs from 168 genotyped individuals.The samples clustered into two distinct groups,according to the first and second principal components(PC)(Fig.3).This was consistent with their origins/sampling sites in Hebei and Shandong Provinces,China,respectively.This clustering analysis demonstrates the ability of‘‘Yuxin No.1”to characterize population structures.
3.6.Application of‘‘Yuxin No.1”to GS
Through selective breeding programs,significant genetic improvement can be achieved for economically-important traits in fish.We completed a GS program for disease resistance in Japanese flounder,based on different breeding families and artificial infection of the pathogen E.tarda[15].To test the viability and performance of the‘‘Yuxin No.1”SNP array in GS,we genotyped the parents of 16 randomly selected families(27 individuals)via the SNP array and estimated the(G)EBVs using the reference population[15].The average survival rate of seven families(namely disease-resistant family)was 61.13%,while the average survival rate of nine families(namely susceptible family)was 31.27%.The average GEBV(2.10)of the disease-resistant families was higher than the average GEBV(1.56)of the susceptible families(Table 2).The wGBLUP resulted in an 80%predictive accurate rate,which outperformed the ABLUP method(66%)(Fig.4).Thus,our SNP array-based GS led to a 21.21% relative increase in predictive accuracy.The GEBVs predicted by wGBLUP were moderately correlated(Pearson’s correlation=0.70)with the EBVs estimated by ABLUP,indicating different accuracies in the(G)EBV estimations of wGBLUP and ABLUP.Our results are consistent with previous GS studies for disease resistance in fish—all GS methods performed better for GEBV estimation and resulted in 13%to 52%increases in predictive accuracy compared to ABLUP[30–32,34].Together,these results suggest that‘‘Yuxin No.1”can be used for the GS of disease-resistant germplasm.Nevertheless,the number of individuals used for GEBV estimation in this study was limited and does not fully simulate a GS program for E.trada resistance in Japanese flounder.Additional animals are required to fully evaluate the array for GS,and we are working to increase the sample sizes of the reference and candidate populations for genotyping with the SNP array.
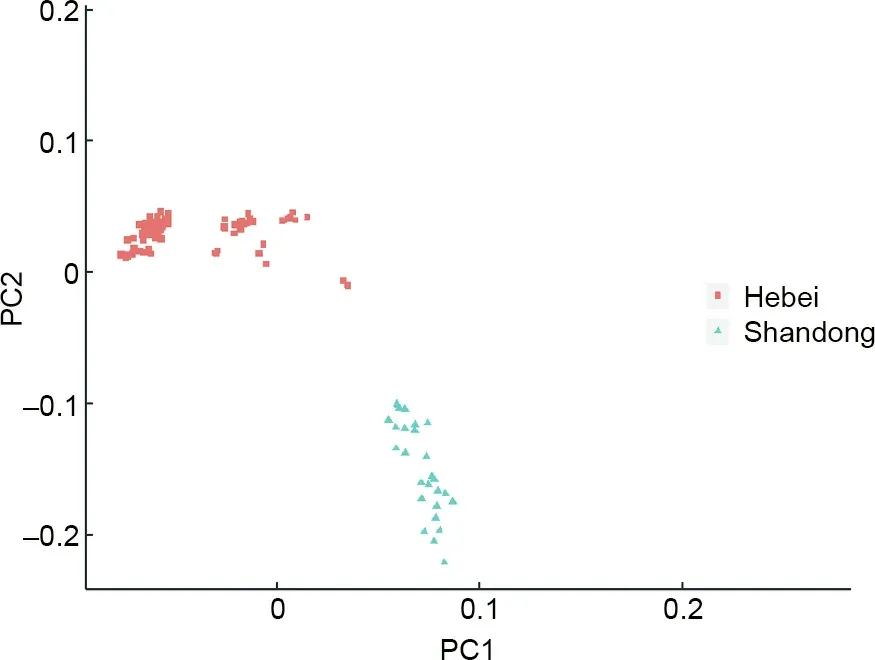
Fig.3.PCA to investigate the population structure of the Japanese flounders genotyped using the‘‘Yuxin No.1”SNP array.‘‘Hebei”and‘‘Shandong”indicate the individuals collected in Hebei and Shandong Provinces,China,respectively.

Table 2 Average survival rate after E.tarda infection and estimated breeding values of 16 Japanese flounder families.
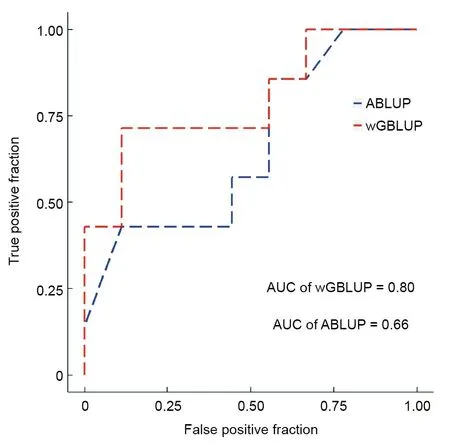
Fig.4.The predictive accuracies of wGBLUP and ABLUP for GS,evaluated using receiver operator characteristic curves.
4.Conclusions
Here,we report the design and development of a Japanese flounder 50K SNP array‘‘Yuxin No.1.”Leveraging wfholegenome sequencing data from 1099 individuals,we identified a starting set of more than 42.2 million SNPs and selected 48 697 SNPs to anchor the array based on MAF,genomic location,and probe design recommendations from Thermo Fisher Axiom®technology.Using‘‘Yuxin No.1,”we generated high-quality genotyping data for a test panel of 168 fish,and the performance of the genotyping data in GS for disease resistance was consistent with prior studies.This indicates that‘‘Yuxin No.1”is applicable for GS of economically-important traits and provides a robust platform for genotyping and selective breeding programs.
Acknowledgements
This work was supported by Natural Science Foundation of Shandong Province(ZR2016QZ003),National Natural Science Foundation of China(31461163005),Central Public-interest Scientific Institution Basal Research Fund,CAFS(2020TD20 and 2016HY-ZD0201),AoShan Talents Cultivation Program Supported by Qingdao National Laboratory for Marine Science and Technology(2017ASTCP-OS15),and the Taishan Scholar Climbing Project Fund of Shandong of China.
Authors’contribution
Song-lin Chen obtained the funding,and conceived and instructed the study.Qian Zhou performed the SNP selection and probe design for the SNP array.Ya-dong Chen and Yang Liu prepared the DNA sample.Qian Zhou,Sheng Lu,and Ya-dong Chen performed the SNP array scanning and analyzed the genotyping data.Sheng Lu performed GEBV calculation.Yang-zhen Li,Lei Wang,and Yingming Yang performed the family construction and bacterial challenging experiment.Wen-teng Xu and Na Wang participated the project managements.Qian Zhou,Sheng Lu,and Song-lin Chen wrote the manuscript.All authors reviewed the manuscript.
Compliance with ethics guidelines
Qian Zhou,Ya-dong Chen,Sheng Lu,Yang Liu,Wen-teng Xu,Yang-zhen Li,Lei Wang,Na Wang,Ying-ming Yang,and Song-lin Chen declare that they have no conflict of interest or financial conflicts to disclose.
Appendix A.Supplementary data
Supplementary data to this article can be found online at https://doi.org/10.1016/j.eng.2020.06.017.
- Engineering的其它文章
- Process Intensification in Pneumatically Agitated Slurry Reactors
- New Standards Release Sets Stage for 5G Future
- Fundamentals and Processes of Fluid Pressure Forming Technology for Complex Thin-Walled Components
- Extreme Learning Machine-Based Thermal Model for Lithium-Ion Batteries of Electric Vehicles under External Short Circuit
- Progress in Research and Development of Molten Chloride Salt Technology for Next Generation Concentrated Solar Power Plants
- Evaluation Method and Mitigation Strategies for Shrinkage Cracking of Modern Concrete

