Population-Based and Personalized Design of Total Knee Replacement Prosthesis for Additive Manufacturing Based on Chinese Anthropometric Data
C.S.Chui,K.S.Leung,J.Qin,c,D.Shi,P.Augt,R.M.Y.Wong,S.K.H.Chow,X.Y.Hung,C.Y.Chen,Y.X.Li,P.S.H.Yung,L.Qin,,*,W.H.Cheung,*
a Department of Orthopaedics and Traumatology,Faculty of Medicine,The Chinese University of Hong Kong,Hong Kong 999077,China
b Center for Translational Medicine Research and Development,Shenzhen Institutes of Advanced Technology,Chinese Academy of Sciences,Shenzhen 518055,China
c Department of Orthopaedics and Traumatology,Nanjing Drum Tower Hospital,The Affiliated Hospital of Nanjing University Medical School,Nanjing 210008,China
d Institute for Biomechanics,Berufsgenossenschaftliche Unfallklinik Murnau,Murnau am Staffelsee 82418,Germany
e Institute for Biomechanic,Paracelsus Medical University Salzburg,Salzburg 5020,Austria
Keywords:
ABSTRACT At present,most total knee replacement(TKR)prostheses on the market are designed according to the sizes of Caucasians.However,extensive studies have indicated that human anatomies differ among different ethnicities.A number of reports have indicated that Chinese TKR patients do not match with available prostheses.In this study,computed tomography(CT)images of 52 knees of Chinese men and women were used for anthropometric measurements.Index and geometric measurements were defined and used for correlation analysis.Key parameters from the measurement results were identified.Detailed geometries of knees were measured as coordinates.A deformable three-dimensional(3D)knee model based on anatomical coordinates correlating with the identified key parameters was generated.A prosthesis was then designed according to the analyzed results.Surface matching analysis,bone resection analysis,and cadaveric trials were conducted and compared with commercial products to validate the proposed design.The femoral component designed by this study resulted in the highest accuracy(root mean square point-to-surface(RMS PS),(1.08±0.20)mm)and lowest amount of resected bone volume(27 412 mm3)in comparison with two commercial knee prostheses.This study suggests a new approach for population-based patient-specific femoral prosthesis design.With a single,easily acquired dimension—namely,epicondyle width(ECW)—as input,a patient-specific femoral prosthesis can be designed according to the analyzed measured data and manufactured by additive manufacturing(AM)methods.Meanwhile,the reconstructed femoral condylar surface was compared with the femoral condylar surface in the original CT scanning data.The average RMS PS distance of the reconstructed femoral condylar surface among all data was(1.10±0.18)mm,which is comparable to other statistical shape modeling methods using multiple radiographs as input data.There is a need to develop an anthropometric-based knee prosthesis for the Chinese population.Based on the anthropometry of the Chinese population,our new design fits Chinese patients better and reserves more bone volume compared with current commercial prostheses,which is an essential step toward AM for personalized knee prostheses.
1.Introduction
1.1.Background
Extensive studies have indicated that human anatomies differ among different races.As reported by Yue et al.[1],the dimensions of Chinese knees are generally smaller than those of Caucasian knees.In addition,Chinese females have a significantly narrower distal femur than white females,while Chinese males have a wider proximal tibia than their Caucasian counterparts.Ho et al.[2]reported that the Asian population in general has a smaller build and stature compared with Western counterparts.Several studies[1–3]have compared the knee geometry of Asians and Caucasians and have discovered that the aspect ratios(mediolateral length/anteroposterior length)of their femurs are different.Due to the lack of available prostheses to fit Chinese anthropometric characteristics,some Chinese total knee replacement(TKR)prostheses patients do not match with commercially available prostheses.Undersized prosthesis will lead to prosthesis subsidence,while overhang of the component will result in soft tissue abrasion and,ultimately,in operation failure[4].Most of the commercially available TKR prostheses are designed according to the anthropometric data of Caucasian knees,which has been reported as the cause of the component mismatch in Asian people[1,3].This reliance on Caucasian prostheses leads to a mismatch between the prosthesis and the resected bony surface[5].Thus,there is a need to develop an anthropometric-based knee prosthesis for the Chinese population.
With the help of additive manufacturing(AM)technology and three-dimensional(3D)printers,the manufacturing of patientspecific prostheses and instruments has become possible.AM,also known as 3D printing,is a technology that produces 3D parts in a layer-by-layer manner from a material[6].Medical 3D models are increasingly used for surgical planning,medical computational models,algorithm verification and validation,and medical devices development[7].Bio-printing and 3D printing have great potential for applications in tissue engineering,regenerative medicine,and drug screening[8,9].3D printing is particularly suited for customized fabrication,such as the fabrication of artificial implants(artificial bones and teeth,etc.),and medical rehabilitation equipment and devices[10].In the field of orthopedics,3D printing is usually used to create custom-made implants and patient-specific instrumentation,and to bio-print tissues for regeneration—especially bone and cartilage[10–12].Application of patient-specific instruments(PSIs)can improve surgical accuracy and are superior to freehand resection[11,13].Custommade metal 3D printed patient-specific implants and instruments are increasingly studied for pelvic oncologic resection,the reconstruction of resected defects,and revision hip arthroplasties,with favorable results[14,15].The personalized TKR prosthesis developed in this study could also be fabricated by the latest 3D technology and implanted in patients with the assistance of PSI.
1.2.Aim of this study
This study aimed to develop a knee prosthesis based on data from the Chinese population.The developed prosthesis fits Chinese knees better and facilitates better bone preservation in Chinese patients.
1.3.Hypothesis
By incorporating the dimensional index data and geometric anthropometric data,a population-based Chinese knee model could be generated.By supplementing biomechanical analysis and manufacturing considerations,a knee prosthesis could be designed according to the population average to achieve better surgical outcomes.
1.4.Objectives
The objectives of this study are:
(1)To develop a standard method for collecting comprehensive anthropometric data,including the dimensional index data and geometric data from Chinese knees;
(2)To develop a method to generate a knee model and prosthesis design from the collected anthropometric data;
(3)To analyze the effectiveness and feasibility of the developed Chinese-population-based TKR prosthesis.
2.Materials and methods
2.1.Subject recruitment
As this is an anthropometric study based on the Chinese population for prosthesis design,it was necessary to acquire adequate related data from medical images.Data on the whole lower limb was acquired because the mechanical alignment of the lower limb is essential for a knee prosthesis study.Computed tomography(CT)images were selected for analysis because our main interest is the geometry of the outermost bony structure in the whole lower limb region,and CT scans are well known as the best method for acquiring bony structure data in the region of interest.A GE LightSpeed Volume Computed Tomography(General Electric,USA)was used in the study for CT scanning,with a slice increment of 0.5 mm,a slice thickness of 0.625 mm,a pixel size of 0.8 mm,and a field of view of 400 mm.Angiographic CT images were used in this study,with the ages of subjects ranging from 50 to 70 years.Since our aim was to study the anthropometry of normal adult knees,CT images of pathological cases suffering from osteoarthritis,fracture deformity,or other diseases affecting the anthropometry were excluded from the study.
Based on previous studies describing the measurements of the knee anatomy,lower limb alignment,and condylar structures[16–21],we selected four key anthropometric variables strongly related to the anthropometric characteristics of the knee in our pilot study:namely,epicondyle width,lateral femoral condylar depth,medial femoral condylar depth,and medial femoral condylar ratio.It was estimated that 45 subjects were required for a reliable description of all four variables with a standard deviation(SD)of 8 at a significance level of 0.05 and 80% power.
A total of 52 subjects with 52 sets of CT scanning data of the lower limb(from pelvis to ankle)were used for this study.Of these,26 subjects were male and 26 were female.The ages of the subjects ranged from 50 to 70 years(63.19±5.61).The specifications of the images are described below.
2.2.Anthropometric coordinate system
Segmentation and 3D bone model reconstructions were done by biomedical engineers qualified with a doctor of orthopedics,using the medical image-processing software Mimics 18.0(Materialise,Belgium)on the CT scanning data in digital imaging and communications in medicine(DICOM)format.The hip center,knee center,ankle center,and posterior condylar axis were defined in Mimics 18.0 software using the geometry fitting function on the corresponding anatomical landmarks.The 3D models of the femur,tibia,and patella were exported in standard template library(STL)format for further processing.
2.2.1.Newly defined posterior condylar axis
Previous anthropometric studies of the knee joint have considered the shape of the posterior femoral condyle to be similar to a cylinder[16,17].The literature suggests that illustrating the distal part of the femur by modeling the posterior condyles in the form of cylinders could most closely reproduce the geometry of the condyles[16–18,22].To fit this cylinder using Mimics 18.0 software,we had to mark the area of the condylar surface first.However,the definition of the surface boundary of the posterior condylar cylinder varies in different studies.In this study,therefore,we defined a clear and easily reproducible boundary of the marking surface.The anterior boundary started from the horizontal tangential line of the intercondylar notch arc,and the posterior boundary ended at the margin of the posterior condylar contacting surfaces(Fig.1).A cylinder was then fitted,with the axis of this cylinder being the newly defined posterior condylar axis(NPCA)(Fig.1).A previous study from our group found that the NPCA was more consistent and reliable than the epicondyle axis[19].
2.2.2.Hip,knee,and ankle centers
The contacting surface of the femoral head was considered as a sphere.The literature has reported that the hip center can be calculated by fitting a best fitting sphere described by the trajectory of markers placed on the thigh[20,23].This area of the contacting surface,excluding the area of the fovea of the femoral head,was marked and a virtual sphere was generated.The hip center was defined as the center of this sphere(Fig.2).The knee center was defined as the midpoint of the NPCA(Fig.1).It has been reported that the ankle joint surface can be regarded as a segment of a cone,the axis of which lies on the ankle’s empirical axis[24].The distal tibial contacting area of the ankle joint was marked and a cylinder was fitted.The ankle center was defined as the center of this cylinder(Fig.3).
2.2.3.Defined anthropometric coordinate systems
The STL files of the 3D models were imported into the computer-aided drawing software SolidWorks(Dassault Systèmes,USA)to build 3D coordinate systems(Fig.4)to facilitate standardized and repeatable measurements of the geometric parameters of the femur,tibia,and patella.
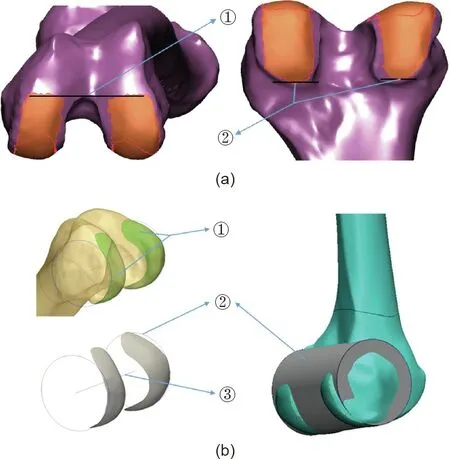
Fig.1.(a)Boundary of marking area for fitting the posterior condylar cylinder:①anterior boundary:at the horizontal tangential line of the top intercondylar notch arc;②posterior boundary:at the end of the posterior condylar contacting surface of the medial and lateral sides.(b)Methods for obtaining the newly defined posterior condylar axis(NPCA):①smoothed marking surface of the posterior femoral condyle;②outline and surface image of the posterior condylar cylinder;③NPCA.
The coronal plane of the entire lower limb was determined by the line passing through the hip and ankle centers and parallel to the NPCA(Fig.4)[17].A third line perpendicular to both of these lines was set as the Z axis,with a posterior–anterior direction.The line through the hip and ankle centers was defined as Y axis.The X axis was determined by the Y and Z axes to form a traditional right-hand 3D Euclidean coordinate system.
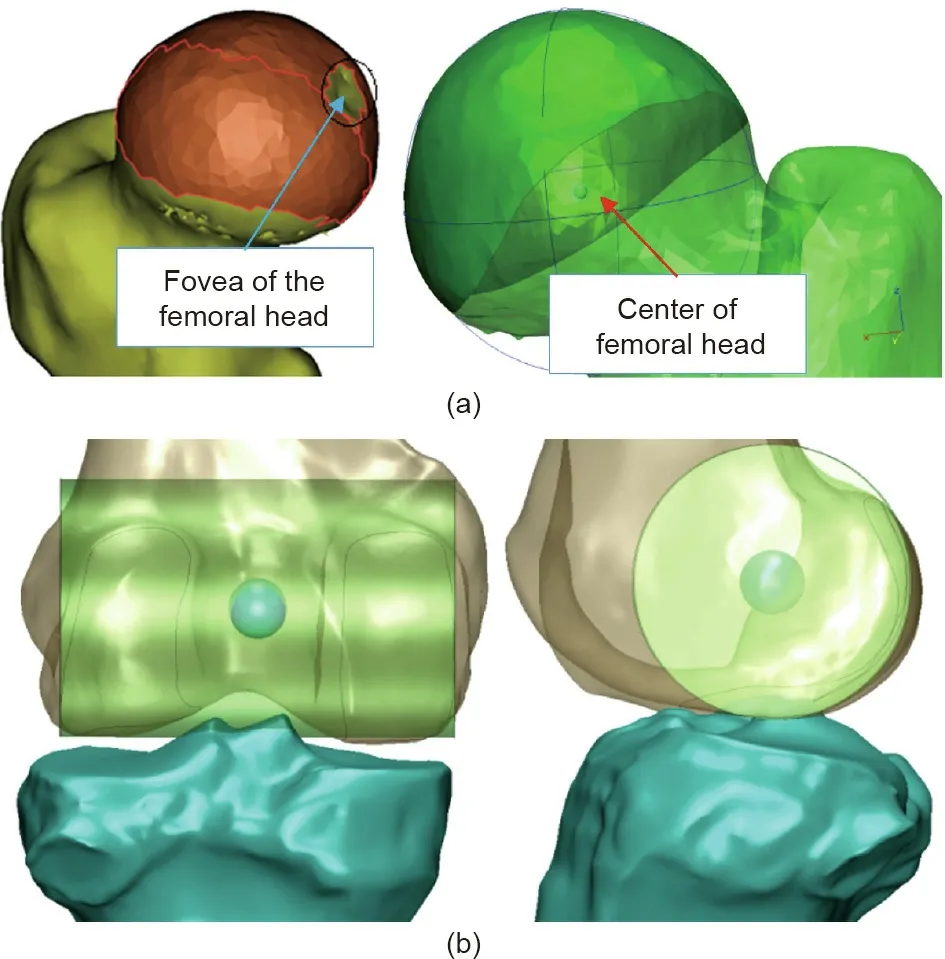
Fig.2.(a)Marked area of the contacting surface of femoral head,where the area of the fovea was excluded.A sphere was generated and the center was located.(b)Illustration of knee center.
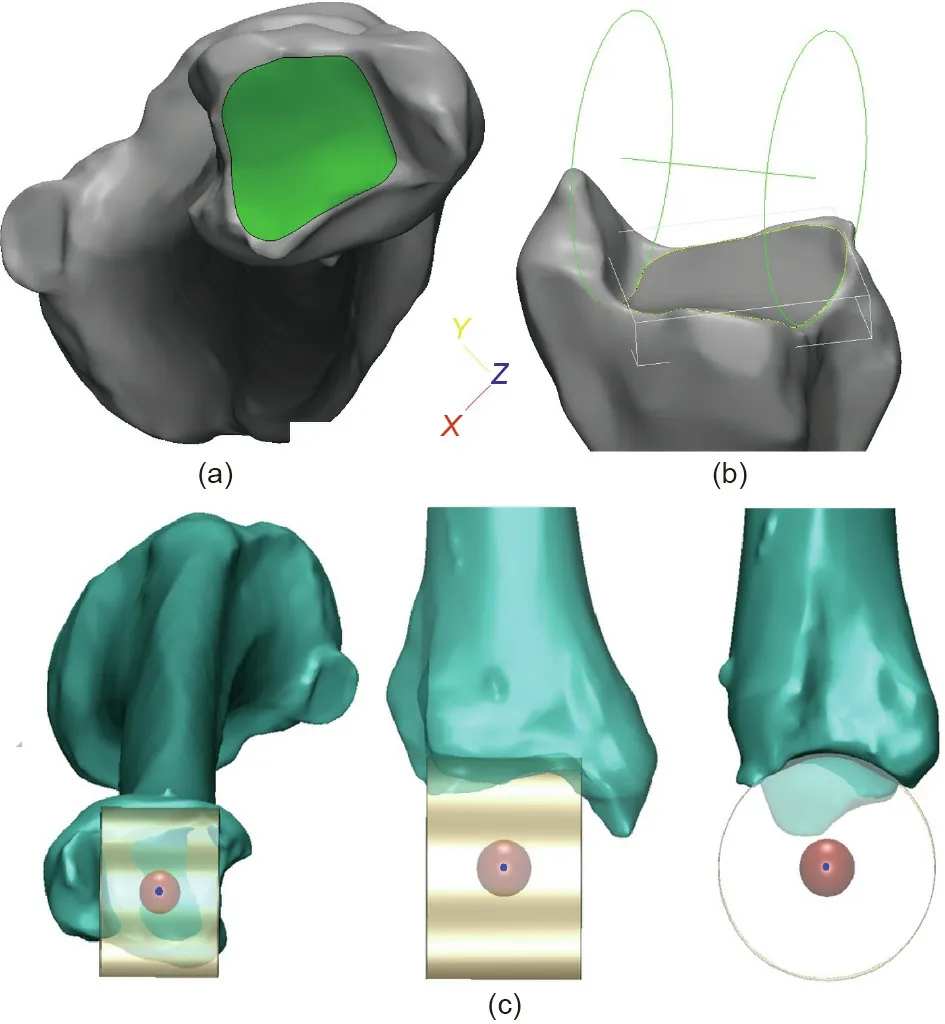
Fig.3.Illustration of the ankle center.(a)Mark distal tibial contacting area of the ankle joint;(b)cylinder generated based on the marked surface;(c)the center of the ankle joint was located.
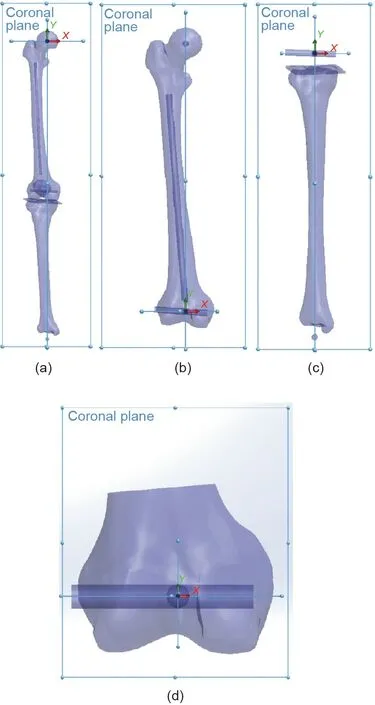
Fig.4.Illustration of the coordinate system.(a)Coordinate system of the lower limb;(b)coordinate system of the femur;(c)coordinate system of the tibia;(d)coordinate system of the femoral condyle.
The coronal plane of the femur was determined by the hip center and the NPCA(Fig.4).The Z axis was determined by the line perpendicular to the coronal plane,from posterior to anterior at the hip center.The Y axis was determined by the line passing through the knee center and the hip center.The X axis was determined by the Y and Z axes to form a traditional right-hand 3D Euclidean coordinate system.
The coronal plane of the femoral condyle was determined by the hip center and the NPCA(Fig.4).The Z axis was determined by the line perpendicular to the coronal plane,from posterior to anterior at the knee center.The X axis was determined by the NPCA.The Y axis was determined by the X and Z axes to form a traditional right-hand 3D Euclidean coordinate system.
The coronal plane of the tibia was determined by the ankle center and the NPCA(Fig.4).The Z axis was determined by the line perpendicular to the coronal plane,from posterior to anterior at the knee center.The X axis was determined by the Y and Z axes to form a traditional right-hand 3D Euclidean coordinate system.
2.3.Measurement parameters
The dimensional index parameters are the anthropometric data of the gross anatomy of knee joint.A total of 36 index parameters representing the landmarks of the lower limb were measured,including nine parameters for the femur(Appendix A Fig.S1),23 for the femoral condyle(Appendix A Fig.S2),and four for the tibia cutting surface(Appendix A Fig.S3).The geometric parameters are the parameters measured on the sections of the distal femur and proximal tibia.A total of 90 geometrical parameters indicating the features of the knee joint were measured in this study.On the sections of the femoral condyle,the medial,lateral,and most inferior points of both medial and lateral condyles were marked(medial point of medial condyle(CMM),lateral point of medial condyle(CML),and inferior point of medial condyle(CMI),respectively).The two-dimensional(2D)coordinates(X dimension on the NPCA line,Y dimension on the line perpendicular to the NPCA)of these points according to the origin(the knee center)were measured using SolidWorks software(Appendix A Fig.S4).The rule of the numerical suffix of each parameter was listed as follows:①–120° section,②–90° section,③–70° section,④–30° section,⑤0° section,and⑥40° section.On the sections of the patella groove(PG),the highest points of the groove at both the medial and lateral sides and the lowest point were first marked(medial patella(PM),lateral patella(PL),and PG,respectively).The midpoints of the groove outline between the highest and lowest points on both the medial and lateral sides on the X axis were marked later(as medial point of medial patella groove(PMM)and medial point of lateral patella groove(PLM))(Appendix A Fig.S5).The 2D coordinates of these points were measured.The rule of the numerical suffix of each parameter was listed as follows:①60° section,②90° section,③110° section,and④40° section.The 40° section was the transition zone between the condyle and groove region.The fusion of the condyles and the groove made the medial point of lateral condyle(CLM)and the PLM the same conjunct point,so they were the same as the CML and the lateral point of PM(PML).On the section of the proximal tibia at 8 mm under the tibial plateau surface with 5°inclination,the tibial medial posterior level(TMY)and the tibial lateral posterior level(TLY)were marked.The 2D coordinates(X dimension on the NPCA line,Y dimension on the line perpendicular to the NPCA)of these points according to the origin(the knee center)were measured using SolidWorks software(Appendix A Fig.S6).
2.4.Statistical analysis
Data analysis was performed using SPSS 20.0 software(IBM,USA).Pearson’s correlation was performed between index parameters.Index parameters with high correlation(R2>0.7,P<0.001)were identified.The index parameter with the highest correlation that was also easily clinically assessed was selected as the root parameter in the final design of the prosthesis.
Linear regression analysis was performed to determine the relationship between the index parameters and the geometric parameters.In linear regression,the relationships were modeled using linear predictor functions whose unknown model parameters were estimated from the data.Linear regression generated the coefficients of a formula(and its standard errors and significance levels)to predict a logit-transformation of the probability of the presence of the characteristic of interest:
Given a dataset of n statistical units from i=1 to i=n,


A linear regression model assumes that the relationship between the dependent variable y and the p-vector of regressor X is linear.This relationship is modeled through a disturbance term ε,which is an unobserved random variable.
A detailed mathematical formula was established based on the coefficients between one geometric parameter and the index parameters[25].
2.5.Reconstruction accuracy of the condylar surface
The reconstructed femoral condylar surface was compared with the femoral condylar surface in the original CT scanning data.Reconstruction of the femoral condylar surface was done for ten sets of sex-matched CT scanning data in the database(50% male and 50% female).The surface reconstruction accuracy was done by obtaining the root mean square(RMS)distance of all reconstructed surface points to the distal femur.The reconstructed condylar surface was matched with the original CT data.The reconstructed surface and the original femur data(STL file)was placed in the 3-matic software(Materialise,Belgium).The origin and the coordinate system of the original femur data and the reconstructed condylar surface were superimposed.Using the‘‘part comparison analysis”function in the Mimics 18.0 software,the RMS distance between the reconstructed condylar surface and the cadaver femoral condylar surface was compared.
2.6.Bone resection volume measurement
Preservation of bone stock is one of the goals of TKR surgery.Ten personalized femoral components using the Chinesepopulation-based reconstructed condylar surface were assembled on the corresponding femoral bone using 3-matic software.The required bone resection volume was accessed.In contrast,ten commercial femoral components(Mobile Bearing Model(Weigao,China))and another ten commercial femoral components(Posterior Stabilizing Model(Weigao,China))based on the Caucasian anatomy were assembled on the same femurs with the relevant sizes.The required bone resection volume was again measured.
2.7.Cadaveric trial
Three embalmed cadavers(left lower limb)were used for the cadaveric trial to investigate①the concept of the design,②the feasibility of the surgery and fitting of the prosthesis,and③the achievable surgical outcome.All cadavers included the region from the left pelvis to the foot.CT scans were taken with a 1.25 mm slice increment and a pixel size of 0.702 mm.
A cadaveric trial on knee prosthesis prototypes was performed based on the clinical practice in total knee arthroplasty(TKA)surgery.The inferior cut of the femur was first performed,followed by the posterior cuts and then the anterior cuts.The notch cut was done last.All the cuts were performed under the guidance of the PSI.The fitting of the TKR prosthesis was assessed and the range of motion of the TKR-installed cadavers was examined by an experienced surgeon with 30 years of experience in orthopedic surgery.The TKR prosthesis and the PSIs were fabricated by a Fortus 400mc fused deposition modeling machine(Stratasys,USA).The prostheses were installed on the cadaveric bone by the surgeon.
3.Methodology validation and results
3.1.Statistical analysis
From the data analysis described in Section 2.4,the epicondyle width(ECW)was found to be strongly correlated to most of the critical index parameters(medial femoral height(FMH),R2=0.749;lateral condylar depth(CLD),R2=0.847;medial condylar depth(CMD),R2=0.849;lateral posterior condylar height(PCLH),R2=0.791;lateral femoral height(FLH),R2=0.740).All the critical parameters were found to be with significant difference(P<0.001).The ECW was selected as a root parameter in the final design of the prosthesis.
3.2.Anatomy reconstruction based on the analyzed anthropometric data
For each subject/patient,once the measured data was analyzed,we could predict the coordinate parameters by the derived formula with the input of the ECW measurement.Reconstruction could then be done using SolidWorks software.The measured sections were first constructed and the selected parameters(measured anatomical points)were plotted on specific sections with the analyzed coordinates by the formula described above.
Measured femoral condyle data were used for the reconstruction process(Appendix A Fig.S7).The points were connected by a spline to simulate smooth curves at the condylar region.The tibial components were composed of two parts:the tibial tray and the insert.Similar to the femoral condylar reconstruction,the tibial tray was reconstructed using the measured and analyzed data.The tibial tray base was first constructed and the selected parameters(measured anatomical points)were plotted on specific sections with the analyzed coordinates according to the formula described above.The tibial tray base was aligned with the femoral component according to the measurement coordinate system.The surface was then extruded to build the insert,and the grooves on the tibial trays were designed based on the femoral condylar geometry.A personalized knee prosthesis could thus be designed according to anthropometric data for the Chinese population with the input of the specific ECW value of a patient.
3.3.Reconstruction accuracy of condylar surface
The RMS point-to-surface(PS)distances among all data were(1.08±0.20)mm(Figs.5 and 6).The RMS PS distance in the PG region among all data was(1.23±0.27)mm.The RMS PS distance in the posterior condylar region among all data was(0.98±0.30)mm.
Two Caucasian-based commercial knee prostheses were also compared with the femoral condylar surface in the original CT scanning data.The models were the Mobile Bearing Model and the Posterior Stabilizing Model(Fig.7).For the Mobile Bearing Model,the RMS PS distances among all data were(2.00±0.50)mm.The RMS PS distance in the PG region among all data was(3.19±0.96)mm.The RMS PS distances in the posterior condylar region among all data were(1.52±0.48)mm.For the Posterior Stabilizing Model,the RMS PS distances among all data were(2.11±0.41)mm.The RMS PS distances in the PG region among all data were(3.02±0.74)mm.The RMS PS distances in the posterior condylar region among all data were(1.39±0.39)mm.
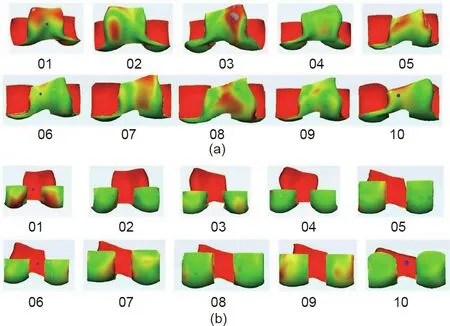
Fig.5.(a)Surface matching accuracy of reconstructed PG;(b)surface matching accuracy of reconstructed posterior condyle.
3.4.Bone resection volume measurement
The smallest amount of average resected bone volume was recorded from our design(27 412 mm3),which was smaller than that from the Mobile Bearing Model series(30 647 mm3)and the Posterior Stabilizing Model series(28 138 mm3).
3.5.Cadaveric trial
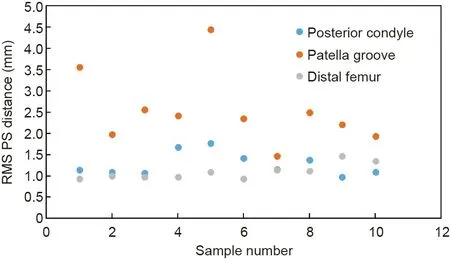
Fig.6.Surface matching accuracy of reconstructed femoral condylar surface.
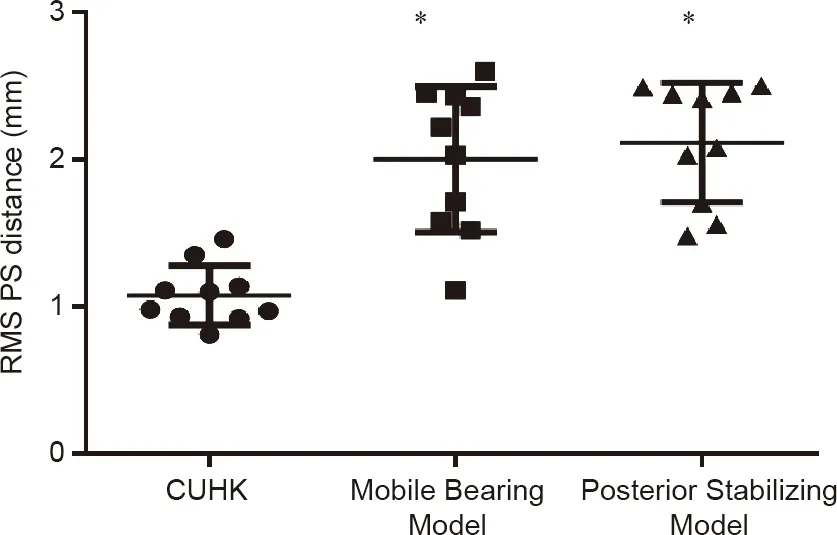
Fig.7.Surface matching accuracy of current study and commercial knee prostheses.N=10 per group,One-way analysis of variance(ANOVA),Dunnett’s multiple comparisons test*is statistically significant different with The Chinese University of Hong Kong(CUHK)group(P<0.05).
All the cadaveric trials(N=3)were successfully done.Three sets of TKR prostheses including femoral components and tibial components were successfully installed in the cadavers.The femoral component covered the distal femur surface very well,especially in the condylar region,as expected.The contour of the tibial component fitted well on the proximal tibia after the tibial cut.The TKR prosthesis-installed cadaveric knee was able to move smoothly.The ranges of motion of the cadaveric knees were tested during the trial.All cadaveric knees were able to move and rotate from 0° to 110°,which was satisfactory.The TKR prosthesis was functioning as expected.The feasibility of the design method was proven in the cadaveric trial(Fig.8).
4.Discussion
In summary,3D anthropometric data of Chinese knees were analyzed and a Chinese-population-based formula for femoral condylar surface reconstruction was created.A consistent and repeatable method for reconstructing the condylar surface,more precise surface fitting of prosthesis,and better bone preservation of patients was established.
4.1.A brand new method for patient-specific knee prosthesis design with a single dimension as input,which can be measured in an X-ray image
This is a population-based approach to reconstruct the surface of the femoral condyle,which can represent not only an individual patient,but also a number of subjects from the same population in what is called a patient-specific statistical shape model[26].
In this study,a brand new coordinate system series for the 3D measurement of lower limb anthropometry was developed.The coordinate systems can be used for 3D measurement of lower limb anthropometry.Defined characteristics of the knee can be measured in terms of coordinates,which is different from previous anthropometric studies[1–5].
The 3D coordinates of the specific parameters from the 52 subjects were measured using a defined coordinate system.After the linear regression analysis,all coordinate parameters were expressed in the form of a function(formula).With the input of a specific ECW,the shape of the prosthesis can be generated according to the coordinates with respect to each formula.Only one dimension—the ECW—is required before starting the fabrication process.This dimension can be easily and accurately measured on an anterior–posterior X-ray image of the knee joint.
Various methods for developing a population-based 3D model have been conducted,which require 2D radiographic images of patients as an input.Zheng and Schumann[27,28]reported a reconstruction method using a single radiographic image of the knee joint.Tang and Ellis[29]and Lamecker et al.[30]also developed reconstruction methods using bi-planar images as input.Zheng and Schumann[28],Tang and Ellis[29],and Sadowsky et al.[31]further developed reconstruction methods using multiplane images as input.

Fig.8.(a)Cadaveric trial with patient-specific instruments;(b)fitting of femoral component and tibial components;(c)range of motion of cadaveric knee after the installation of TKR prosthesis.
However,the methods described above are relatively less efficient for prosthesis pre-manufacturing because a number of X-rays with certain specifications are required.Furthermore,those methods can only reconstruct the actual 3D shape from 2D images.For patients with osteoarthritis,it is necessary to reconstruct the normal knee anatomy in a healthy condition.Our method can reconstruct the condylar surface in a healthy condition because only one dimension,the ECW,is used for the reconstruction,and normal knees are used for data collection during the measurement process.
The reconstructed femoral condylar surface in this study was compared with the femoral condylar surface in the original CT scanning data.The RMS PS distances among all data were(1.10±0.18)mm.This result is comparable to other femur statistical shape modeling methods.Other reports on the RMS PS distances of femur models included:1.00 mm from distal femur models using contours identification from bi-planar radiographs(Laporte et al.[32]);a range from 0.80 to 1.90 mm from 30 proximal femur models using a single radiograph method(Zheng and Schumann[28]);(2.34±0.82)mm from 20 distal femur models using a biplanar radiograph method(Tang and Ellis[29]);and(1.57±0.50)mm from 20 distal femur models using a multiple plane radiograph method(Tang and Ellis[29]).Apart from the femur modeling results,our study is comparable to pelvic statistical modeling results,including:1.60 mm from a pelvic model using contours identification from multiple radiographs in a semi-automated method(Lamecker et al.[30]);and 2.08 mm from 110 pelvis models using a multiple plane radiograph method(Sadowsky et al.[31]).Theoretically,the more models are included in the study,the more accurate it will be.However,Zhu and Li[26]have suggested that when the number of models is greater than 25,the predicted result of the 3D model is similar.We can conclude that with a single-dimension parameter—the ECW—as the input,our distal femur surface reconstruction accuracy is comparable to those of studies using multiple plane radiographs as input.
Conventionally,a patient-specific prosthesis is designed based on the contralateral side of the patient.Adoption of the contralateral side for patient-specific prosthesis design in different parts of the body has been reported[33–35].Innovatively,as described above,the prosthesis design method described in this study can represent not only an individual patient,but a number of subjects from the same population.The contralateral side image of the patient is thus not required.In other words,the prosthesis is designed based on the measured 52 subjects rather than on the contralateral side of the patient.In cases of bilateral deformity or patients suffering from trauma,the contralateral side of the body may not be available,making it difficult to design a patientspecific prosthesis to treat these patients.The suggested method can help in designing prostheses for them.
Furthermore,a conventional patient-specific prosthesis is designed based on CT images or magnetic resonance(MR)images.In the method proposed in this study,CT scans and MR scans are not needed,drastically reducing the time and cost of scanning.Only one dimension,the ECW,is required to design the prosthesis,and this can be easily and accurately measured on an anterior–posterior X-ray image of the knee joint.This is a practical approach for prosthesis manufacturing,as a prosthesis manufacturer can pre-manufacture prostheses with different ECW values.
4.2.Comparison of posterior condyle reconstruction and PG reconstruction
Among the reconstructed surfaces on the distal femur,it was found that the RMS PS distances on the posterior condylar region—that is,the posterior cylinder marking region—was(0.98±0.30)mm,which was less than that of the PG region,at(1.23±0.27)mm(Fig.5).In the methodology section,we have separated the posterior cylinder region as the region posterior to the horizontal tangential line of the top intercondylar notch arc.
This phenomenon can be explained by two reasons.First,the measurement parameters were taken based on the posterior condylar cylinder,including the coordinate system development.The points taken near to the posterior cylinder are therefore more accurate.According to our recent study[19],the NPCA is more reliable than the clinical epicondyle axis(CEPA)in the determination of the axial femoral alignment for varus knees.In that study,all of the angles relative to the NPCA were narrower in range and smaller in SD than those relative to the CEPA.These results indicated that the NPCA was more reliable than the CEPA as a reference axis in determining the axial and rotational alignments for the TKA surgery of varus knees.The NPCA was also a more reliable reference than the CEPA in defining the coordinate system of the lower limb or knee joint for anthropometrical studies.A recent study reported that the shape and alignment parameters exhibited partial influence on the morphology[18].That study suggested that conducting a morphometric analysis based on trochlear groove classification may be helpful for the future design of individualized prostheses,which echoes the results from our study.
4.3.Comparison of surface matching between the current study and commercial prostheses
Precise matching of the prosthesis and bone resection surface is critical for TKA surgery[1].However,due to the inadequacy of available sizes of prostheses and the lack of incorporation of the anthropometric characteristics of Chinese knee data into the design of prostheses,a number of patients have been reported to be not matched with available prostheses[2,4].An undersized prosthesis will lead to prosthesis subsidence[36,37],while overhang of the component will result in soft tissue abrasion and,ultimately,operation failure[36].
To validate the effectiveness of using a Chinese-populationbased method for designing the femoral component,two Caucasian-based commercial knee prostheses were selected for an accuracy comparison of the distal femur surface matching.The two commercial products were uniformly scaled so that the femoral anterior–posterior length was the same as that in the individual CT scanning data.The global registration method,a function provided by Mimics 18.0 software,was used to move the prosthesis to the position where the condylar surface on the femoral component fit best with the distal femur in the scanning data.The femoral component designed by this study resulted in the highest accuracy(RMS PS,(1.08±0.20)mm)of the three products,in comparison with the Mobile Bearing Model((2.00±0.50)mm)and the Posterior Stabilizing Model((2.11±0.41)mm).The femoral component designed in this study also performed better than the commercial femoral components in posterior condylar matching((0.98±0.30)mm)and PG matching((1.23±0.27)mm).These results show that the implant design method suggested by this study can permit the fabrication of femoral components with better surface matching for Chinese knees.The femoral component can provide good bone coverage and prevent patients from soft tissue impingement[25].The incorporation of better anthropometric data can also improve the stability and longevity of the implant[28],and may reduce the potential need for revision surgery[30].
4.4.Volume of bone resection
Minimizing bone loss is one of the most important challenges for either primary or revision total knee replacement surgery to improve fixation[38,39].The volume of bone stock is critical for possible revision reconstruction surgery in the future.Therefore,preserving the bony structure of patients can avoid challenging future revision procedures.Furthermore,Lombardi et al.[4]reported that intra-operative femoral condylar fracture can be avoided by unnecessary bone resection.Another study by Luke et al.[39]showed that reducing the bone resection volume could improve bone density.
From the results,the bone resection volume of the populationbased group was similar to that of the Posterior Stabilizing Model group and lower than that of the Mobile Bearing Model group.The smallest amount of average resected bone volume was recorded from the current study(27 412 mm3),which was smaller than those from the Mobile Bearing Model(30 647 mm3)and Posterior Stabilizing Model(28 138 mm3).More bone was preserved for the samples.These results echoed those of the surface matching analysis.Although we cannot prove the clinical effect of applying the suggested prosthesis,it can be concluded that the design can preserve more bone,and that fewer complications would result once revision surgery is needed[4].
Although the results showed that our model had a better surface matching accuracy with the distal femur and a lower bone resection volume than commercial prostheses,it did not show a direct relationship between surface matching accuracy and bone resection volume.Because the surface matching accuracy of the Mobile Bearing Model was better than that of the Posterior Stabilizing Model,the bone resection volume for the Mobile Bearing Model was recorded as being greater than that of the Posterior Stabilizing Model.This could be explained by the assembling approach conducted in this study.We used the best matching position of the prosthesis by using the global registration method.The actual assembly position during surgery might be slightly different depending on the assembling design of the prosthesis.That would affect the bone cut volume.
4.5.Study limitation
The samples used in this study were Southern Chinese.The anthropometry of Southern Chinese people may be different from that of Chinese people living in other districts.In future,we will recruit samples from different parts of China so that our data can be more representative of the Chinese population.In addition,we will include not only Chinese data,but also Caucasian data so that our measurement and design procedures would be more consistent.
In this study,all of the prosthesis design and the 3D anatomical models came from CT images segmentation.This process was done manually.Segmentation error may occur at unclear tissue boundaries.This was also due to the limitation of image quality,which was not fine enough to differentiate the structures in some edge regions.This would cause inaccurate 3D bone models,thus affecting measurement parameters.
Due to the limitation of equipment,we did not manufacture the actual implantable knee prosthesis and conduct mechanical tests including a fatigue test,hardness test,and tribology test to evaluate the prosthesis design.
5.Conclusion
This study suggested a new approach for a population-based patient-specific femoral prosthesis design.With a single and easily acquired dimension,the ECW,as input,a patient-specific femoral prosthesis can be designed according to the analyzed measured data and manufactured by AM methods.A higher surface matching accuracy and a lower bone resection volume resulted when comparing our design with commercial models of a Caucasianbased knee.
Acknowledgements
This work was supported by the Shandong Weigao Orthopedic Device Co.,Ltd.(the company was not involved in data analysis).
Compliance with ethics guidelines
C.S.Chui,K.S.Leung,J.Qin,D.Shi,P.Augut,R.M.Y.Wong,S.K.H.Chow,X.Y.Huang,C.Y.Chen,Y.X.Lai,P.S.H.Yung,L.Qin,and W.H.Cheung declare that they have no conflict of interest or financial conflicts to disclose.
Appendix A.Supplementary data
Supplementary data to this article can be found online at https://doi.org/10.1016/j.eng.2020.02.017.
- Engineering的其它文章
- Process Intensification in Pneumatically Agitated Slurry Reactors
- New Standards Release Sets Stage for 5G Future
- Fundamentals and Processes of Fluid Pressure Forming Technology for Complex Thin-Walled Components
- Extreme Learning Machine-Based Thermal Model for Lithium-Ion Batteries of Electric Vehicles under External Short Circuit
- Progress in Research and Development of Molten Chloride Salt Technology for Next Generation Concentrated Solar Power Plants
- Evaluation Method and Mitigation Strategies for Shrinkage Cracking of Modern Concrete

