A Survey and Tutorial of EEG-Based Brain Monitoring for Driver State Analysis
Ce Zhang and Azim Eskandarian
I. INTRODUCTION
THE National Highway Traffic Safety Administration(NHTSA) reports that human errors were responsible for 94% of the fatal crashes in 2016 [1]. The driver’s state and physiological condition affect his/her ability to control the vehicle. Therefore, by monitoring the driver state, one can predict anomalies or the potential for error and hence devise methods to prevent the consequences of human error. There are two solutions for human error minimization: fully automated vehicles (SAE Level 5) and driver monitoring systems (DMS). The first option eliminates the problem by totally removing the driver from controlling the car. The second option aims to monitor the driver and the driving task and assist the driver (or both the driver and the vehicle) in overcoming potential errors or hazards. Even though level 5 automated vehicle-related research shows promising results,fully automated vehicles will not be ready for the road in the foreseen future [2], [3]. Therefore, DMS is crucial to reducing human errors at present. DMS belongs to the family of advanced driving assistance systems (ADAS). Nevertheless,unlike other ADAS functions measuring vehicle performance,such as lane detection/control and traction control, DMS directly measures the driver’s state and behavior during driving. Since the majority of human errors are driver distraction, inattention, fatigue, and drowsiness, most DMS are designed for driver cognitive state surveillance and driver attention improvement [4].
The DMS can be designed for applications or for research purposes. The application systems are designed for on-market vehicles. Hence, they are compact and economical but have limited driver state detection ability. Application-based DMS were found first in Toyota and Lexus in 2008 [5]. They use a camera to monitor the driver’s face and eyes, as shown in Fig. 1(a). Once the driver’s eyes are closed and the face is not facing forward, the DMS starts to warn the driver and decrease vehicle speed. A similar device was also designed by BMW (Fig. 1(b)) named as “Driver Attention Camera” [6].The BMW monitoring system can detect whether the driver’s eyes are focused on the road. In addition to eye and face tracking, a pressure sensor was developed and applied on Tesla to force the driver to put his/her hands on the wheel while driving [7]. Currently, most application-based DMS apply simple algorithms that can only detect drivers’ physical behaviors instead of drivers’ cognitive states, such as“daydreaming” and distraction during driving. The DMS designed for research are more complex and expensive but can detect different types of driver states. Research-based DMS employ different sensors for surveilling and analyzing driver behavior. Popular sensors include electroencephalography (EEG), eye tracker, body motion tracker, handgrip sensor, electrocardiography (ECG), and electromyography(MEG). These sensors are complex to analyze and expensive but can provide more comprehensive information about the driver’s driving condition and driver state.
Among all the research-based DMS sensors, EEG is one of the most effective driver state monitoring devices. The main reasons are that i) EEG collects human brain signals, which directly measure drivers’ cognitive states and thoughts[8]–[10], and ii) EEG signal temporal resolution is high,which can provide more neural-related activity from the driver[11]. Therefore, for research-based DMS, researchers usually apply EEG signals not only for driver state but also as an evaluation baseline, such as finding correlations between the EEG results and eye gaze signals or correlations between the EEG results and ECG signals in driver’s state detection [12],[13].
The history of EEG-based driver condition studies can be traced back to the early 1980s. M. Lemke proved that driver vigilance decreases during long-term driving through EEG measurement [14]. Idogawaet al.compared a professional driver’s EEG signal with a regular driver [15]. They found that brain waves move from the beta to alpha domains in monotonous tasks such as driving. However, due to computational limitations and a lack of pattern recognition algorithm support, EEG-based driver studies did not become popular until the start of the 21st century. Lalet al.developed a LabVIEW program to categorize driver fatigue levels based on different brain rhythm spectra [16]. In 2013, Göhringet al.collected and processed driver EEG signals that successfully controlled a vehicle through the brain at the low speed [17].Presently, EEG-based driver state studies have become systematic in both the study of interest areas and data analysis.The study areas can be categorized as driver distraction/inattention, fatigue/drowsiness, and intention study [18], [19]. The objective of the driver distraction/inattention study is to evaluate and classify driver distraction levels under different types of nondriving-related tasks (secondary tasks).Researchers instruct testing subjects to conduct one or multiple secondary tasks, such as texting, talking, or watching videos while driving [20]. Additionally, the EEG device collects the subject brain signal. Both EEG signals and vehicle performance are used as evaluation references. The distraction detection accuracy varies greatly among every literature because of different experimental environments, subjects, and processing algorithms. The driver fatigue/drowsiness experiments study and classify driver fatigue levels during driving. To reach to a drowsiness state, testing subjects are usually required to drive for an extended period (70–90 minutes) at a specific time (midnight or afternoon). “Vehicle lane departure,” reaction time when facing emergency conditions, and EEG signal results are usually applied for drowsiness level evaluation [21]. The detection accuracy also varies among different studies, but most research results indicate that the higher the drowsiness level is, the more steering movement exists [22]–[24]. Driver intention studies are mostly focused on driver brake intention studies. Driver brake intention experiments can be categorized into two types.The first type of braking study aims to find driver reaction time among different ages, sexes, or driving conditions[25]–[28]. The second type investigates the time difference between the brain brake intention and actual driver brake action [29]–[32]. In the second type of experiments, numerous braking warning systems can be designed based on either improving brake intention or minimizing the abovementioned time difference. Since driver state analysis contains fatigue and distraction studies, most experiments are conducted under a lab environment with a driving simulator, as shown in Fig. 2.However, several experiments are conducted using a real vehicle under the real-world environment, such as the brake intention experiment [32]. Fig. 3 presents a summary of several representative studies in EEG-based driver state studies in recent years. The EEG data analysis method is a data-driven study predicting driver behavior based on previously collected data through machine learning techniques. A flowchart of a typical EEG-based driver behavior data analysis is presented in Fig. 4 . The signal preprocessing step is designed for noise reduction and artifact removal. The feature extraction extracts spatial, temporal, and frequency features for model development. The classification step builds a mathematical model based on the training data.The details of these methods are discussed in the remaining sections of this article.

Fig. 2. (a) Vehicle-based simulator; (b) Desktop-based simulator.

Fig. 3. EEG-based driver state study representative literature.
As illustrated above, EEG behavior on driver condition has been studied for over three decades, and numerous data processing and model development techniques exist. The studies for EEG features and classification have also evolved from simple time or frequency domain analysis to statistical analysis based on big data. The objective of this paper is to document and review the majority of well-known data processing methods and experiments for EEG responses in driver condition-related research. In Section II, an overview of the EEG signal collection apparatus and methods are briefly illustrated. In Sections III–V, the EEG data preprocessing,feature extraction, and data classification algorithms are explained in detail. In Section VI, we demonstrate and summarize EEG data processing research on driver conditions and predict their future development.
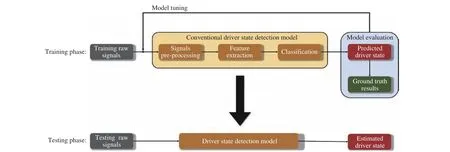
Fig. 4. EEG-based driver state study workflow.
II. EEG SIGNAL COLLECTION METHODS
A typical EEG signal collection system is composed of a signal acquisition cap, an amplifier, and a data storage device,as shown in Fig. 5. After data collection, corresponding data analysis software is used for data postprocessing. For the amplifier, most EEG-based driver state studies employ a commercially designed amplifier such as gUSBamp [30]. For data storage devices, laptops, or microprocessors such as Raspberry Pi are popular options. For data analysis software,there exist either commercial software such as for BrainVision Analyzer-related products or open-source data reading and analysis toolboxes such as EEGLAB and OpenBCI [31]–[33].The abovementioned devices are standard in EEG driver staterelated research, and the results are not significantly affected by alternative selections. However, for signal acquisition caps,different types of devices can cause distinct experimental results. The remaining paragraphs in this section introduce the EEG signal acquisition system categorization and the corresponding properties.
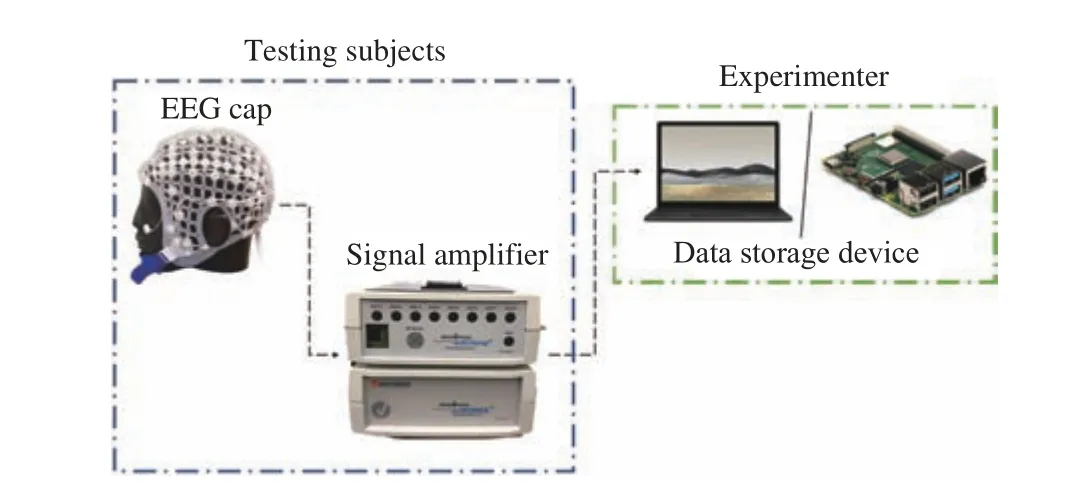
Fig. 5. EEG signal collection system.
Most EEG signal acquisition systems applied in driver state studies can be categorized as dry electrode vs. wet electrode and wire communication vs. wireless communication. In addition, several researchers use a remote headband for EEG signal collection. The next paragraphs explain the details of every categorization.
A. Wet Electrode vs. Dry Electrode
Wet and dry electrode EEG caps are shown in Fig. 6. The wet electrode is made of silver or silver chloride material,which is commonly used in lab environments. The dry electrode uses stainless steel as a conductor to transmit the microvolt signals from the brain surface to the EEG amplifier.Compared with dry electrodes, electrolytic gel must be injected between the electrode and subject brain surface to increase the signal impedance and improve accuracy. Hence,the experimental procedure for the wet electrode EEG cap is more complicated than that for the dry electrode. Moreover,both the EEG cap and subject’s head need to be cleaned after every experiment, which is time-consuming and inconvenient.However, according to Mathewsonet al.[33 ], wet EEG electrodes exhibit less noise than dry electrodes, and the root mean square (RMS) results for brain event detection are lower than the ones with dry electrodes. Therefore, from the perspective of driver study, the wet electrodes fit simulatorbased research better, but the dry electrodes are more convenient under real-world driving conditions.
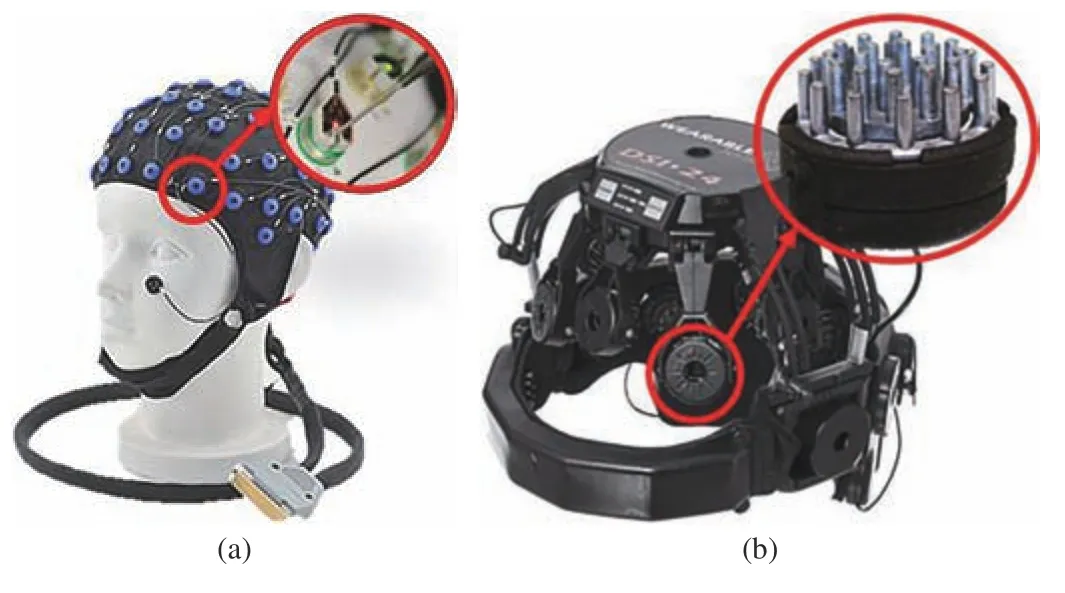
Fig. 6. (a) Wet electrode; (b) Dry electrode.
B. Wire Connection vs. Wireless Connection
The wired and wireless connections mentioned in this paragraph are discussed in the scope of connectivity between the EEG cap and the amplifier. The wired connection-based EEG cap has redundant wires, which are easily broken by the subject during driving events. Besides, cable sway during driving can cause motion artifacts that affect the EEG collection accuracy [34]. For EEG wireless connections, the most popular connection method is through Wi-Fi. Wireless connections are more convenient and compact because they eliminate redundant wires. However, the main drawback of wireless EEG devices, based on the research results of Töröket al., are the electrical noises during wireless transmission[35]. When external electrical effects exist, the EEG signals collected by the wireless method are contaminated. The other drawback of wireless connections in driver state studies is the loss of connections. Presently, communication stability and loss of information under real-world driving conditions are still the most important challenges in connected vehicles [36].Hence, using a wireless EEG cap could experience loss of information problems. Therefore, at present, a wired connected EEG signal cap for driver state study is still a better choice due to the accuracy and completeness of signal information.
C. Traditional Electrode vs. Headband
Currently, most traditional electrodes and headband positions are based on the 10–20 international system electrode positioning standard that was adopted around 1958[37]. However, the traditional EEG cap can collect signals among the whole brain region, while the headband can only collect signals from the forehead, as shown in Fig. 7. Since the traditional EEG cap collects multiple channel signals, it can detect more brain activities. Typical selection about the number of channels for driver state study is 21, 32, and 64 channels. Among these channels, the C3, Cz, and C4 electrodes are most important because they measure the area that is in charge of the driver’s thought and motor movement[38]–[40]. Furthermore, after multidimensional data are obtained, several advanced data processing techniques can be applied for analysis, which is illustrated in the following sections. However, multidimensional data analysis is a double-edged sword. Multidimensional data processing requires advanced signal processing knowledge, and the computational load can be extremely high. In contrast to traditional electrodes, the headband only collects four channels from the human forehead, and the price is lower compared with most EEG signal acquisition systems. Foonget al.employed a muse headband for driver vigilance detection [41], [42]. Although the headband can detect brain activities, the device accuracy and robustness still need to be verified.
III. EEG SIGNAL PREPROCESSING
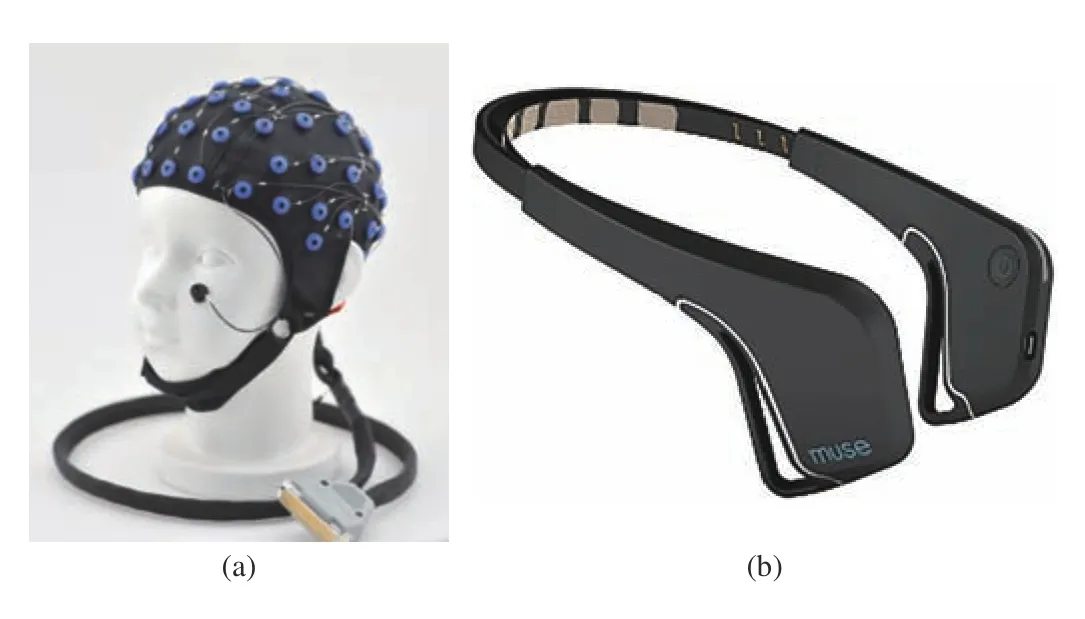
Fig. 7. (a) Traditional electrode cap; (b) Headband.
The objective of signal preprocessing is artifact removal.According to Sazagar and Young, there are two types of EEG artifacts, non-physiological and physiological [43]. The nonphysiological artifacts are mainly caused by the EEG amplifier, external noises, and electrodes. Usually, in the context of EEG-based driver state studies, non-physiological artifacts are removed by a linear bandpass filter with bandwidth ranges from 1 to 50 Hz. Physiological artifacts are generated by testing subjects and can be categorized as ocular,muscle, and cardiac artifacts [44]. In the context of driver state studies, muscle and ocular artifacts commonly occur and must be removed. Unlike non-physiological behavior, the abovementioned artifacts can be considered a measure of subject behavior, and the majority of them exist in a similar bandwidth with the desired EEG signals. Thus, the identification and removal of these artifacts require a more complicated data analysis algorithm. Table I tabulates a summary of several popular artifact removal algorithms that are employed for driver state analysis applications. In the remaining paragraphs,these algorithms and their corresponding alternative forms are illustrated in detail.
A. Independent Component Analysis
ICA is a blind source separation algorithm for multivariate signal processing. Two major assumptions for ICA are as follows: first, the mixture signals are composed of several statistically independent components; second, the relationship between the mixture signals and every independent component is linear. Thus, the ICA equation is

where (1) is the reconstruction formula and (2) is the decomposition function. In these equations,Xis the collected multichannel EEG signal matrix withnchannels andksamples,Sis the independent component matrix with userdefinedmcomponents,Wis the transformation matrix, andAis the pseudoinverse of theWmatrix. ICA is an unsupervised learning process, and the transformation matrixWis acquired through multiple iterations. Vigárioet al.proved that the application of the ICA algorithm for ocular artifact removal in EEG signal processing is feasible [45]. In their algorithm, eye activity and brain activities are separated by amplitude kurtosis. Even though the ICA algorithm can separate ocular artifacts effectively, the algorithm’s computational load is high, and the detection process is manual. Therefore, there exist several modified ICA algorithms to achieve faster processing speed or enable automatic detection.
1) Improved Processing Speed
The key reason for the high computational load of the ICA algorithm is a lack of prior knowledge input. As mentionedabove, ICA is an unsupervised learning algorithm that requires the computer to estimate every weight factor through multiple iterations. Thus, employing EEG artifact prior knowledge is an effective method for decreasing the computational load. Huet al.modified the ICA by adding reference signals [46]. With the help of reference signals, only desired components are analyzed, which improves the processing speed. Akhtaret al.proposed a spatially constrained ICA (SCICA) [47]. In this algorithm, only artifact-related components are extracted, which decreases the computational load and achieves a high extraction rate as well.

TABLE I EEG ARTIFACT REMOVAL ALGORITHM METHODOLOGY SUMMARY
2) Automatic Detection
To solve the automated detection issue, Baruaet al.proposed an automated artifact handling algorithm (ARTE) to automatically detect and remove artifacts through ICA [48]. In their paper, wavelet decomposition and hierarchical clustering methods are combined with ICA. The use of wavelet decomposition extracts 2-second segments, and the application for hierarchical clustering automatically separates artifacts from EEG signals. According to the comparison results with other state-of-the-art algorithms, the ARTE outperforms other algorithms and is suitable for artifact removal for EEG signals collected in a naturalistic environment. Winkleret al.also proposed an automatic ICA artifact detection algorithm [49]. During the ICA, they take the temporal correlations, frequency, and spatial features as detection factors.
In summary, the present modified ICA algorithms can automatically detect and extract ocular artifacts, and the computational speed is improved by adding prior artifact knowledge as input. Nevertheless, since ICA is based on estimation, ocular artifacts cannot be completely removed. In the future, how to maximally remove all physiological artifacts still needs to be resolved.
B. Canonical Correlation Analysis (CCA)
CCA is also a blind source separation algorithm. However,the goal of CCA is to seek the maximum correlation between two multivariate datasets. More specifically, assumeXandYare two collections of the dataset. The CCA algorithm attempts to find vectorsaxandaysuch that

where ρ is the correlation factor betweenaxXandayY. By taking the derivative of (3) with respect toaxanday, the maximum correlation factor yields

whereCxxandCyyare the autocovariance ofXandY, andCxyandCyxare the cross-covariance betweenXandY. The CCA algorithm was first applied for EEG muscle artifact removal by De Clercqet al.[50]. In that paper, two data matricesX(t)andY(t) were selected for CCA, whereX(t) is the time-series brain signal andY(t) was a one-sample delayed version ofX(t). According to their signal-to-noise ratio comparison test,the CCA algorithm outperforms ICA and the low-pass filter method for muscle artifact removal. However, the conventional CCA algorithm requires manual labeling for muscle artifacts. Thus, several improved CCA algorithms have been aimed at achieving automatic detection. In addition,since CCA requires less computation load, there are some algorithms to modify the CCA algorithm and implement it for real-time artifact detection and artifact removal.
1) Automatic Detection
To achieve automatic detection, prior knowledge of the EEG artifacts is required. Jananiet al. improved the conventional CCA method by combining EEG spectral knowledge for automatic detection [51]. They employed spectral slope analysis for artifact detection and set a threshold for the correlation coefficient to remove several components.The experimental results proved that the modified CCA algorithm could remove high-frequency muscle contamination. Soomroet al.combined empirical mode decomposition(EMD) and CCA for automatic eye blink artifact detection[52]. The EMD was used as a signal decomposition algorithm to detect the eye blink template. After that, CCA was applied to remove those artifacts. Experimental results indicated that the EMD-CCA algorithm could be easily adjusted and applied to every EEG electrode.
2) Real-Time Processing
Compared with ICA, CCA requires a lower computational load. Hence, it is easy to implement for real-time artifact removal processing. Gaoet al.applied CCA for real-time muscle artifact removal [53]. Based on their results, the CCA for muscle artifact removal outperforms the ICA algorithm.Linet al.proposed a real-time artifact removal algorithm based on CCA [54]. They applied the CCA algorithm to decompose the EEG signal and used a Gaussian mixture model to classify artifacts. This algorithm is helpful in driver state studies because it can detect artifacts commonly occurring during driving, such as eye blinks and head/body movement.
In general, the CCA algorithm can accurately remove muscle artifacts and requires a lower computational load.Besides, there are built-in libraries such as “canoncorr” in MATLAB and open-source packages in Python (“scikitlearn”) [55], [56]. The implementation of CCA for artifact removal in EEG-based driver state studies is convenient.
C. Wavelet Transform (WT)
WT can be considered as an alternate form of Fourier transform. Instead of transforming every piece of the signal into a sine wave, the WT applies a specific waveform to decompose signals. WT can be categorized as a continuous and discrete wavelet transform (CWT/DWT). CWT is a signal processing technique for nonstationary signal time-frequency analysis, and DWT is commonly applied for signal denoising and artifact removal [57]. For DWT analysis, the input signal is decomposed into detail, and approximate information with a high-pass and a low-pass filter, respectively, and the formula is

whereg[n] is the low-pass filter, andh[n] is the high-pass filter. For multilevel decomposition, the approximate information is selected for next level decomposition, and the detailed information is expressed as the level coefficient, as shown in Fig. 8. After wavelet decomposition, a threshold is applied to discard signals with artifacts. This algorithm brings up two concerns: first, how to select the mother wavelet and the number of decomposition levels; second, how to avoid over-filtering.
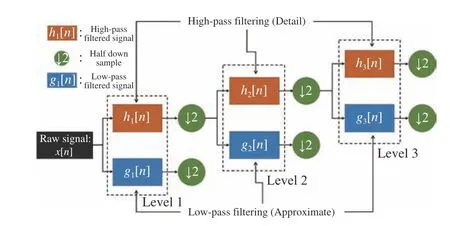
Fig. 8. DWT 3 level decomposition flowchart.
1) Decomposition Level and Waveform Selection
For DWT, the choice of waveform and decomposition level is critical for artifact removal effectiveness. Unfortunately,there is no exact answer to the number of decomposition levels and waveform choices because human subjects and experimental conditions are varied, which strongly affects artifact behavior. Thus, these values need to be determined according to specific experiments. Khatunet al.compared different wavelet performances for ocular artifact removal[58]. The “Symlet,” “Haar,” “Coiflet,” and “Biorthogonal wavelets”, as shown in Fig. 9 , are used for wavelet decomposition, and the decomposition level is set to eight.The results indicate that coif3 and bior4.4 are more effective.In a Krishnaveniet al.ocular artifact removal study, she found that a 6-level Haar wavelet transform outperforms the other state-of-the-art DWT algorithm [59]. Even though the number of levels and wavelets are hard to determine, it is clear that the decomposition level needs to achieve the desired frequency range and the mother wavelet needs to be similar to the signal.

Fig. 9. Common wavelet functions for the EEG DWT algorithm.
2) Overfiltering Avoidance
The ocular artifact exhibits spectral properties similar to those of the EEG signals. When dealing with ocular artifact removal, the DWT algorithm has the potential to remove not only EOG artifacts but also useful EEG information.Therefore, to avoid over-filtering, the DWT algorithm is often combined with other source separation algorithms. ICA is a popular choice because it helps with removing the most useful EEG information from the artifact components. The details about the ICA and DWT combination algorithms are explained in the hybrid detection section.
D. Regression Analysis
Regression analysis is a statistical method for exploring the relationship between multiple variables of interest. In the context of EEG artifact removal, the variables of interest are EEG signals and artifacts. The assumption for regression analysis is that the measured EEG signal is composed of pure EEG and artifacts. as shown in

whereEEGmeasureis the collected EEG signal,EEGcorrectis the ground-truth pure EEG signal,EOGis the ocular signal,andpis the weighted factor. The objective of regression analysis is to estimate the weighted factors so that the estimated “pure EEG signals” are close to the ground truth.Unlike blind source separation, regression analysis requires one or more reference channels. The regression technique for removing theEOGartifact can be achieved by either time or frequency domain analysis [60], [61]. Both domains could achieve good results, but time-domain analysis can achieve betterEOGartifact removal performance with an appropriate choice of an adaptive filter [44].
The advantages of regression analysis are easy modeling,and the computational load is extremely low. Since there exist one or multiple reference channels, EEG artifacts can be easily extracted based on those references. However, in some EEG experiments, reference channels are not available. Even though the reference channels are obtained, the EEG signals are usually also contained in those channels. Therefore, for present studies, blind source separation algorithms such as ICA, CCA, and wavelet transform are more popular than regression analysis.
E. Hybrid Detection Methods
All the algorithms have advantages and drawbacks.Therefore, combining those algorithms to overcome those drawbacks and mutual beneficiation is the trend for the current artifact removal study. Jianget al.conducted a comprehensive review of several hybrid detection methods[44]. In this section, we briefly introduce the ICA and DWT combination method, regression analysis, and ICA combination method because they are commonly applied in EEG-based driver state studies.
1) A combination of ICA and DWT
Both ICA and DWT algorithms can cause over-filtering issues [62]. After typical ICA processing, the extracted artifact components usually still contain the remaining EEG signals.Thus, removing the entire component may cause a loss of EEG information. A similar issue also occurs in DWT processing because some artifacts, such as ocular artifacts,share similar spectral properties with the desired EEG signals.Therefore, some studies attempted to combine ICA and DWT to determine whether these two algorithms can mutually benefit each other.
Baruaet al.combined the ICA and DWT to automatically remove EEG artifacts [48]. In their paper, wavelet decomposition was applied to the recorded EEG signals for several 2-second segment signals. After wavelet decomposition, the ICA algorithm was applied to remove EEG artifacts. According to their results, the ICA and DWT combination algorithm exhibited better artifact removal effectiveness. Issa and Juhasz also combined ICA with wavelet decomposition to prevent over-filtering issues [63].They conducted ICA first and used DWT to decompose extracted artifact components. With this improved algorithm,the artifact cleaning results outperformed other state-of-art artifact removal algorithms.
However, the computational load for the ICA and DWT hybrid detection algorithm is high. In EEG-based driver state studies, the ability for real-time processing is required.Therefore, improving this hybrid detection algorithm processing speed is an interesting but challenging study for the future.
2) A combination of Regression Analysis and ICA
Similar to the DWT and ICA combination algorithm, hybrid detection with regression analysis and the ICA method also tries to avoid over-filtering issues. As mentioned above, the artifact components after ICA decomposition may still contain neural-related activities. For regression analysis, the selected reference channels may also provide useful EEG information.Therefore, combining the ICA and regression analysis can avoid eliminating too much desired neural information.
Mannanet al.proposed an automatic artifact identification and removal algorithm based on ICA and regression analysis[64]. ICA was first applied for component decomposition, and then regression analysis was used for artifactual components.Since they assumed that artifactual components contain few neural activities, regression analysis-based artifact removal can minimize the error of over-filtering.
IV. EEG FEATURE EXTRACTION METHODS
Feature extraction is a term in machine learning that obtains desired information from redundant noisy signals [65]. Since EEG signals are nonstationary and usually collected in high dimensions, feature extraction is necessary for filtering and dimension reduction. In an EEG-based driver state study,feature extraction algorithms based on temporal, frequency,and spatial domains are employed to obtain driver condition features based on prior known EEG features, as shown in Table II and Fig. 10. In this section, we introduce common EEG features applied in driver state studies and then illustrate corresponding feature extraction algorithms.

TABLE II EEG DRIVER STATE RELATED FEATURES SUMMARY
A. Common Driver-Related EEG Features
In this section, the event-related potentials (ERPs) and the event-related desynchronization/synchronization features in the temporal domain (ERD/ERS), EEG rhythms in the frequency domain, and brain lobe locations in the spatial domain are illustrated.
1) ERP and ERD/ERS
ERP behavior is a small electric voltage change that can be measured by EEG in response to the motor or cognitive event stimuli. Since EEG collected signals are contaminated by artifacts, averaging over multiple experimental trials is necessary to observe clear ERP results, as shown below:

Fig. 10. Literature distributions for common feature extraction algorithms.

whereNis the total number of trials,xraw(t,m) is themth trial signal, andxclear(t) is the averaged ERP result. Different waveforms exhibited in ERP behavior represent different brain events. The P300 waveform is one of the most popular waveforms for studying driver inattention and driver fatigue.Detailed descriptions of P300 and other typical waveforms are documented in Sur and Sinha’s study [66]. The primary benefit of ERP is the ease of calculation and observation.However, the ERP feature is both time-locked and phaselocked to brain stimulus events.
According to Pfurtscheller’s research, ongoing EEG can also be processed for brain cognitive or motor events [67].Then, he introduced the ERD/ERS features. The calculation of ERD/ERS contains bandpass filtering, squaring sample amplitude (power samples), and averaging the power samples across all trials. The ERD/ERS behavior could be observed through both the time domain and spatial domain. The major benefit of the ERD/ERS feature is the non-phase-locked to the event.
2) EEG Rhythms
EEG data are nonstationary signals composed of different waves. Table III is a summary of different brainwaves and their corresponding mental states [68]. For the driver cognitive states study, alpha (8–12 Hz) and beta (12.5–30 Hz)are the most interesting and perhaps the most relevant rhythms, and the waveforms are presented in Figs. 11 and 12,respectively.

TABLE III BRAIN RHYTHMS AND THEIR CORRESPONDING MENTAL STATES
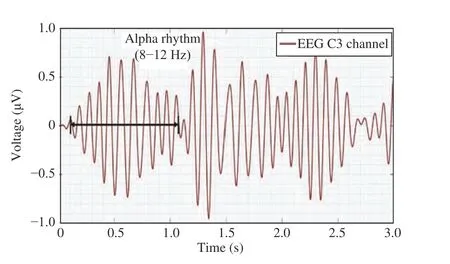
Fig. 11. Alpha waveform (Extracted from experimental data).
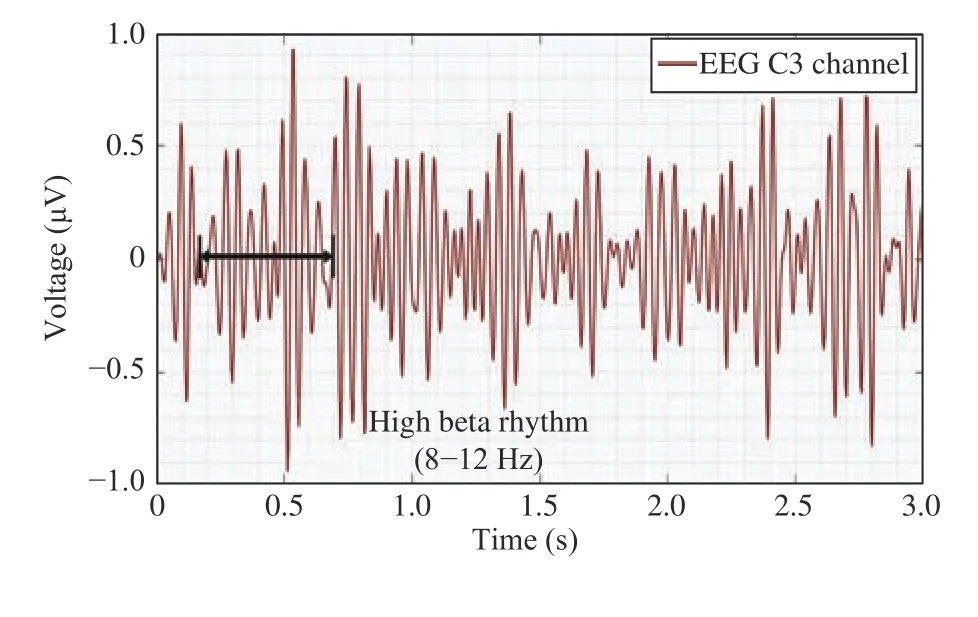
Fig. 12. Beta wave (Extracted from experimental data).
3) Brain Lobes
The human brain (Fig. 13) is composed of the forebrain,midbrain, and hindbrain [69]. The forebrain is one of the most important regions for EEG driver state study. The forebrain area can be categorized by four main lobes: the frontal lobe,parietal lobe, occipital lobe, and temporal lobe, as presented in Fig. 14 [70]. The overall functions of each lobe are tabulated in Table IV. In driver state studies, the frontal, parietal, and occipital lobes are the main areas of interest.

Fig. 13. Human brain composition.
B. EEG Feature Extraction Algorithm
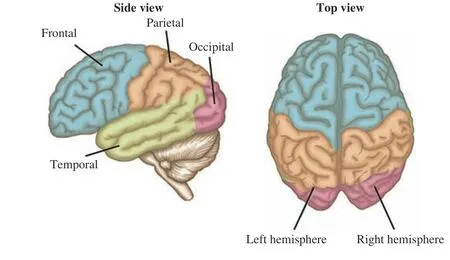
Fig. 14. Main lobes for human forebrain region.
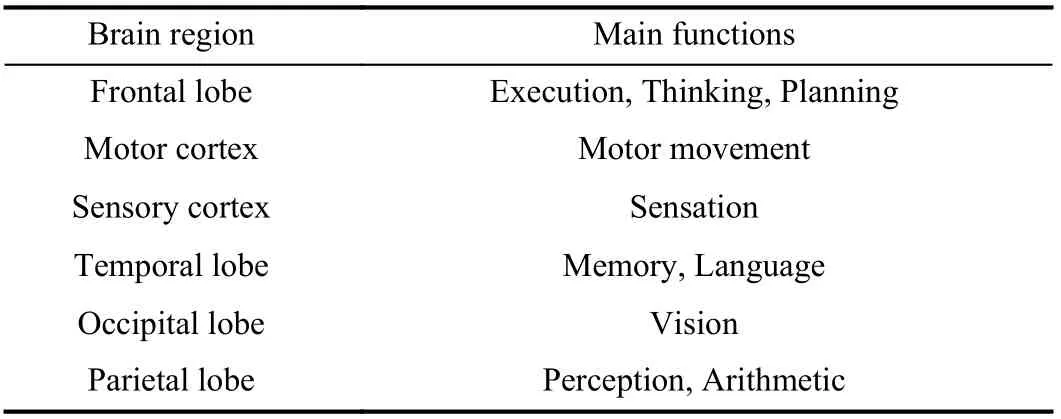
TABLE IV LOBES FUNCTIONS SUMMARY
The objective of the EEG feature extraction algorithms is to obtain uncovered features from temporal, frequency, and spatial domains for classification. According to the literature,the EEG-based driver state study feature extraction algorithm can be categorized as signal processing-based methods and statistical-based methods, as shown in Table IV. This chapter explains and evaluates every popular feature extraction algorithm tabulated in Table V.
1) Signal Processing-Based Methods
Signal processing-based methods employ classical signal analysis techniques to extract features from temporal,frequency, and spatial frequencies. Common spatial pattern(CSP) and spectral analysis algorithms are illustrated in this section.
a) Common spatial pattern (CSP)
Initially, the CSP algorithm was popular in human motor imagery analysis [71]. Currently, the CSP algorithm is widely employed in driver state studies because drivers’ thoughts and cognition are similar to motor imagery behavior. The objective of the CSP algorithm is to estimate a transformation matrix so that the transformed EEG signal dimensions are reduced, and the remaining signal variances can be distinguished between different classes. For instance, twoclass multidimensional EEG signals are processed by the CSP algorithm. After processing, the EEG signal dimensions are reduced to two. Moreover, class A transformed signal variance is maximized in dimension 1 and minimized in dimension 2, while the class B transformed signal variance is the opposite, as shown in Figs. 15(a) and 15(b). To obtain the CSP transformation matrix, the eigenvalues and eigenvectors of the covariance matrices from each class of EEG signals are required, which is explained in detail in [71]. The application of the CSP algorithm for driver state study is usually on driver intention and cognitive load analysis [72], [73]. The CSP algorithm requires less computation load and is easy to implement. However, the CSP algorithm has several challenges. The first challenge is how to convert it to multiclass feature extraction. The second challenge is how to improve feature extraction accuracy.
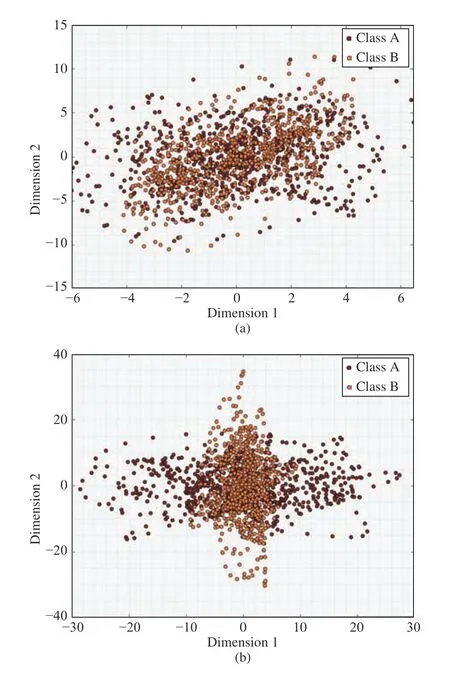
Fig. 15. (a) Two classes EEG signals before CSP; (b) Two classes EEG signals after CSP.
i) Multiclass CSP
One of the most natural methods to extend a feature extraction algorithm from binary class to multiclass is the“one versus rest” (OVR) technique. The OVA technique can be considered as an alternative form of a binary class algorithm because it considered one class as positive and all the other classes as negative. The OVR-based CSP algorithm was mentioned by Dornhegeet al., and the mathematical derivation was explained by Wuet al.[74], [75]. The other method for extending a conventional CSP algorithm to multiclass is joint approximate diagonalization (JAD) [76].The idea of the JAD-based CSP algorithm is to approximately diagonalize multiple covariance matrices for CSP transformation. The JAD-based CSP algorithm is widely used in driver studies because it improves the extraction accuracy compared with the OVR technique and has a relatively low computation load.
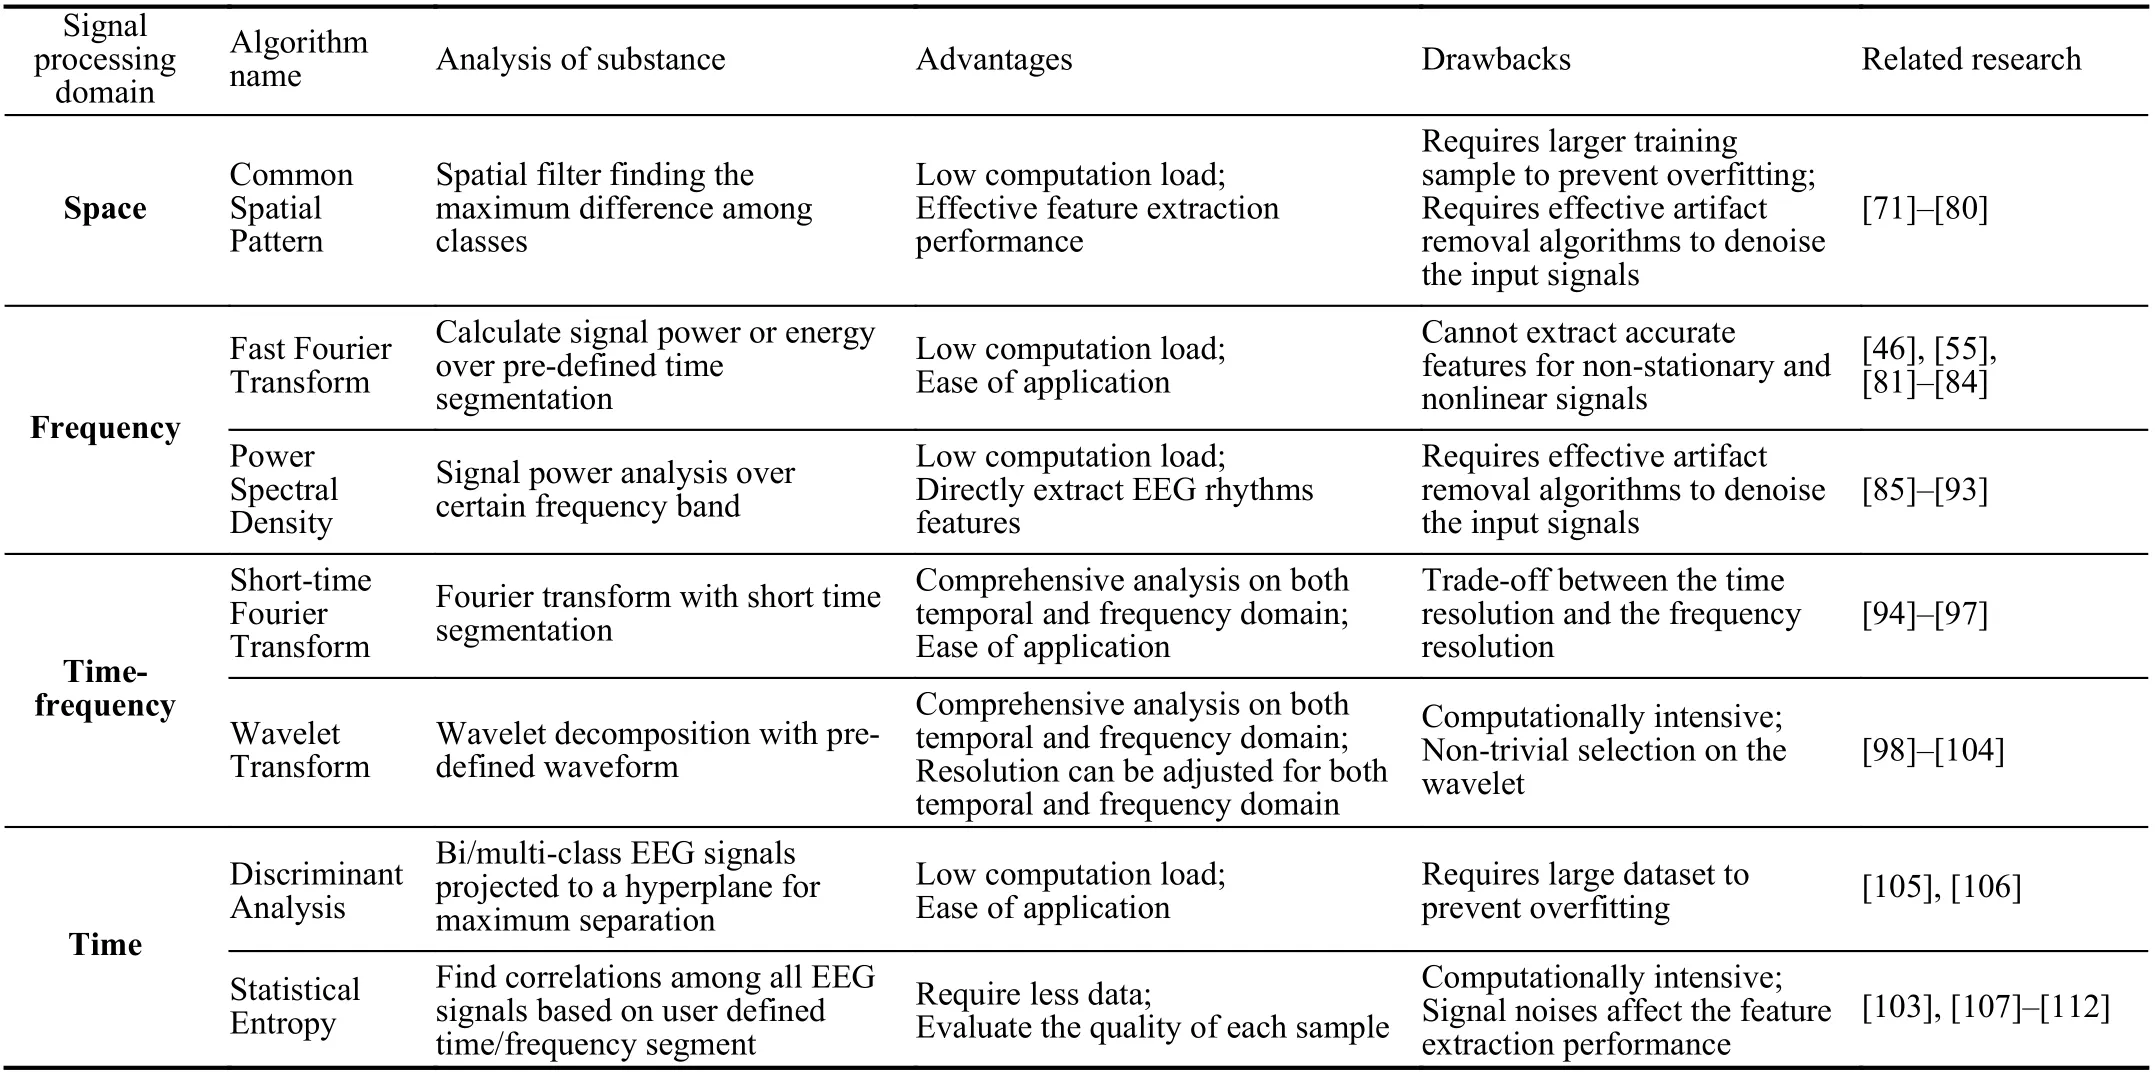
TABLE V EEG POPULAR FEATURE EXTRACTION ALGORITHM PERFORMANCE SUMMARY
ii) Extraction accuracy improvement
The CSP algorithm extraction accuracy can be improved by employing the filter bank technique, adaptive estimation, and nonparametric analysis. The filter bank-based CSP (FBCSP)was first proposed by Anget al.in 2008 for motor imagery[77]. Then, this algorithm was applied for driver cognitive load analysis. The FBCSP algorithm analyzes and extracts features from the EEG signals through different frequency bandwidths. In addition, every extracted feature from the frequency band is classified through a classifier. Comprehensive scanning and classification ensure that the FBCSP algorithm picks the best features. However, this process also increases the algorithm processing time, especially when the classifier is a nonlinear classifier. The adaptive-based CSP algorithm (ACSP) was proposed by Song and Yoon [78]. This algorithm combines the adaptive parameter estimation technique with the CSP algorithm to achieve better feature extraction performance. Costaet al.also designed an ACSP feature extraction algorithm [79]. They found that the ACSP algorithm is able to achieve similar classification results with fewer calibration sessions. The nonparametric analysis of CSP is based on the assumption of the non-Gaussian distribution of EEG data during driving [80]. According to the experimental results, the nonparametric analysis based CSP classification performance is 5% higher than that of conventional CSP.
With the abovementioned modification algorithms, the CSP feature extraction technique can extract driver state features effectively. However, the only constraint of all CSP algorithms is that the collected data must be multichannel because the CSP is a spatial filter-based feature extraction algorithm.
b) Spectral analysis
通过这些问题链使学生懂得数学知识是解决实际问题的工具。当然,数学问题的提出要有真实性、实用性、科学性、适应性,要由浅入深、环环相扣,使学生想解决、能解决。
As shown in Table IV, the spectral analysis contains fast Fourier transform (FFT), power spectral density (PSD)analysis, and time-frequency analysis.
i) FFT analysis
Fourier transform is one of the most common techniques to inspect signals in the frequency domain [81], as shown in whereG(f) is the signal in the frequency domain, andg(t) is the signal in the time domain. FFT is an efficient algorithm for processing the Fourier transform in discrete-time and discrete frequency (sampled frequency). When dealing with EEG data,the FFT algorithm transforms the time-series signal into the frequency domain, and the mean powers from different rhythms are selected as features. Huet al.conducted FFT analysis and used the dominant frequency, average power, and center of gravity of frequency as features to detect the driver fatigue level [46]. Wanget al.studied the mean power from FFT analysis to detect driver distraction [82].

The benefit of the FFT algorithm is its fast processing speed and ease of use. For instance, MATLAB has the built-in function “fft()” for fast Fourier transform, and in Python, the NumPy library also provides the “fft” function [55], [83].
The major disadvantage of the FFT algorithm is the loss of time-domain information. It is known that EEG signals are nonstationary [84]. Hence, the FFT transform cannot provide users with both temporal and frequency domain information for optimal spectral selection.
ii) Power spectral density (PSD)
The PSD algorithm measures the power density of the EEG signal over a certain frequency band selected by the user. For driver state studies, frequency bands ranging from 8 to 30 Hz(alpha and beta rhythms) are popular choices. The maximum value, variance, and mean are usually selected as features[85]. Fig. 16 presents PSD results from testing subject EEG data. According to Fig. 16 , the power density increases between 5 and 15 Hz (alpha and partial beta rhythm). PSD can be calculated through the FFT, Welch, and Burg methods.Mohamedet al.compared different PSD methods for driver behavior studies [86]. According to their experimental results,the PSD analysis with the Welch method performs better in the detection of driver fatigue.
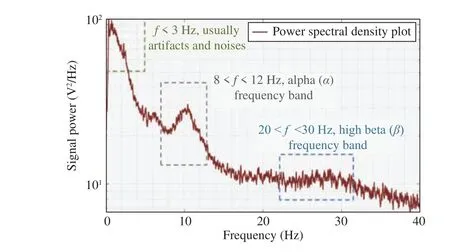
Fig. 16. EEG PSD analysis result.
The PSD algorithm analysis procedures are simple and ready for real-time processing, which makes it one of the most common EEG-based driver state feature extraction techniques[87]. In addition, numerous studies illustrate how to tune parameters such as the time window and overlap percentage to improve extraction efficiency [88]–[90]. However, conventional PSD methods are not suitable for short data segments and sharp variations in the spectra [91], [92]. For driver state analysis, data segments are short, and sharp changes in spectra exist. Therefore, the autoregressive model-based PSD analysis is introduced.
The autoregressive model (AR) is another approach for PSD analysis. The AR model is a linear regression-based method for future signal estimation based on the present and previous signals, as shown in

where φiis the corresponding AR parameter,Xt−iis the current and previous observations, and εtrepresents signal noise. The benefit of the AR model-based PSD analysis is its computational efficiency. Chaiet al.applied the AR model for driver fatigue feature extraction [93]. According to their results, the classification accuracy was above 90%.
iii) Time-frequency (TF) analysis
TF analysis is a spectral analysis method that presents the signal spectral power in both the time and frequency domains.Since EEG signals during vehicle driving are nonstationary,the TF analysis could provide comprehensive temporal and frequency domain information simultaneously about the driver’s state. The two most popular TF analysis methods are the short-time Fourier transform (STFT) and wavelet transform (WT). The STFT conducts a Fourier transform by selecting small time windows and composing all time windows together. The equation of the continuous-time STFT is
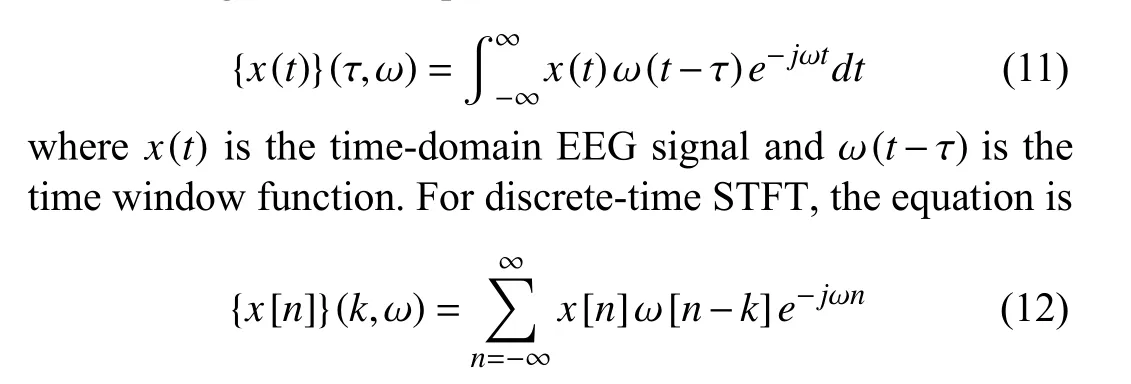
wherekis the time resolution, and the other parameters are the same as in (11). The theory of the STFT algorithm is straightforward, and the implementation is simple. Thus, the STFT algorithm is widely applied in EEG-based driver state studies [94]–[97]. However, in STFT analysis, there is a tradeoff between the time and frequency resolution. Both time and frequency resolutions are controlled by the selected time window. A large time window width provides a smaller frequency resolution but a larger time resolution and vice versa. Hence, some EEG information can be ignored with an inappropriate choice of time window width. Besides, the time window width remains constant during the entire processing period, which is a waste of time when the STFT processes a nonimportant frequency band or time band. The WT algorithm can overcome the abovementioned drawbacks. As mentioned in the preprocessing chapter, WT includes CWT and DWT processing. In the context of EEG-based driver state studies, DWT is commonly used for feature extraction. The DWT equation and processing procedures are shown in (5)and Fig. 8 , respectively. The determination of the DWT decomposition level is trivial, and the corresponding literature is tabulated in Table IV [98]–[104].
2) Statistical-Based Methods
Unlike signal-processing-based methods, statistical-based methods do not study signal dynamics but detect and extract EEG driver state-related features from a large amount of experimental data. Usually, the use of statistical analysis methods does not require too much prior knowledge about EEG features and driver-related EEG behaviors. However,without applying any prior knowledge about the signal may encounter a high computational load issue. In this section,discriminant analysis and statistical entropy analysis methods are illustrated.
a) Discriminant analysis
Discriminant analysis is a statistical technique to project samples with different classes to a hyperplane so that the distance between the data in each class and the hyperplane becomes maximum. Fig. 17 illustrates the discriminant analysis principal in the 3D animation.
Discriminant analysis is commonly applied for driver fatigue feature extraction. Linet al.employed a nonparametric feature extraction method for motion sickness detection study[105]. He also compared the nonparametric discriminant analysis method with the linear discriminant method and found that the nonparametric discriminant analysis exhibits 20% better classification performance than the LDA method[106]. According to the literature results, discriminant analysis provides excellent feature extraction performance.

Fig. 17. Discriminant analysis hyperplane and data presentation.

Fig. 18. EEG-based driver state analysis classification algorithm distribution.
b) Statistical entropy
Entropy, originally, was a measure of the disorder of a system in the thermodynamics field. In 1948, Shannon introduced the entropy theory into the information and signal processing field, which was named statistical entropy [107].The equation is

wherePiis the probability of caseiin the event. For EEG application, the entropy method is used for quantification of the similarity among every selected EEG pattern in either the time or frequency domain.
The most popular algorithms for statistical entropy analysis in the time domain are approximate entropy and sample entropy. The approximate entropy (AE) equation is

whereNis the length of the EEG data,mis the selected EEG segment data length, and Φmand Φm+1are the average of similarity fractions as shown below:
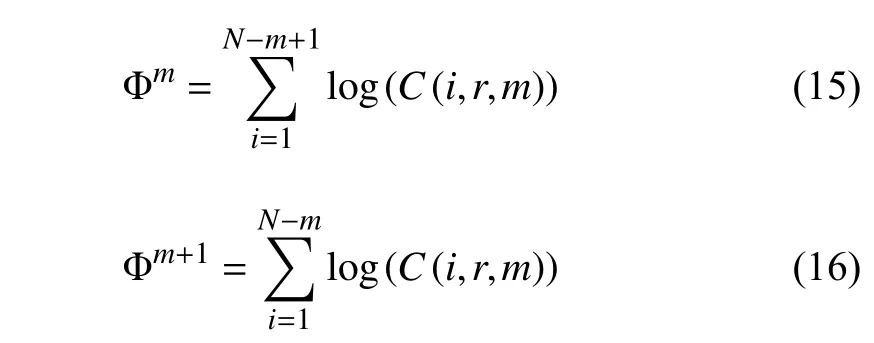
whereC(i,r,m) is the similarity between the selected EEG segments and themth segments. The similarity threshold is a user predefined valuer. The smaller theAEvalue, the higher the repeatability in the signal. The advantages of approximate entropy analysis are the tolerance of noisy signals and nonprior knowledge requirements about the signals [108].However, since approximate entropy requires a self-check analysis (the selected EEG segments have to be compared with their own so that special cases that cause log(0) do not exist), the result is biased, which is a critical issue when dealing with a small number of EEG segments. The sample entropy (SE) is introduced to solve the potential biased results issue, and the equation is

where Φmand Φm+1are the same as (15) and (16). Similar toAE, the smaller theSEvalue, the higher the repeatability of the signal.
In the frequency domain, spectral-based entropy (SPE) and wavelet-based entropy (WE) are commonly applied [109],[110].SPEcan be considered an extension of PSD analysis,and the equation is

whereP(i) is the normalized power spectral density, as shown in


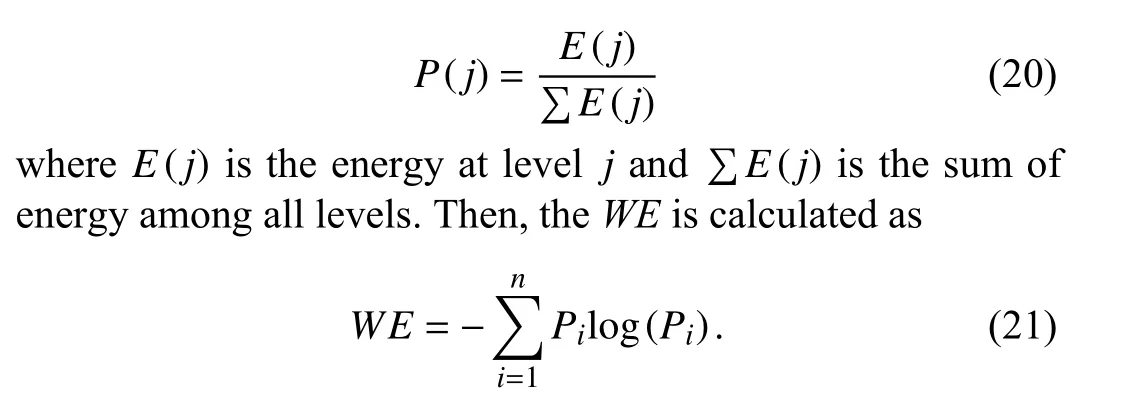
BothSPEandWEcan extract EEG features effectively, but it requires frequency or time-frequency analysis and prior knowledge about the signals.
Currently, the applications of statistical entropy on EEG analysis are combinations withAE,SE,SPE, andWE. Huet al.appliedSPE,AE,SE, and fuzzy entropy to detect driver fatigue [111]. According to his findings, the combination of all entropy feature extraction methods could provide better detection accuracy. In addition to combination features,modification and improvement based on current entropy analysis are also popular. Zhanget al.combinedWE,AE, andSEas features for driver fatigue studies [103]. In the research,they introduced the term “peak-to-peak entropy” to further improve the extraction effectiveness, as shown below:

whereEn(t) is eitherAEorSE. Chaudhuri and Routray proposed chaotic entropy for driver drowsiness detection[112]. The chaotic entropy analysis is composed ofAE,SE,and a modifiedSEalgorithm (MSE), whose equation isd[x(i),x(j)]

where is the distance between the EEG segments andris the tolerance threshold. The objective of the chaotic entropy analysis is to select the most effective feature fromAE,SE, and MSE for different EEG electrodes to improve the classification accuracy.
V. EEG CLASSIFICATION METHODS
The classification algorithm of EEG analysis in driver condition studies can be categorized as a traditional machine learning classifier and deep learning-based classifier(Table VI). The traditional methods are mostly state-of-art classifiers such as linear discriminant analysis (LDA), support vector machine (SVM), naïve Bayes (NVB), and kth nearest neighbor (kNN). The deep learning methods are different neural network models such as the feedforward neural network (FFNN), convolutional neural network (CNN),recurrent neural network (RNN), fuzzy neural network (FNN),and autoencoder neural network (AE). Table V and Fig. 18 presents a summary and brief explanation of every method,and their detailed explanation and equations are illustrated below.
A. Traditional Machine Learning Algorithms
1) Linear Discriminant Analysis
The LDA algorithm belongs to discriminant analysis, which is one of the simplest but effective classifiers in real-world applications. It linearly transforms data to a hyperplane to maximize the distance among each class of data. The LDA algorithm finds the transformation matrix by solving and finding the maximum eigenvalue from the between-class and with-in class metrics. The equation for the maximum eigenvalue is

whereSwandSBare the with-in and between-class metrics,respectively. Their equations are
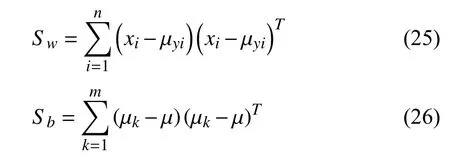
wherexiis the collection of theith sample, µyiis the mean value of theith sample, and µ is the overall mean value of all samples. After finding the maximum eigenvalue, the corresponding eigenvectors compose the transformation matrix.
The desired classifier for EEG-based driver state study requires i) ease of implementation and ii) robustness to different types of features. The LDA classifier meets both requirements. For ease of implementation, there are numerous built-in and open-source LDA classifier packages, such as the“scikit-learn” library for Python and the “fitcdiscr” function in MATLAB. For the robustness of different features, the LDA algorithm can maintain high classification accuracy for almost all different types of input EEG features. Khaliliardaliet al.employ the “Cz” electrode potentials as the features for LDA classification for driver behavior studies [113]; Chinet al.used CSP as the feature for LDA classification in driver cognitive load research [114]; Tenget al.applied theta wave power as input for LDA classification to recognize emergency situations [115]. The abovementioned literature selects different features for the LDA classifier but still obtains a classification accuracy over 70%.
However, the LDA classifier can only predict discrete classes such as drowsiness and non-drowsiness or level 1 distraction, level 2 distraction, and alert. Hence, the LDA algorithm is not fit for continuous regression analysis.Moreover, the LDA is sensitive to outlier data. If the extracted EEG features are noisy, the LDA prediction performance will decrease. Therefore, a careful artifact removal and signal preprocessing process is necessary for LDA classification.
2) Support Vector Machine (SVM)
Similar to LDA, SVM also defines a hyperplane to separate different classes of data at a maximum distance. However, the main differences between SVM and LDA are as follows: first,the SVM only considers the data points near the classification boundaries; second, SVM can be tuned by a kernel function to dramatically improve its classification accuracy. Sahaet al.proposed using kernel-based SVM to detect driver cognitive state [104]. They found that the SVM with a radial-based function (RBF) kernel classification accuracy is 2% higher than the SVM with a linear kernel function. Guoet al.proposed an RBF kernel-based support vector machine combined with a particle swarm optimization (PSO) algorithm to increase the driver vigilance prediction accuracy [94]. In addition to the kernel function, Biet al.proposed a transductive support vector machine with prior information(PI-TSVM) to improve the classification accuracy [116]. The TSVM is similar to a semi-supervised learning algorithm but learning is based on the test data. They collected the ratio of the positive samples to negative samples as prior information.With the help of this information and its application to the TSVM, the classification accuracy is improved.
The major benefit of the SVM classifier is the classification accuracy, especially with the help of kernel functions.According to Chang and Lin’s experimental results, the SVM with kernel function classification accuracy is similar to the deep learning algorithm, and the training period is shorter than the deep learning algorithm. Moreover, there are many existing open-source SVM algorithms available, such as“fitcsvm” for SVM and LIBSVM for C++ and Java [117].Hence, implementing the SVM classifier is easy and effective.However, when tuning the SVM parameters, the selection of a kernel function is time consuming and trivial. Therefore, a proper SVM classifier for EEG-based driver state study requires experience and prior knowledge about the EEG signals.
3) Naïve Bayes (NVB)
NVB is a probabilistic-based classifier for multidimensional data classification. The equation is

whereXis the target event andYis the known event. The assumption of the NVB classifier is that every input feature is independent of each other and that the contributions among every feature are equal. Despite easy application and multivariate analysis, the NVB method did not present good classification results for most EEG-based driver state studies.Linet al.applied the NVB classifier to study driver cognitive state [106]. According to the experimental results, the NVB method-based classification results are lower than those of the other state-of-art methods. Hu proposed an algorithm for automatic detection of driver fatigue [118]. They compared the NVB classified results with the AdaBoost and SVM classifiers through the receiver operating characteristic (ROC)curve method. His results have demonstrated that both SVM and AdaBoost classification results are over 30% better than the NVB classifier. The main reasons for the poor NVB performance are the independent feature input and the equal feature weight requirements. In reality, the collected EEG signal in every channel is a combination of multiple independent components. Hence, using the EEG time-domain signal as an input for NVB classification violates the independent rule. Even though ICA preprocessing can be conducted, the ground truth about the number of independent components is unknown. Therefore, NVB still cannot perform an ideal classification. Moreover, the features extracted weight from EEG cannot be guaranteed to be equal because the features exhibit different characteristics with different testing subjects or testing environments. Therefore, despite its ease of application and fewer training period advantages, the NVB classifier usually cannot provide the best classification results in EEG-based driver state studies.
4) kth Nearest Neighbor (kNN)
The kNN is a nonparametric classification algorithm based on distance estimation and majority vote. The basic idea about the kNN is to calculate the distances between the unknown data and known data and then rank the distances from low to high. The results of the unknown data class are determined by the highest vote in the first kth close distance known data.There are three common distance functions: Euclidean,Manhattan, and Minkowski, which are presented below [119]:

wherexis the testing sample, andyiis the known sample.
The main benefit of the kNN algorithm is no training period. There is no training phase in the kNN method but directly calculates the distances between the testing data and the existing known data. Moreover, the kNN algorithm could be considered a local optimization algorithm. In EEG signals,some features are locally clustered. Therefore, this method is suitable. However, the main disadvantage of kNN is that it is time consuming when dealing with a large multidimensional dataset. Since every point distance is required for calculation,the computation time is dramatically increased. The other disadvantage of the kNN algorithm is the biased distance when dealing with abnormal features. The solution to this is standardization. Amirudinet al.compared the kNN, SVM,and NVB classifiers to detect driver distraction [120].
B. Deep Learning Algorithms
Initially, deep learning-based classification algorithms were applied in image processing. Recently, it has become a popular classification technique in EEG driver state detection with the development of computation ability. The deep learning algorithms estimate parameters from training data through massive computation. Therefore, generally speaking,the deep learning-based algorithm classification results are accurate. In this section, the feedforward neural network(FNN), convolutional neural network (CNN), recurrent neural network (RNN), and autoencoder (AE) are illustrated.
1) Feedforward Neural Network (FFNN)
The FFNN is the most basic but effective neural network topology for EEG-based driver state analysis, as shown in Fig. 19. The FFNN combines the input directly with weight and bias factors to calculate the output with the equation shown below:

wherewjiis the weight factor in thejth layer andith neuron andbiis the bias factor for theith neuron. To obtain classification results, an activation function such as sigmoid or ReLU is used after calculating the output (yi) [121], [122]. For EEG-based driver state analysis, the FFNN inputs are either EEG signals or features extracted from the raw EEG signals,and the outputs are desired classification results such as fatigue or distraction level. The advantage of the FFNN is the robustness for different types of feature input. However, the FFNN model requires massive computation power to estimate the weight and bias factor. Moreover, the selection of neurons and layers can cause overfitting issues. Just like any other learning method, the FFNN requires large training sets to learn the content of the input signals in order to produce (fire)an output desirably. The next paragraphs demonstrate the advantages and improvements of the FFNN model.
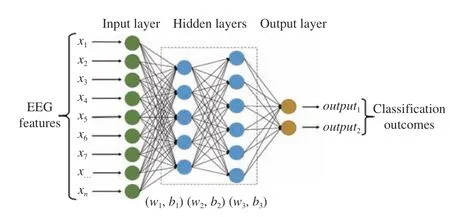
Fig. 19. Typical FFNN model topology.

Fig. 20. CNN model topology.
a) Robustness to different types of features
According to previous EEG driver state study literature,nearly all common EEG extracted features, such as time-series signals, DSP features, DWT features, and statistical entropy can be used for the FFNN model with relatively high classification accuracy. Mohamedet al.employed PSD as a feature to classify driver fatigue [86]. A 4-layer FFNN topology with the error backpropagation learning algorithm was developed, and the classification rate achieved 85%.Mohammadpour and Mozaffari applied the signal mean,standard deviation, and power from DWT decomposition as features for the FFNN model to detect driver fatigue [101].Their experimental results indicate that the accuracy is approximately 89%. In addition to the single feature input,hybrid combined features have also been selected. Zhanget al.selected both sample entropy and wavelet entropy to feed into FNN for detecting driver drowsiness levels [123].With the combination of entropy features, the classification accuracy is over 96.5%. The robustness of the FFNN model ensures that it becomes the most popular classifier in the EEG driver state study (Fig. 18).
b) Massive computation load and overfitting
i) Computation load reduction
The reason for the massive computational load is the backpropagation algorithm convergence rate. To solve this issue, Correa and Leber applied Laverberg-Marquardt backpropagation (LMBP) [98]. The LMBP method, compared with the conventional error backpropagation (EBP) algorithm, has a faster convergence rate and is more robust. With this learning algorithm, the driver drowsiness detection rate is over 80%. Another learning optimization technique is the magnified gradient function (MGF). The objective of the MGF function is to speed up the convergence rate by magnifying the gradient function [124]. Kinget al.applied the MGF function for learning professional and unprofessional driver drowsiness states [125]. According to their results, both professional and unprofessional driver fatigue detection accuracy is higher than 80%.
ii) Overfitting issue prevention
Overfitting is a common issue for the FFNN model in EEGbased driver state studies because of the noisy input signals and sensitive classification. Bayesian FFNN (BFFNN) is a common neural network model to prevent overfitting. The BFFNN model predicts the weights and bias factor based on Bayesian probability, which regularizes the model. H. Nguyen applied the BFFNN model to classify driver fatigue. For their classification process, three layers’ weight and bias factors are regularized based on the Bayes theorem. Their classification accuracy achieves close to 90%.
Even though the FFNN could be tolerated for multiple feature inputs, the detection results could be tuned by using different learning algorithms. The learning speed is slow and requires large testing data. Therefore, it cannot be used for real-time processing and classification.
2) Convolutional Neural Network (CNN)
The CNN model topology contains one or multiple convolutional layers and a fully connected neural network, as shown in Fig. 20. In the convolutional layer, the kernel filter is convolved with the input data with

wherehis the kernel filter, andfis the input signal. After the kernel filter, some CNN models downsample the extracted features for faster computational speed. In the fully connected neural network, the extracted features are applied for classification. Thus, in the context of EEG-based driver state study, the convolutional layers can replace feature extraction,and the fully connected network is considered as classification. The most common application of the CNN model for driver state study is the end-to-end learning technique, which means considering the raw EEG signal directly as input and the driver condition as output. Almogbelet al.employed CNN for end-to-end learning in driver workload studies [126]. In the CNN topology, eight convolutional layers were developed,and the outputs were “low,” “medium,” and “high” workload conditions. Their detection accuracy reached 93.4%.However, the traditional end-to-end CNN cannot extract implicit EEG features such as spatial features. Therefore,some studies have modified the CNN model to extract more implicit features to improve classification accuracy.
Hajinorooziet al.proposed a novel channel-wise CNN(CCNN) method for driver workload estimation [127]. They found that when predicting the driver’s cognitive load with raw EEG data, the CCNN detection accuracy outperforms the traditional machine learning algorithm and FFNN model. A similar modification of the CNN model was also applied by Gaoet al.[128]. In their modified CNN topology, there were layers to extract EEG spatial and temporal features. The detection accuracy was compared with the SVM classifier,and the results were 2% higher. Hajinorooziet al.has applied covariance-based CNN, which achieved better results than other common CNNs [129].
Despite the high classification accuracy, the CNN topology requires a large quantity of data for training and a lengthy training period. Moreover, CNNs easily cause overfitting issues with a small amount of data [130]. Therefore, the CNN algorithm is not suitable for real-time unsupervised studies for EEG-based driver condition analysis.
3) Recurrent Neural Network (RNN)
The RNN model is developed based on the idea of parameter sharing [131]. The distinct part of the RNN topology is that neurons in the same layer are dependent on each other, as shown in Fig. 21. Equations for RNN are shown below:

Fig. 21. RNN model topology.

where σ is the activation function,winis the input weight factor for the previous layer,wrecis the recurrent weight factor for the previous perceptron,u(t) is the input,x(t−1) is the previous perceptron, andbis the bias factor.
Since the EEG electrode collected signals are a combination of multiple independent components, the EEG signals are dependent on each other. Therefore, the RNN topology can provide accurate detection accuracy. Moinnereauet al.employed RNN for driver intention detection [132]. In this study, EEG signal features are extracted through a spike algorithm. The RNN model is composed of a reservoir and a readout layer where the reservoir contains temporal and spatial information. According to the experimental results, the detection accuracy reached over 88%, which is higher than that of other traditional machine learning techniques, such as SVM. The RNN model can also be combined with the CNN.In the research on driver brake intention of Leeet al., they compared RCNN with the LDA classifier [133]. The area under the curve (AUC) for CNN was 0.86, which was 0.25 higher than that of the LDA classifier. The RNN model was also combined with a fuzzy neural network (FNN) model[134]. C. Lin proposed a recurrent self-evolving fuzzy neural network (RSEFNN) to increase the memory capacity for noise cancellation. A special RNN, the Hopfield neural network,was employed by Sahaet al.[135], and the equation [136] is

where α is a diagonal factor matrix,uis the system state vector, andWis a symmetric weighted matrix. According to their experimental results, the Hopfield-based RNN model outperformed other learning models, such as kNN and SVM.
The disadvantages of the RNN model are the high computational load or unstable training due to the vanishing/exploding gradient issue. The nature of the RNN model is to contain previous time point neuron information for the next time point calculation. Thus, during the learning period, a close-to-zero random value multiplication causes a smaller gradient (vanishing gradient problem) and longer training time, while a large random value multiplication causes a larger gradient (exploding gradient problem) and the model is not stable. Therefore, the RNN model training period is time consuming compared with other neural network models.
4) Fuzzy Neural Network (FNN)
The FNN model combines the artificial neural network(ANN) and fuzzy systems, as shown in Fig. 22. Both ANN and fuzzy systems are pattern recognition algorithms. The benefit of ANN is that it does not require prior knowledge.However, ANN requires a large number of observations, and the training process is not straightforward. Fuzzy systems do not require a large training dataset, and the learning process is clear. Nevertheless, fuzzy systems require prior knowledge about the learning data, and the training can be time consuming. Hence, a combination of ANN and FNN could unite both advantages but exclude the disadvantages.
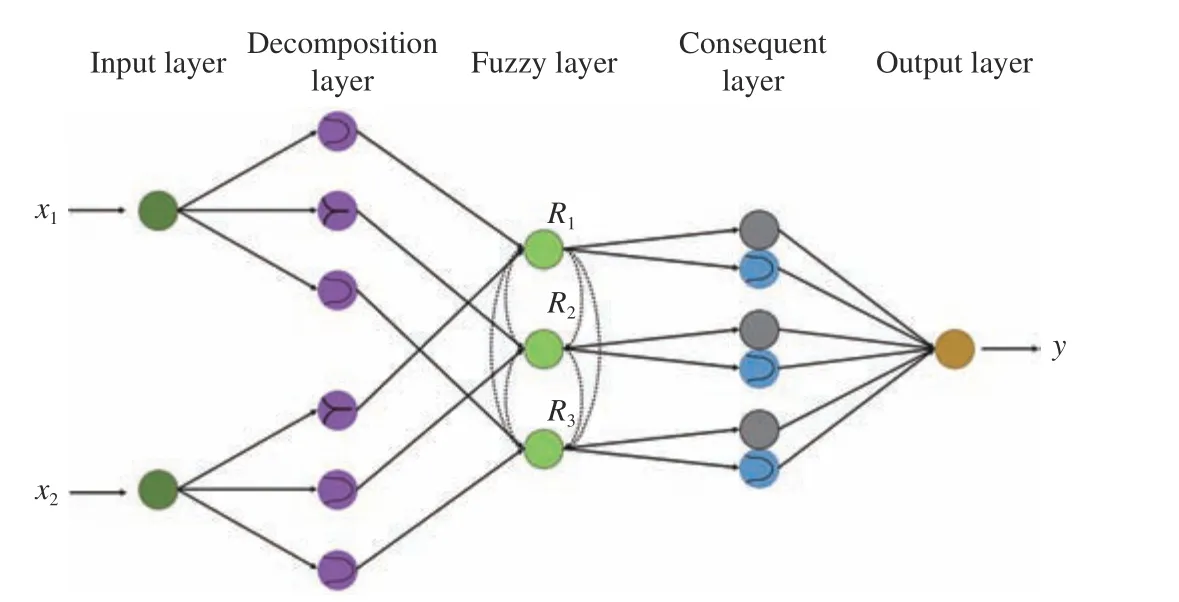
Fig. 22. FNN model topology.
Hajinorooziet al.proposed a novel channel-wise CNN(CCNN) method for driver workload estimation [127]. They found that when predicting the driver cognitive load with raw EEG data, the CCNN detection accuracy outperforms the traditional machine learning algorithm and FFNN model. A similar modification of the CNN model was also applied by Gaoet al.[128]. In their modified CNN topology, there were layers to extract EEG spatial and temporal features. The detection accuracy was compared with the SVM classifier,and the results were 2% higher. Hajinorooziet al. has applied covariance-based CNN, which achieved better results than other common CNNs [129].
5) Autoencoder (AE)
AE is an unsupervised deep learning algorithm that estimates the output so that it is similar to the input. The topology of the AE algorithm is shown in Fig. 23.
Biet al.applied variational AE to provide a robust feature representation of EEG signals [116]. In their study, the AE was combined with transductive SVM (TSVM). The semisupervised learning algorithm only requires small initial training data and can continue training with unlabeled EEG signals. Presently, the autoencoder classifier is not widely applied for EEG-based driver state studies. However, because of the unsupervised learning characteristics, the autoencoder classifier exhibits a promising future in EEG analysis.
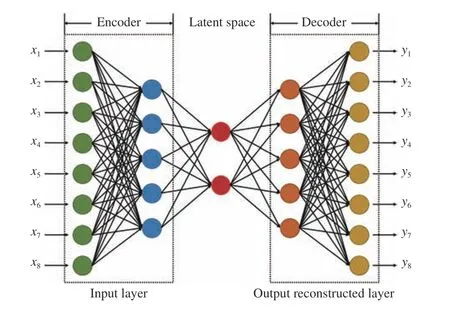
Fig. 23. AE network model topology.
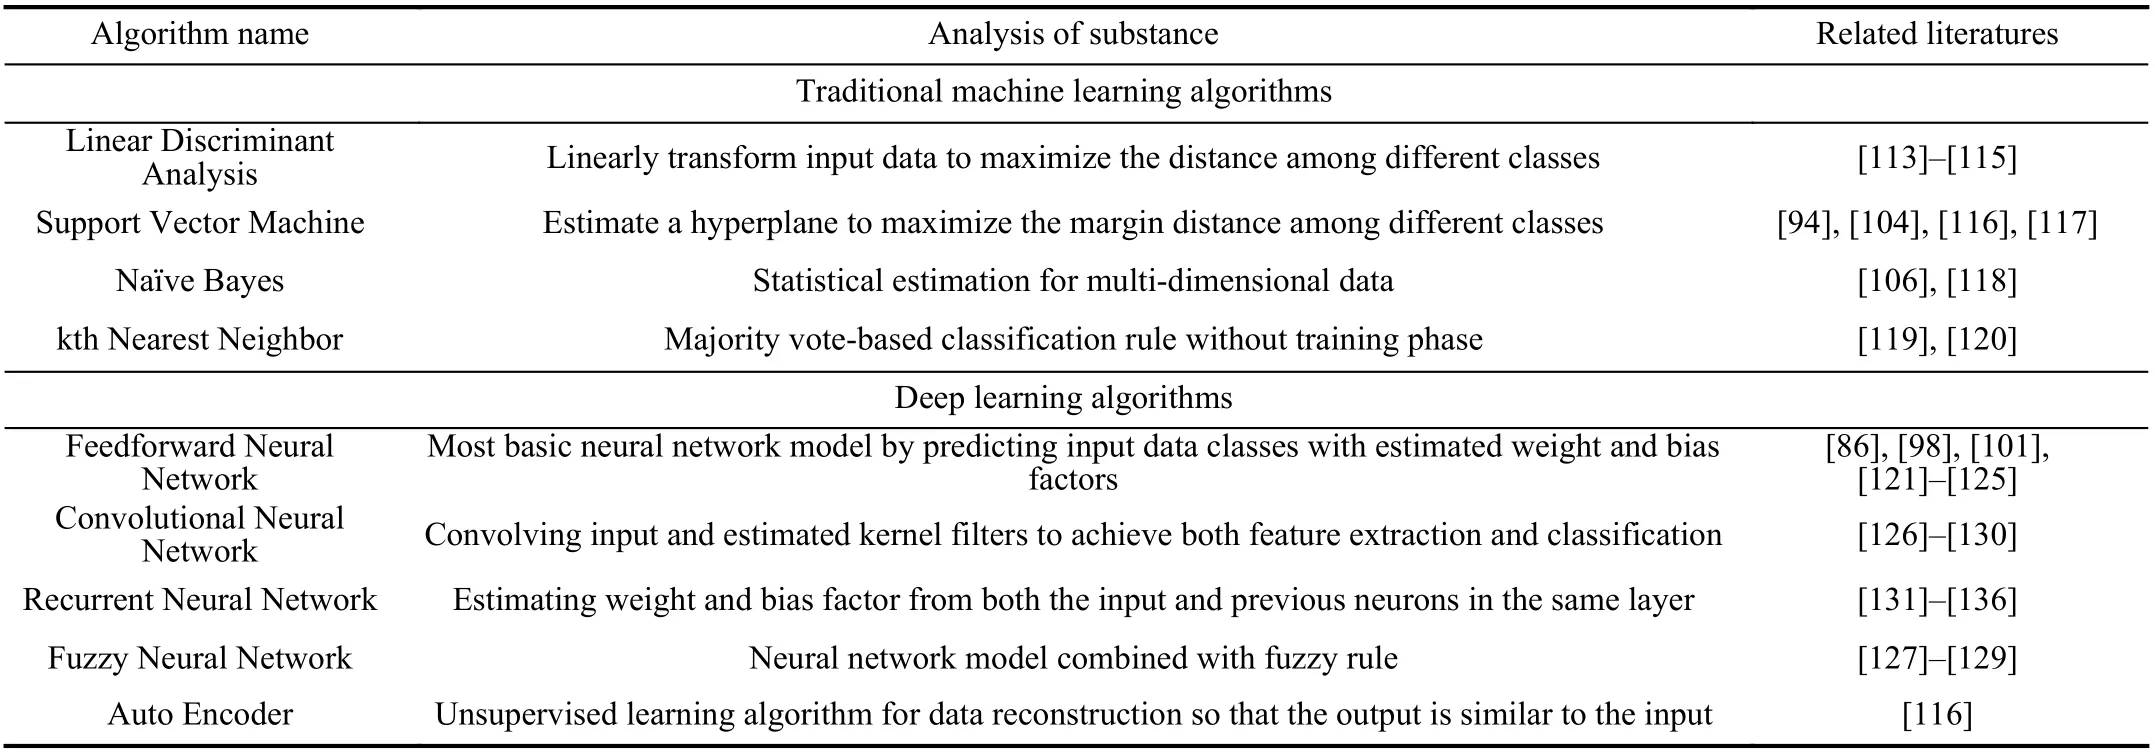
TABLE VI CLASSIFICATION ALGORITHM SUMMARY TABLE
VI. CONCLUSIONS AND FUTURE WORKS
In this paper, the EEG systems for driver state analysis and the corresponding EEG state-of-art algorithms are reviewed.According to previous literature, EEG driver state analysis systems tend toward convenient wearing, compact carrying,and economic pricing. However, the reliability, external noise resistance, and wireless connection of EEG driver state analysis systems still need to be improved. The EEG-based brain wave signal monitoring approaches are reviewed with sufficient depth to familiarize a reader with the available tools and their advantages and limitations. The methods for signal collections, signal pre-filtering, signal processing, signal feature extractions and classifications are reviewed. The previous studies with some successes in each subarea for driver state monitoring are presented, along with a listing of any limitations where applicable. The development of EEG driver state analysis algorithms for comprehensive driver state detection, accurate classification accuracy, and efficient computational load are discussed. Although substantial progress in EEG driver state analysis has been made, EEG signal analysis algorithms still need to be enhanced in three fields: EEG artifact reduction, real-time processing, and between-subject classification accuracy. For EEG artifact reduction, although numerous artifact removal algorithms exist, these algorithms either cannot remove all EEG artifacts thoroughly or overfitting useful EEG information. For realtime processing, most published algorithms achieve real-time processing speed by sacrificing the algorithm’s effectiveness.For the between-subject classification accuracy issue, almost all existing EEG-based driver state algorithms cannot be implemented for subject-independent analysis.
In brief, by solving the challenges of EEG systems and corresponding driver state analysis algorithms, a deeper understanding of driver state and control functions and readiness can be developed. This can assist in developing ADAS or semi-autonomous systems to minimize human error during driving and enhance safety.
 IEEE/CAA Journal of Automatica Sinica2021年7期
- IEEE/CAA Journal of Automatica Sinica的其它文章
- A Fully Distributed Approach to Optimal Energy Scheduling of Users and Generators Considering a Novel Combined Neurodynamic Algorithm in Smart Grid
- Distributed MPC for Reconfigurable Architecture Systems via Alternating Direction Method of Multipliers
- Global-Attention-Based Neural Networks for Vision Language Intelligence
- Towards Collaborative Robotics in Top View Surveillance: A Framework for Multiple Object Tracking by Detection Using Deep Learning
- Lightweight Image Super-Resolution via Weighted Multi-Scale Residual Network
- Human-Swarm-Teaming Transparency and Trust Architecture
