
Sandstone-concrete interface transition zone(ITZ)damage and debonding micromechanisms under freeze-thaw
2021-05-31 08:09:06YanJunShenHuanZhangJinYuanZhangHongWeiYangXuWangJiaPan
YanJun Shen ,Huan Zhang ,JinYuan Zhang ,HongWei Yang ,Xu Wang ,Jia Pan
1.School of Geology and Environment,Xi'an University of Science and Technology,Xi'an,Shaanxi 710054,China
2.Geological Research Institute for Coal Green Mining,Xi'an University of Science and Technology,Xi'an,Shaanxi 710054,China
3.Shaanxi Provincial Key Laboratory of Geological Support for Coal Green Exploitation,Xi'an,Shaanxi710054,China
4.School of Architecture and Civil Engineering,Xi'an University of Scienceand Technology,Xi'an,Shaanxi710054,China
ABSTRACT The sufficient bond between concrete and rock is an important prerequisite to ensure the effect of shotcrete support.How‐ever,in cold regions engineering protection system,the bond condition of rock and concrete surface is easily affected by freeze‐thaw cycles,resulting in interface damage,debonding and even supporting failure.Understanding the micromecha‐nisms of the damage and debonding of the rock‐concrete interface is essential for improving the interface protection.Therefore,the micromorphology,micromechanical properties,and microdebonding evolution of the sandstone‐concrete in‐terface transition zone(ⅠTZ)under varying freeze‐thaw cycles(0,5,10,15,20)were studied using scanning electron mi‐croscope,stereoscopic microscope,and nano‐indentation.Furthermore,the distribution range and evolution process ofⅠTZ affected by freeze‐thaw cycles were defined.Major findings of this study are as follows:(1)The microdamage evolu‐tion law of theⅠTZ under increasing freeze‐thaw cycles is clarified,and the relationship between the number of cracks in theⅠTZ and freeze‐thaw cycles is established;(2)As the number of freeze‐thaw cycles increases,theⅠTZ's micromechani‐cal strength decreases,and its development width tends to increase;(3)The damage and debonding evolution mechanisms of sandstone‐concreteⅠTZ under freeze‐thaw cycles is revealed,and its micromechanical evolution model induced by freeze‐thaw cycles is proposed.
Keywords:sandstone‐concrete;interface transition zone(ⅠTZ);freeze‐thaw cycles;nano‐indentation;damageand debonding
1 Introduction
Achieving a good bond behavior between rock and concrete has always been critical in tunnel con‐struction,slope support,gravity dam,and other proj‐ects(Loet al.,1991;Krouniset al.,2015;Lu and Liu,2017;Shenet al.,2019,2020a).The traditional sup‐port theory,design method,and construction technolo‐gy are mostly based on the normal temperature condi‐tions.Constructing concrete protection on rock surfac‐es at low temperatures is not recommended.Ⅰn cold regions construction,the special environment of freeze‐thaw cycles alternation has an important im‐pact on rock protection(Liet al.,1999;Cuiet al.,2017;Phillipset al.,2017;Wanget al.,2018a,2018b).The rock‐concrete interface transition zone(ⅠTZ),as a weak surface,often has certain permeabili‐ty and water storage capacity and is more vulnerable to freeze‐thaw cycles degradation than the convention‐al environment(Badeliet al.,2018).However,as a traditional"weak surface",the volumetric expansion in the pores during phase change will lead to the growth of pores and generation of cracks in the rock,concrete,andⅠTZ under the low‐temperature freeze‐thaw cycles environment.The durability of rock and concrete will be compromised(Mellor,1970),which will lead to the change of microstructure and micromechanical behavior of theⅠTZ between rock and concrete.Because of the above changes,the concrete cannot fully play its supporting function.Therefore,the study on the micromechanisms of the rock‐concreteⅠTZ damage and debonding induced by freeze‐thaw cycles is significant for rock engineering protection problems in cold regions.
As the"weak surface",the rock‐concreteⅠTZ is more likely to cause interface debonding and cracks under freeze‐thaw cycles(Mainaliet al.,2015;Shenet al.,2020b).This will lead to the failure of the con‐crete support.Many scholars have studied the bond‐ing between rock and concrete by considering inter‐face roughnesses,stress states,and basic mechanical properties of rock or concrete,etc.,and made impor‐tant findings on the mechanical behavior and debonding mechanisms between rock and concrete interface(Lam and Johnston 1989;Loet al.,1991;Tianet al.,2014,Andjelkovicet al.,2015;Krouniset al.,2016;Donget al.,2017;Mouzannaret al.,2017;Renaudet al.,2019).Shenet al.(2019)con‐ducted slant shear tests on granite‐concrete binary composite with different roughness and hydrophilic interface,and proposed a two‐element shear model(Shenet al.,2019).Low temperature is often an im‐portant factor in engineering protection,and has an important impact on the rock‐concrete bond behav‐ior.Xiang and Liu(2010)considered the mechanical strength characteristics of the rock‐shotcrete compos‐ite specimens under freeze‐thaw cycles.Their results showed that the shear stress of cementation surface between rock and shotcrete decreased significantly with the increase of freeze‐thaw cycles(Xiang and Liu,2010).Hoet al.(2019)conducted a preliminary evaluation of the concrete‐rock interface behavior un‐der freeze‐thaw cycles(Hoet al.,2019).Mainaliet al.(2015)detected the formation and expansion of micro‐cracks at the rock‐concrete interface during repeated freeze‐thaw processes through acoustic emission(Mainaliet al.,2015).Cuiet al.(2016,2017)studied and analyzed the influence of different rock wall tem‐peratures on the bonding strength of the surrounding rock‐concrete.Their results showed that the higher the surrounding rock temperature is,the lower the bonding strength is(Cuiet al.,2016,2017).Tonget al.(2016)and Tanget al.(2016)found that high tem‐perature and low humidity would affect the bonding strength of the surrounding rock‐concrete,and a high‐er temperature and lower humidity environment would reduce the bonding strength(Tonget al.,2016;Tanget al.,2017).However,there are few studies on the micro interpretation of the debonding process of the rock‐concrete interface and the defini‐tion ofⅠTZ under freeze‐thaw cycles.
Nano‐indentation technology is one of the com‐mon methods to test the micromechanical properties of materials.At present,it has been widely used in the micromechanical testing of rock and concrete(Sorelliet al.,2008;Wanget al.,2009;Bandiniet al.,2012;Zanjani and Bobko,2014;Liuet al.,2016;Du and Radonjic,2018;Yanget al.,2018;Suet al.,2019;Wanget al.,2019).Many scholars have studied the micromechanical changes of the concreteⅠTZ through the nano‐indentation technology (Zampiniet al.,1998;Velezet al.,2001;Mondalet al.,2009;Hussin and Poole,2011;Xiaoet al.,2013;Sáez del Bosqueet al.,2017;Xuet al.,2017;Heet al.,2019).Re‐searches showed that the micromechanical perfor‐mance of cement‐based compositesⅠTZ strengthens with an increasing distance from the aggregate sur‐face.The trend is that it firstly increases,then decreas‐es,and finally remains unchanged,showing a typical"U"characteristic.Yanget al.(2018)studied the per‐formance ofⅠTZ through the coupling test of fatigue load and freeze‐thaw cycles.They found that with the increase of the number of freeze‐thaw cycles,the thickness ofⅠTZ gradually increased,the structure ofⅠTZ became loose,and the strength gradually de‐creased(Yanget al.,2018).Cwirzen and Penttala(2005)found thatⅠTZ provides a channel for pore so‐lution movement,which can trigger and accelerate the reduction of micromechanical properties of concrete(Cwirzen and Penttala,2005).Nano‐indentation tests on flax fiber concrete were carried out by Zadeh and Bobko(2014).Their results showed that the elastic modulus ofⅠTZ was low,and revealed large numbers of pores and low‐density calcium silicate hydrate inⅠTZ(Zadeh and Bobko,2014).Many scholars have studied the distribution composition and microme‐chanical properties of minerals by nano‐indentation technology(Magnetet al.,2011;Liuet al.,2016;Suet al.,2019).Bandiniet al.(2012)studied the effect of crystal microcracks in marble on its micromechani‐cal properties,and revealed the formation process of microcracks and the change rule of mechanical prop‐erties in this process(Bandiniet al.,2012).Magnenetet al.(2011)studied the volume fraction and elastic modulus of mudstone matrix and large contained min‐erals through array indentation test(Magnenetet al.,2011).Ⅰn conclusion,nano‐indentation technology has been widely applied in the research of rock and concrete.The above studies mainly focused on analyz‐ing the concreteⅠTZ,the micromechanical properties,and the mineral composition of rock.However,little study can be found on the change of the microstruc‐ture and micromechanical properties of the rock‐con‐creteⅠTZ under the action of freeze‐thaw cycles.
The present research aims at the evolution law of microdebonding and micromechanical properties deterioration of the sandstone‐concreteⅠTZ after freeze‐thaw cycles.Besides,attention is paid to the bonding characteristics of the sandstone‐concreteⅠTZ microstructure.According to the experimental results,the range ofⅠTZ and the evolution ofⅠTZ debonding under freeze‐thaw cycles are proposed.Finally,the microdebonding mechanism,and a micromechanical evolution model of sandstone‐concreteⅠTZ induced by freeze‐thaw cycles are discussed.
2 Experimental design
2.1 Experimental samples
The sandstone used in the test was taken from a quarry in Shaanxi Province,and there was less bed‐ding in the selected sandstone.The selected sandstone was cut into cuboids of 100mm×100mm×50mm with small size variations.Then a prepared cuboid was put into each mold box of 100mm×100mm×100mm.Concrete was filled into the mold box to prepare sandstone‐concrete samples.The proportions used for the concrete mix were 1,0.67,3.12,5.02,and 0.029 kg of cement,water,sand,gravel,and admixture.Specifi‐cally,PO42.5 cement,a medium sandsourced from the Weihe River,a gravel of 5−16 mm diameter from Tongchuan,and polycarboxylate super‐plasticizer were used in the concrete.After pouring,the mold was re‐moved after 24 hours,and the samples were further cured for 28 days in a curing room at a constant tem‐perature of 20℃and a humidity of 97%RH.The resulting binary samples were in the form of a cube with sides of 100 mm(Figure 1a).A rock core ma‐chine was then used to extract cylindrical specimens with a diameter of 50 mm and a height of 100 mm along the interface direction(Figure 1b).After coring,circular discs with a diameter of 50 mm and a thick‐ness of 5 mm were sliced by a rock cutter(Figure 1c).After drying,the discs were stored in sealed bags for further surface grinding and polishing.
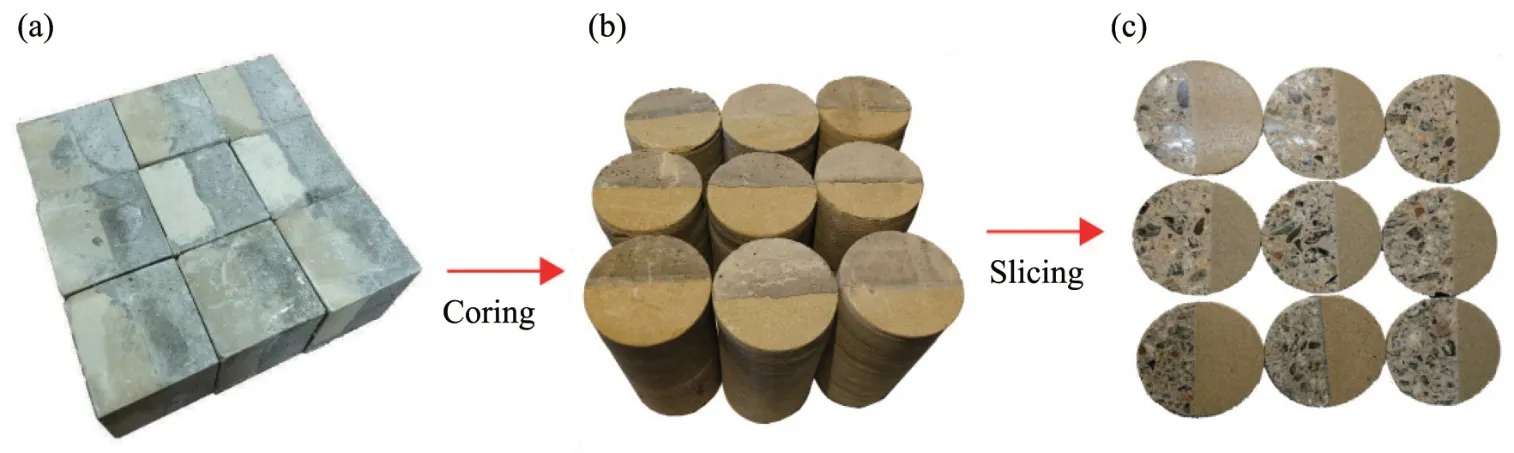
Figure 1 Sandstone‐concrete samples preparation:(a)Sandstone‐concrete cubes;(b)Sandstone‐concrete cylinders;and(c)Sandstone‐concrete discs
Considering the significant influence of roughness on nano‐indentation test results(Diamond,2001;Kimet al.,2006),disc specimens were polishing by fol‐lowing these steps:(1)Coarse grinding.The grinding time shall not exceed 2 minutes with a coarse grind‐ing machine.Also,tap water shall be used for cooling during the grinding process,and then ultrasonic clean‐ing shall be used for 6 minutes.(2)Observation.The sandstone surface was lower than the concrete surface during the coarse grinding,because the elastic modu‐lus and hardness of sandstone were smaller.There‐fore,the flatness of the sample was observed by an optical microscope.(3)Polishing.3μm,1μm,and 0.1μm oil‐based diamond suspensions were used suc‐cessively to polish the surface for 5 minutes each.Af‐ter each polishing,ultrasonic cleaning was performed for 6 minutes.(4)Fine polishing.A special polishing flannelette was applied to a special pasting plate with‐out bubbles.A polishing emulsion was evenly sprayed on the polishing flannelette.The specimen surface was continuously polished for 10 minutes through the polishing machine to obtain bright and smooth speci‐mens for testing.
2.2 Experimental scheme
2.2.1Freeze-thawcyclestest equipment and scheme
Considering the impact of freeze‐thaw test scheme on rocks,Shenet al.(2016)recommended the number of freeze‐thaw cycles to be 30−50,depending on the property of rock(Shenet al.,2016).Considering the property of sandstone,the number of freeze‐thaw cycles was set to 0,5,10,15 and 20.Firstly,the samples were saturated with vacuum‐saturation equipment(type:ZYB‐ⅠⅠ,Nantong Huaxing PetroleumⅠnstrument Co.,Ltd.,Nantong,China)(Figure 2a).The suction pressure was set to-0.1 MPa and maintained for 2 hours to assist the water infiltration into the rock ventricle.After that,the pressure was changed to 0.1 MPa,and the samples were saturated for 48 hours.Subsequently,the saturated samples were placed inside the automatic freeze‐thaw cycles test equipment(type:XT5412‐MTC125,Xutemp Co.,Ltd.,Hangzhou,China)(Figure 2b).The tempera‐ture was set to−20℃to 20℃according to the envi‐ronmental temperature range in cold regions.One cycle was set to 9 hours,with freezing time of 4 hours,thawing time of 4 hours and cooling time of 1 hour.Ⅰn order to avoid water loss during the freeze‐thaw cycles,these samples were saturated.
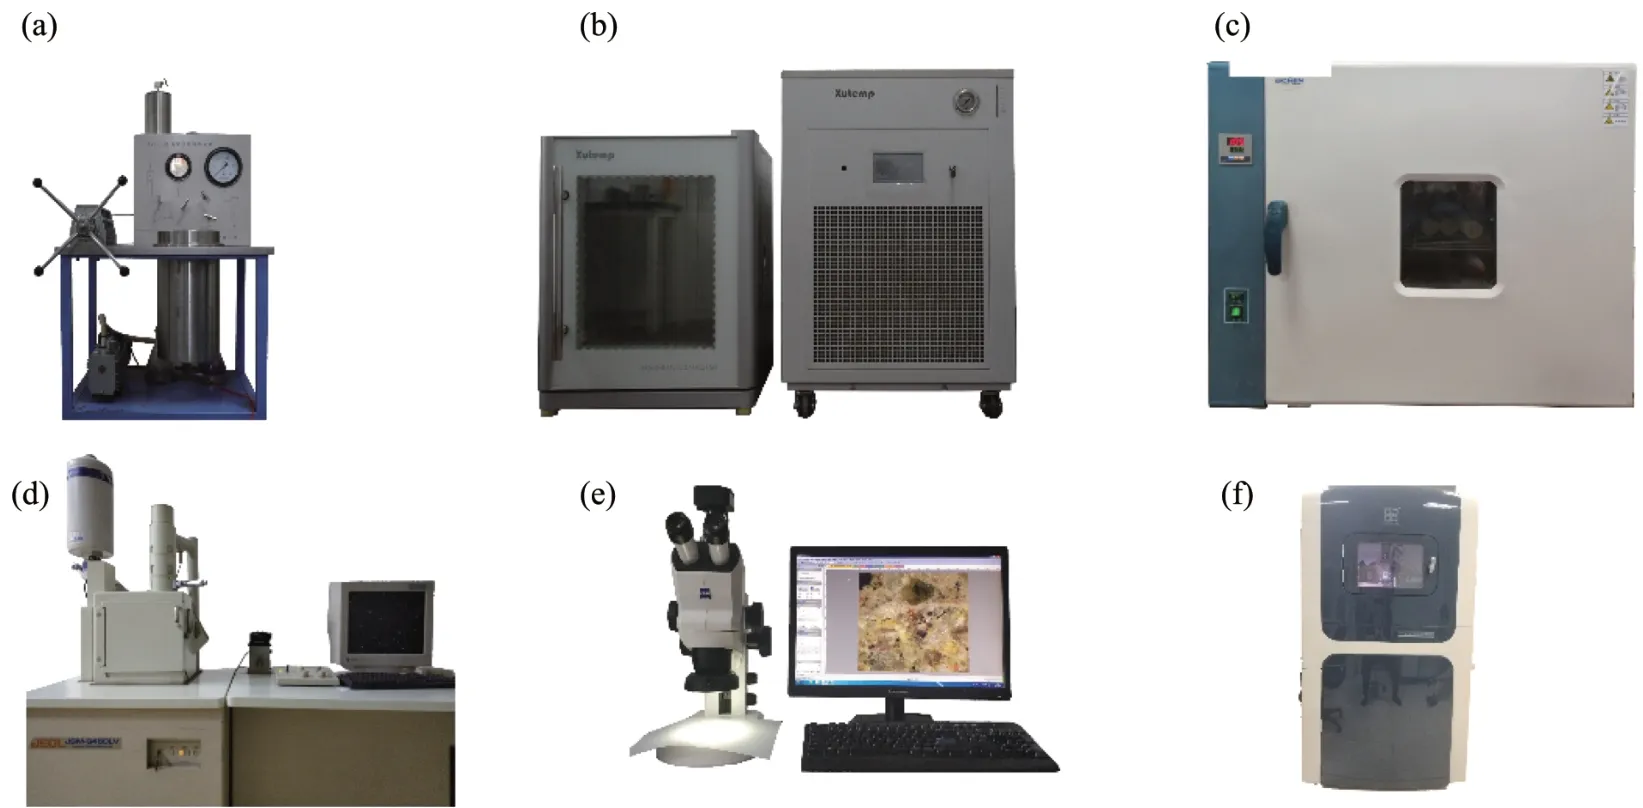
Figure 2 Experimental equipment:(a)Vacuum‐saturation equipment,(b)Automatic freeze‐thaw cycles equipment,(c)Oven,(d)Scanning electron microscope,(e)Stereoscopic microscope,and(f)Nano‐indentation equipment
2.2.2Micromorphologytestequipmentand scheme
Scanning electron microscope(type:JMS‐6460LV,Japan)(Figure 2d)and stereoscopic microscope(type:STEMⅠ‐508,Germany)(Figure 2e)were used to scan and image the micromorphology of sandstone‐concrete subjected to freeze‐thaw cycles.Then,the influence of freeze‐thaw cycles on the micromorphology ofⅠTZ was analyzed qualitatively and quantitatively.Before the start of SEM observations,the sandstone‐concrete samples were cut by line,and then 1−cm cubes were cut out around the side with a double‐sided blade.The samples were oven‐dried(Figure 2c)for SEM observation.The magnification was set at 100 times,200 times,500 times,1,000 times,2,000 times,or 5,000 times to observe and analyze the bond state ofⅠTZ and the micromorphology of interface crack growth.
The damage ofⅠTZ with the increase freeze‐thaw cycles was observed at 100 times magnification(20 times of objective lens and 5 times of eye lens).During the test,the same sample was used for each freeze‐thaw cycle to avoid the influence of sample dif‐ference on the accuracy of test results.During sample observation,the entire sample interface was tracked,and the crack length was measured with the profession‐al software associated with the instrument.Furthermore,the initiation and propagation of the interface cracks and the interface debonding change were analyzed.
2.2.3Micromechanical property test equipment
and scheme
Nano‐indentation(type:Ti‐950Triboindenter,Hys‐itron Co.,Ltd.,America)(Figure 2f)was used to press a small diamond tip indenter(Berkovich)into the ma‐terial.Load control mode was used to carry out a load‐ing‐unloading cycle for each test point successively.Figure 3 depicts a load‐displacement curve,or aP‐hcurve,and the nano‐indentation principle(Sorelliet al.,2008).Note that hc is the depth of indentation.The loading mode was set as follows:when the in‐denter was pressed into the sample surface,it was loaded linearly at a rate of 0.2 mN/s for 10 seconds to a maximum load of 8 mN,and unloaded linearly at the rate of loading after 5 seconds of dead load.The purpose of the dead load was mainly to avoid the size effect on the cement paste's elastic property at the maximum load(Němeček,2009).According to the Oliver‐Pharr principle,the indentation hardnessHand indentation modulusMof each test point can be ob‐tained as follows:

wherePmaxis the maximum load;ACis the contact ar‐ea at the maximum load;Sis the slope at the top of the unloading curve;βis the correction factor of the indenter,andβ=1.034 for the commonly used Berkovich indenter(A normal triangular pyramid with an angle of 65.35°between the center line and the side).
For isotropic homogeneous materials,the elastic modulusEof each test point can be obtained from the indentation modulusM:
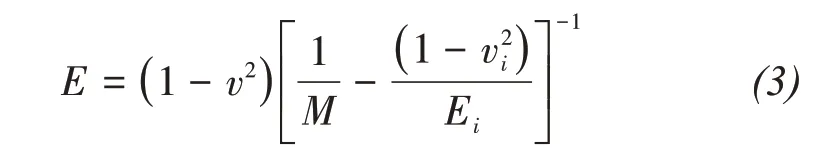
wherevis the Poisson's ratio of the test material and equals 0.25 for the cement‐based material;Ei,viare the modulus of elasticity and Poisson's ratio of the indenter,respectively.For diamond indenter,Ei=1,141 GPa,andvi=0.07(Němeček,2009).
Because the interface between sandstone and con‐crete is heterogeneous,6 nano‐indentation areas were selected evenly,with each test area containing 17 in‐dentation points to obtain reliable elastic modulusEand hardnessHvalues(Figure 4).Wanget al.(2009)showed that the interaction area of each indentation point was 4hmax,and the distance between the adjacent indentation points of cement paste was about 3μm(Wanget al.,2009).Based on the research results on theⅠTZ by scholars,the distance between the indenta‐tion points was set to be 10μm.Ⅰn this test,the aver‐age indentation value of each column was used to draw the hardness and elastic modulus change dia‐gram along with the interface distance.When the in‐dentation was pressed on the aggregate,the test re‐sults of 6 indentation areas needed to be considered comprehensively,and the appropriate average value was selected for the aggregate indentation data.

Figure 3 Loading‐unloading(P‐h)curve and a schematic diagram of Nano‐indentation(Sorelli et al.,2008)
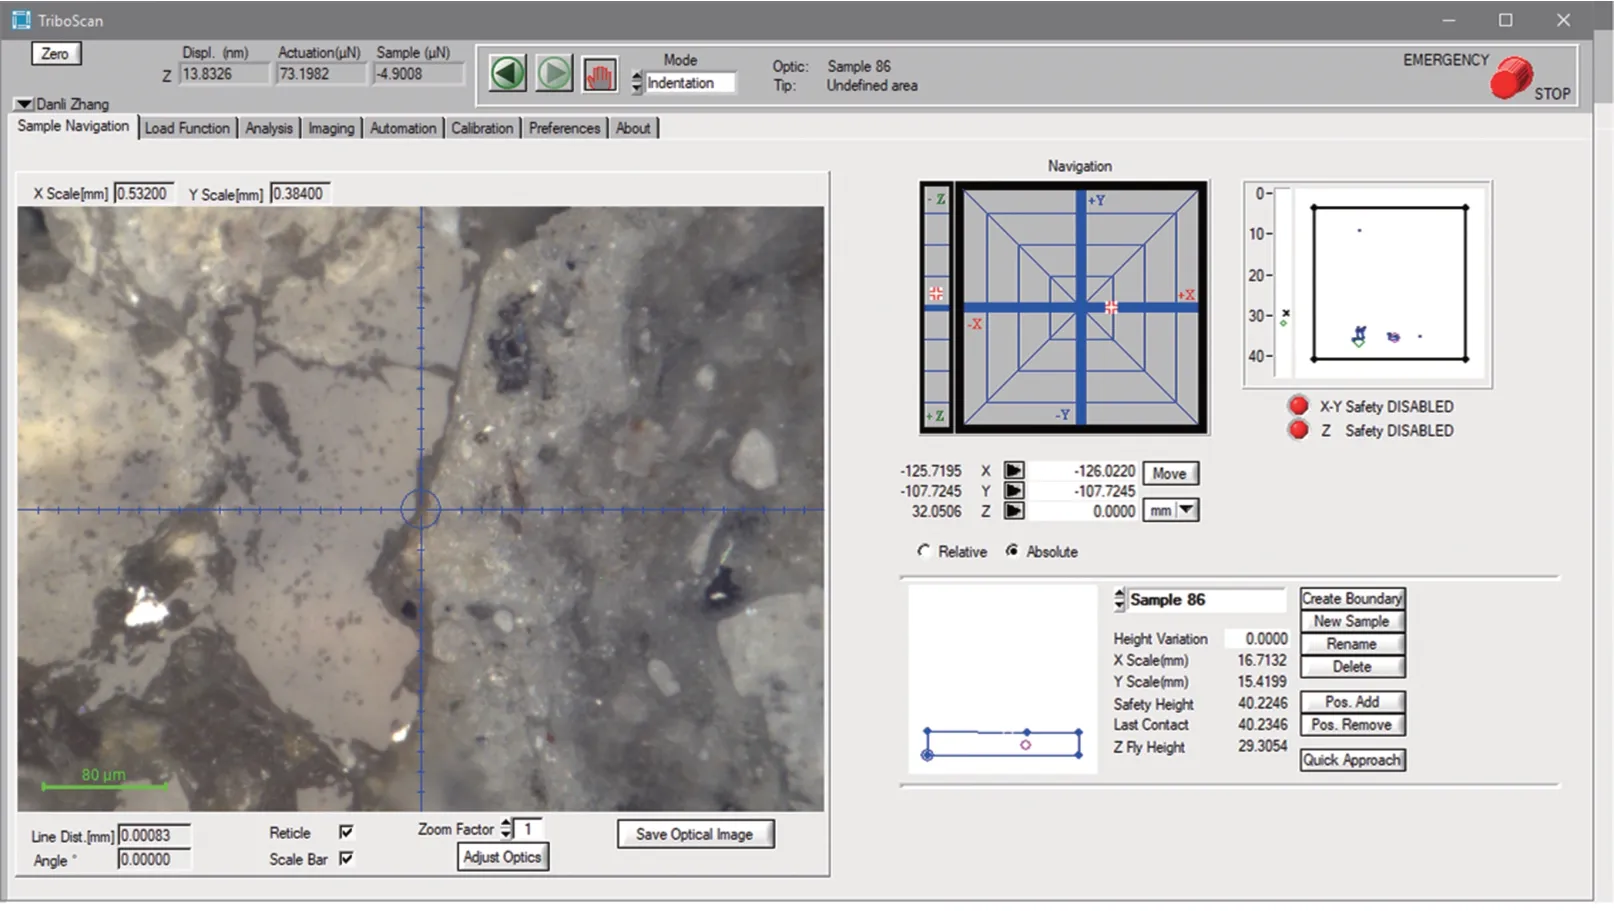
Figure 4 Nano‐indentation test interface
3 Experimental results and analyses
3.1 Analysis of microstructure and hydration products of the ITZ
For directly revealing the microstructure and hydra‐tion products of the sandstone‐concreteⅠTZ,representa‐tive areas A and B are selected for analysis.Figure 5 shows the SEM images of theⅠTZ.Ⅰn Figure 5a,the left area is sandstone,and the right area is concrete.Ⅰt can be seen from Figure 5 that:(1)The sandstone sur‐face is flat and smooth.However,the concrete surface is relatively rough,and white hydration products are visible;(2)The"interface"can be seen clearly on the contact surface and has obvious"depression",indicating that the pore volume and size of the sandstone‐concrete interface are larger than the body,and the relatively more porousⅠTZ is the source of interface debonding.Figure 5b shows that the hydration product is not fully crystallized and there are no unhydrated cement parti‐cles,and the overall microstructure is relatively dense.Ⅰt can be found in Figures 5c and 5e that there are cracks and holes at the sandstone‐concrete interface.The sandstone‐concrete interface is a weak layer with a certain thickness and size,rather than an ideal"surface".Referring to the relevant research in the field of concrete(Ⅰgarashiet al.,1996;Kurodaet al.,2000),it is called"interface transition zone(ⅠTZ)of the sandstone‐concrete".The unhydrated cement paste par‐ticles are less than the concrete body,because theⅠTZ pores provide sufficient space for the cement paste to hydrate and produce a large number of hydration prod‐ucts that serve as a"bridge"connecting sandstone and concrete.From Figures 5c and 5d,it can be seen that the hydration productsare mainly flaky calcium hydrox‐ide(CH)with a diameter of about 0.6−2.0μm growing in cracks and accompanied by a small amount of C‐S‐H gels and AFt crystals.The hydration products are rela‐tively simple.Among them,C‐S‐H gels are enriched in theⅠTZ and grows in a particular orientation.More‐over,they are arranged in layers and staggered con‐nections perpendicular to the interface.Ⅰn Figures 5e and 5f,it can be found that the main hydration prod‐ucts ofⅠTZ are C‐S‐H gels and AFt crystals.They are needle‐shaped,columnar,and tubular radiative net‐work of crystals with a length of about 0.4−1.8μm.The layered superposition of columnar and honeycomb C‐S‐H gels and needle‐shaped AFt crystals in the sandstone‐concreteⅠTZ enhances the density of the sandstone‐concrete interface and is the main source of the adhesive strength of theⅠTZ.
When the cement paste of concrete is subject to hy‐dration reaction,the ions of the cement paste will dis‐solve rapidly and diffuse into the water film on the sandstone surface.The active sequence of the ion reac‐tion is as follows:Na+>K+>>Al3+>Ca2+>Si4+.Owing to the different active sequences of the ion re‐action,the caky CH crystals and the needle‐shaped AFt crystals in the water film are generated the earli‐est,followed by the honeycomb C‐S‐H gels,as shown in Figure 6(Fanet al.,2019).CH and AFt crystals consume a lot of water in the cement paste,which lim‐its the growth of C‐S‐H gels and leads to the relative‐ly loose microstructure of theⅠTZ(Shui and Wan,2002a,2002b;Xuet al.,2016).Moreover,since the water‐cement ratio and calcium silicon ratio at the in‐terface are higher than that of the concrete,the ion sat‐uration at the interface is far lower than that of the con‐crete.Therefore,the unrestricted growth of CH and AFt crystals are allowed,which helps enrich and arrange the CH crystals at the interface directionally and af‐ford a large porosity in the sandstone‐concreteⅠTZ.
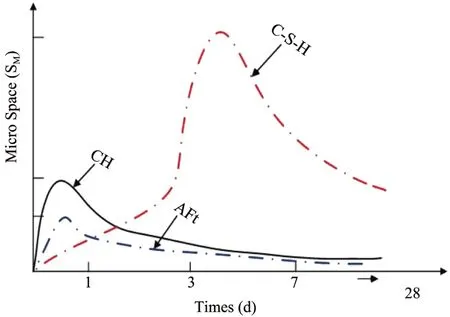
Figure 6 Hydration reaction vs.time for cement paste(Fan et al.,2019)
3.2 Analysis of apparent cracking of the sandstone-concrete ITZ induced by freeze-thaw
After freeze‐thaw cycles,each group of the sandstone‐concreteⅠTZ has different degrees of cracks.From the differences in the effect of the various freeze‐thaw cycles on the cracks of the sandstone‐con‐crete,the discrepancies in cracks after 5 freeze‐thaw cycles are not obvious.After 10 freeze‐thaw cycles,there are varying degrees of cracks on theⅠTZ sur‐face.With the increase of freeze‐thaw cycles,these differences after 15 and 20 cycles become significant.The cracks directly extend across the entire interface and widen.This also shows that the damage usually propagates along the weak link,and powder clastic and particle spalling appear on the sample surface.The cracks conditions of the sandstone‐concrete with different freeze‐thaw cycles are shown in Figures 7 and 8.During freezing,the interface cracks begin to expand under the sustainable action of frost force.Ⅰf the freeze‐thaw cycles is repeated sufficiently,the frost force at the interface will be greater than the bond force,and the sandstone‐concrete interface will eventually break down.
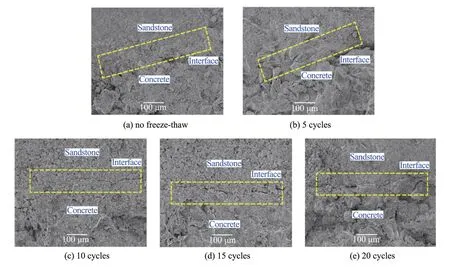
Figure 7 Expansion of cracks with increasing freeze‐thaw cycles(SEM)
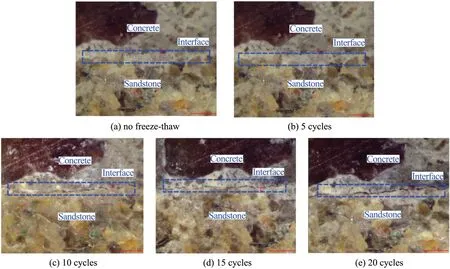
Figure 8 Development of cracks with freeze‐thaw cycles at the same location(Stereoscopic microscope)
Figure 9 shows that with the increase of the num‐ber of freeze‐thaw cycles,the bond between mineral particles of theⅠTZ gradually becomes loose,and the hydration products are filled in the cracks of theⅠTZ.The filling is mainly composed of CH crystals and C‐S‐H gels,and the accumulation and directional arrangement of CH crystals can be observed,indicat‐ing that these cracks occur during freeze‐thaw cycles but not the sample preparation.From a comparison between Figures 5 and 9,it can be concluded that with increasing freeze‐thaw cycles,the interface fatigue damage of the sandstone‐concrete deterio‐rates,and the hydration products(C‐S‐H gels,AFt and CH crystals)which connect the weakest surface of sandstone‐concrete are destroyed.The hydration products break,decrease,and even disappear.
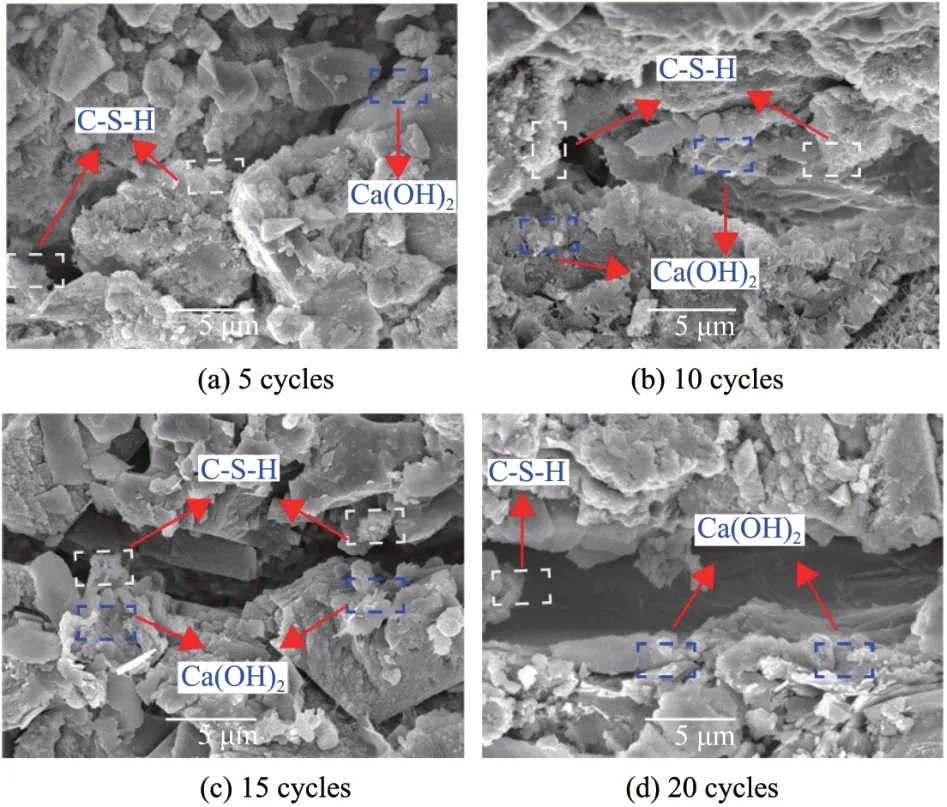
Figure 9 Microstructure of theⅠTZ under different freeze‐thaw cycles
3.3 Micro analysis of ITZ cracks propagation in sandstone-concrete
After freeze‐thaw cycles,the cracks and debond‐ing of the sandstone‐concrete interface were ob‐served by the stereoscopic microscope.Subsequent‐ly,the trend and extension of the cracks of the whole disc were tracked and spliced,and the general rule of the sandstone‐concreteⅠTZ cracks under the freeze‐thaw cycles was analyzed.Ⅰt can be found from Figures 10a−10e that 5 freeze‐thaw cycles do not cause cracks in the sandstone‐concreteⅠTZ,and the difference induced by freeze‐thaw cycles is not shown on the sandstone‐concreteⅠTZ.As the phase change occurs repeatedly to the pore water in the sample under freeze‐thaw cycles,the cracks within the sandstone‐concreteⅠTZ accumulate,and the fa‐tigue damage is generated inside theⅠTZ.However,apparently,the cracks do not gradually expand or con‐nect.After 10 freeze‐thaw cycles,there are different degrees of cracks at the surface of the sandstone‐con‐creteⅠTZ.On the one hand,the thermal conductivity and linear expansion coefficient of the original cracks,sandstone,and concrete are inconsistent.Af‐ter heating and cooling,the material will show the dif‐ference.On the other hand,due to freeze‐thaw cycles,the water moves from the frozen fringe of unfrozen zone to frozen zone and freezes under the action of generalized traction force such as temperature gradi‐ent.Ⅰn this process,the gradually produced frost force acts on the crack tip.When the frost force ex‐ceeds the cracks growth threshold,it will drive the cracks expansion and connection.There are the cracks at the sample surface under the two effects(Liuet al.,2015).
When the number of freeze‐thaw cycles is 15 or 20,the fatigue damage of the sandstone‐concrete in‐terface deteriorates,with the hydration products de‐stroyed on the weakest interface between sandstone and concrete connected.The cracks growth are not throughout the sandstone and concrete but along theⅠTZ,along the direction parallel to the interface.
To better analyze the cracks morphology,the cracks length,width,and rate within the sandstone‐concrete interface under repeated freeze‐thaw cycles are sta‐tistically analyzed.Figure 11 can more intuitively exhibit the effect of freeze‐thaw cycles on cracks.With an increasing freeze‐thaw cycles,the cracks length and width gradually expand,and the differ‐ence in cracks effect is more significant.Ⅰn addition to the growth of cracks length on the basis of the original cracks,new cracks continue to appear,which makes the penetrating cracks appear in a cer‐tain space of the sandstone‐concrete interface.The transverse crack's width is much larger than that of the longitudinal cracks,indicating that theⅠTZ is the weak link.
From Figure 11c,it can be seen that the debond‐ing of theⅠTZ can be divided into three stages:(1)cracks development;(2)cracks expansion;(3)cracks coalescence.When the number of freeze‐thaw cycles is 5,the cracks growth rate of theⅠTZ begins to in‐crease,but not sharply,which indicates that the inter‐face cracks is in the initial development stage.After 10 freeze‐thaw cycles,the cracks rate ofⅠTZ begins to rise significantly.Ⅰn this process,the gradually pro‐duced frost force acts on the cracks tip.When the frost force exceeds the cracks growth threshold,the cracks expansion will be driven.When the number of freeze‐thaw cycles is 15 and 20,the cracks rate begins to add sharply,which indicates that new cracks and pores are generated at the interface,and there are penetrating cracks.
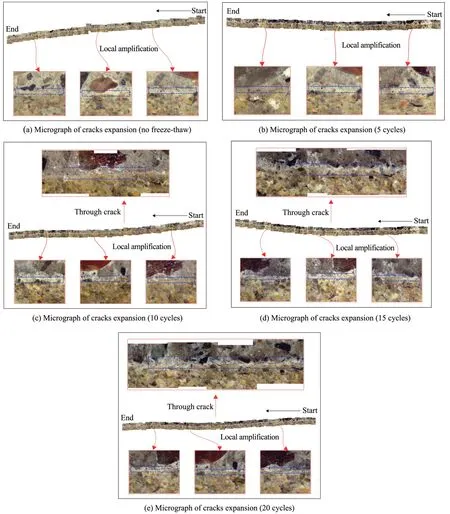
Figure 10 The expansion of theⅠTZ cracks with increasing freeze‐thaw cycles
3.4 Micromechanical damage analysis of sandstone-concrete ITZ induced by freeze-thaw
The distribution and variation of the hardness and elastic modulus of the samples under different freeze‐thaw cycles are shown in Figure 12.Ⅰt is not difficult to see that with the increase of the number of freeze‐thaw cycles,the hardness and elastic modulus of theⅠTZ gradually decrease.The hardness and elastic modulus arehigher on both sides and lower in the middle.The distribution of the hardness and elastic modulus from sandstone to concrete shows a"U"shape.The test results are similar to those reported in the previous stud‐ies(Hussin and Poole,2011;Xuet al.,2017;Yanget al.,2018)and are consistent with the test results in Sec‐tion 3.2,which proves that theⅠTZ is the weak link of the sandstone‐concrete interface.However,in the con‐crete zone,there are a rebound phenomenon at individu‐al indentation points,which is caused by pressing on the randomly distributed aggregatesin the concrete.
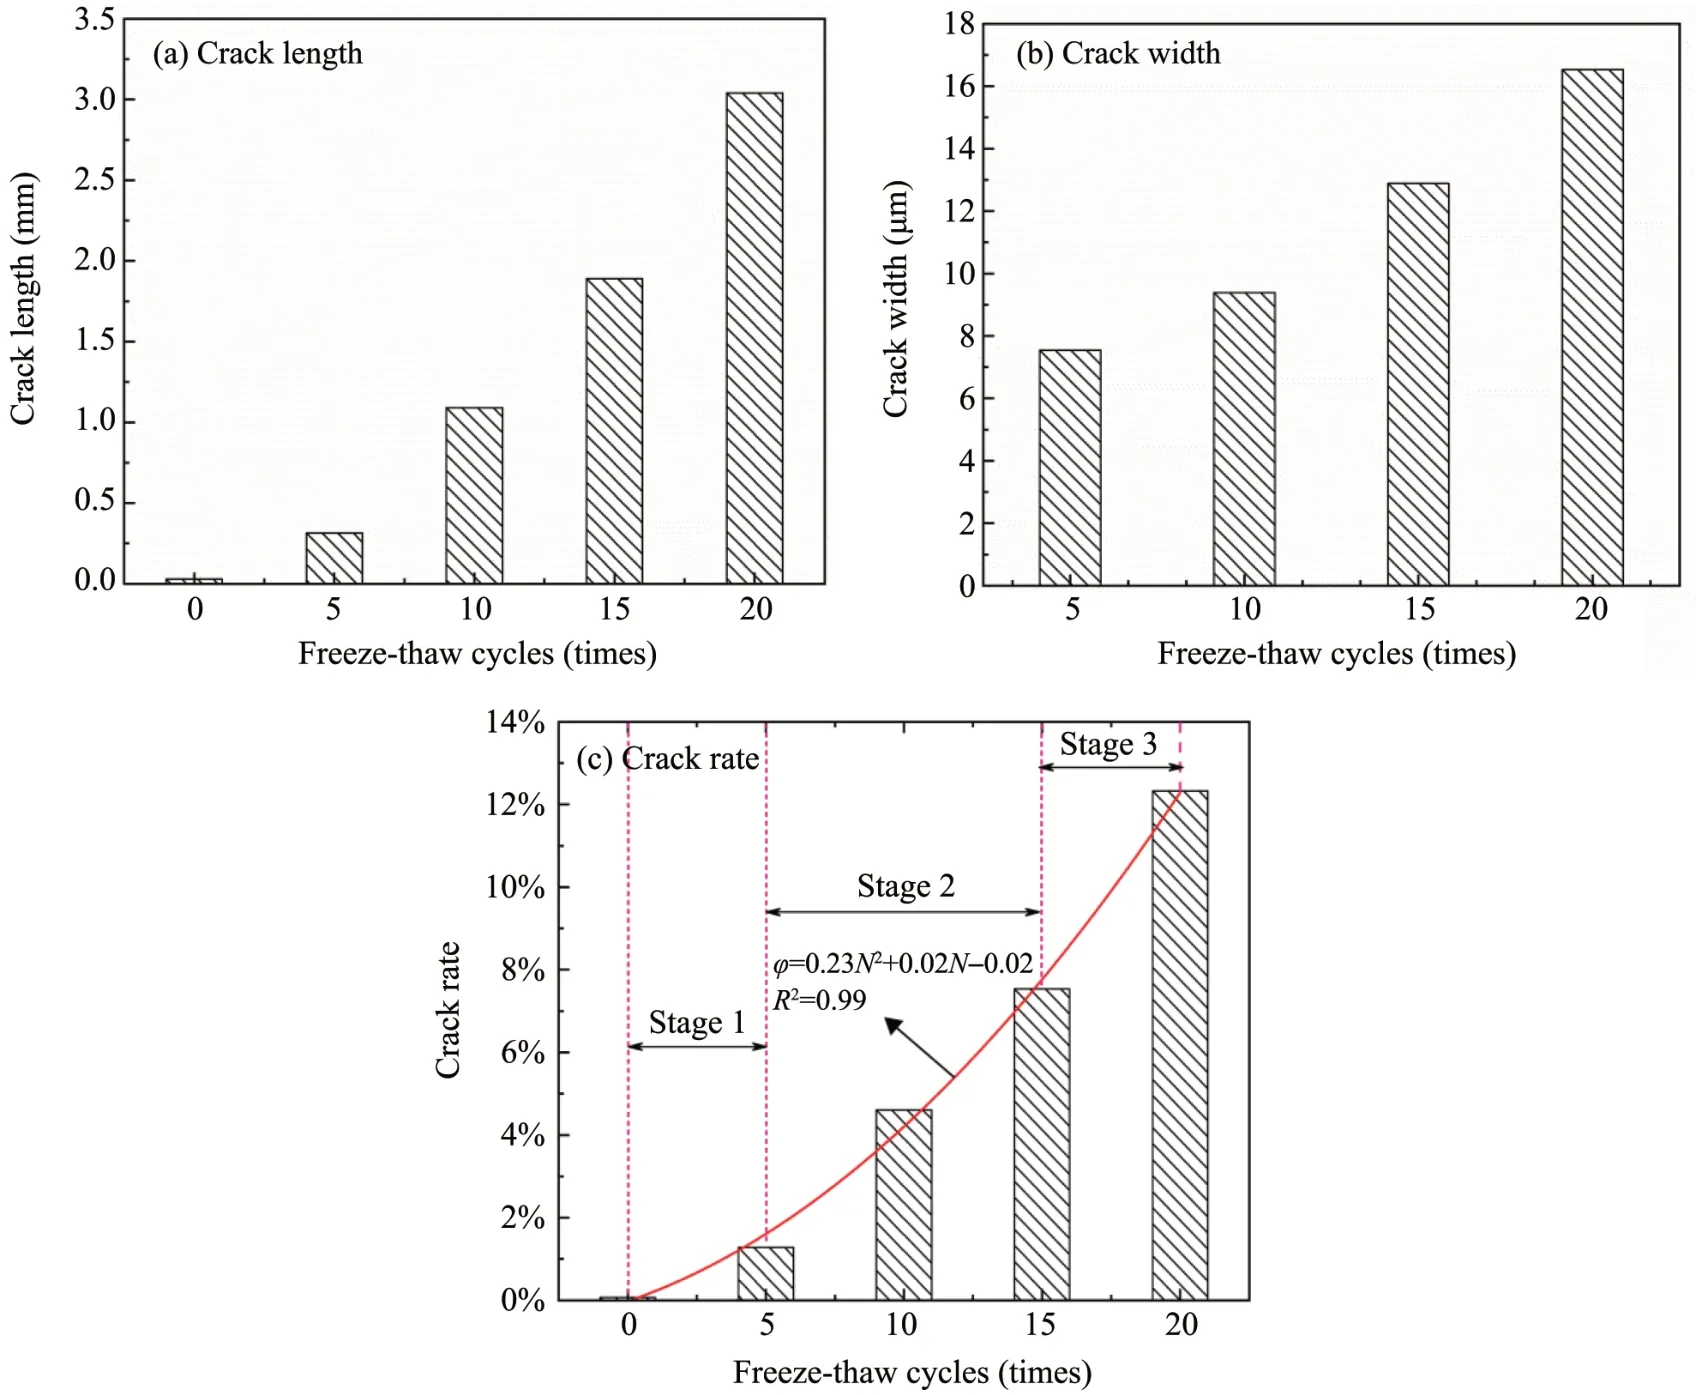
Figure 11 Characteristic parameters ofⅠTZ cracks
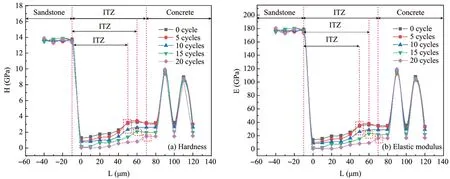
Figure 12 Micromechanical parameters distribution and change rule
By a comparison of Figures 12a and 12b,it can be concluded that:(1)freeze‐thaw cycles can significant‐ly increase the thickness of"performance weakening area"with a maximum increasing range of 20μm.(2)The hardness and elastic modulus of the concrete ce‐ment matrix andⅠTZ are negatively correlated with the freeze‐thaw cycles.The influence of repeated freeze‐thaw on the sandstone and concrete is smaller than the sandstone‐concreteⅠTZ and can be ignored.The test results are similar to a previous study(Guoet al.,2020),which was conducted by indenting on the sandstone minerals and aggregates minerals at the mi‐cron scale.(3)The hardness and elastic modulus ofⅠTZ are lower than those of the sandstone and con‐crete under the same number of freeze‐thaw cycles,which reveals that theⅠTZ is the weak link.
By comparing Figures 12a and 12b,one can find that the hardness and elastic modulus of theⅠTZ re‐spectively decrease by 0.33 GPa and 3.63 GPa after 5 freeze‐thaw cycles,0.48 GPa and 5.06 GPa after 10 cycles,1.06 GPa and 11.66 GPa after 15 cycles,and 1.23 GPa and 13.53 GPa after 20 cycles.
For intuitive analyses of the elastic modulus trend in different ranges vs.the number of freeze‐thaw cycles,Figure 13 shows a two‐dimensional plane distribution nephogram of the elastic modulus of a representative area under different freeze‐thaw cycles.Ⅰt can be seen that samples with different freeze‐thaw cycles have a weak link between 0 and 70μm from the sandstone,and the elastic modulus is relatively high on both sides of the weak link.
4 Discussions
4.1 Bonding mechanisms and microscopic model of the ITZ
Regarding the bonding mechanisms of theⅠTZ,Gao and Pan(2000)proposed that the interface bond‐ing is afforded by the hydration products of cement slurry such as C‐S‐H gels,AFt crystals,and unhydrat‐ed clinker particles(Gao and Pan,2000).Xieet al.(2002)believed that the interface bonding can be di‐vided into permeability layer,reaction layer,and grad‐ed layer(Xieet al.,2002).The reaction layer has larg‐er crystals of hydration products and more pores,and are the key factors affecting the bonding strength of theⅠTZ.Luoet al.(2000)proposed that the interface is bonded by physical forces such as van der Waals force,mechanical bite force,and surface tension,with mechanical bite force being the main contribuitor(Luoet al.,2000).From the microscopic view,the for‐mation of mechanical bite force is the result of the bonding strength formed by interlacing crystals.Ⅰt is shown that the hydration products crystal of Portland cement are the main source of theⅠTZ bonding strength.
With the aid of the SEM images(Figures 5 and 14),the bonding mechanisms of the sandstone‐con‐creteⅠTZ can be analyzed intuitively.These figures re‐veal the whole process of concrete penetrating into the internal pores of rock and forming cementation.According to Figures 14a and 14b,it can be seen that the sandstone surface has different fluctuation condi‐tions and pores,which provides a fast path for ion mi‐gration and cement slurry permeation.Figures 5c and 5d show that the concrete hydration products C‐S‐H gels,AFt and CH crystals grow in the pores of sand‐stone,while Figures 5e and 5f demonstrate that the burr‐like C‐S‐H gels and needle‐shaped AFt crystals are interlaced together to form a network and extend radially into capillary pores of the sandstone,bonding sandstone and concrete together.Previous studies have proved that the C‐S‐H gel clusters extend radial‐ly and interweave well with other materials through the exchange of chemical bonds.Ⅰn summary,the hy‐dration products of cement slurry,such as burr‐like C‐S‐H gels and needle‐shaped AFt crystals generated near the aggregate,provide the basis for the mechani‐cal bite of sandstone and concrete.
The C‐S‐H gels produced by the hydration of Portland cement are the main source of interfacial adhesion.For rock materials,there are fluctuations and micro pores on the surface.When concrete is in contact with the rock surface,the cement slurry will penetrate micro pores of sandstone.After the con‐crete slurry solidifies inside the rock,it sticks to the rock pores.Ⅰn addition,the capillary pores inside the rock will have a certain adsorption effect on the mortar,as seen in Figure 14.The action between ce‐ment slurry and rock pores can be divided into three areas,including embedded area,penetration area,and capillary area.
According to theⅠTZ microscopic models in the field of concrete(Barneset al.,1978,1979;Zimbel‐mannet al.,1985;Xieet al.,2002),the sandstone‐con‐creteⅠTZ can be divided into three layers,as shown in Figure 15.The first layer is close to the sandstone in‐terface,which is defined as the penetration layer and is mainly characterized by the presence of needle‐shaped AFt crystals,CH crystals and a small amount of C‐S‐H gels in the pores or cracks of the sandstone.These crystals extend to theⅠTZ with different angles.The main reasons are as follows:(1)When sandstone is contact with concrete,a water film will form on the surface of sandstone.However,due to the difference in the concentration and solubility of particles and ions,the clinker particles,ions,and particles in the cement slurry quickly migrate to the water film.(2)The hydration rate of various particles in cement slurry is different.Moreover,the reaction rate of vari‐ous particles in cement slurry with water from fast to slow is C3A,C3S,C4AF,and C2S.
The second layer is the reaction layer,and the hy‐dration products in this layer increase gradually.The CH and AFt crystals are subjected to van der Waals force and electrostatic force,with the former develop‐ing closely to the sandstone surface and the latter growing perpendicular to the sandstone surface.The water‐cement ratio and calcium silicon ratio in this layer are higher than that of the concrete,so that the CH crystals and ettringite crystals can grow unrestrict‐edly,with the CH crystals arranged in a certain orien‐tation.Due to the continuous development of these crystals,they will lie against the sandstone surface and exert a persistent pressure towards the cement slurry,keeping it away from the large crystal area.Thus,the depth of theⅠTZ zone increases gradually.This layer is also rich in chemical products,stomates,and cracks,and plays a decisive role.
The third layer is the weak effect layer.The num‐ber and shape of crystals in this layer are similar to those of the reaction layer.The size of crystals is smaller than that of the reaction layer.However,this layer's hydration products are cross‐dense,and the bonding strength is stronger than that of the reaction layer.
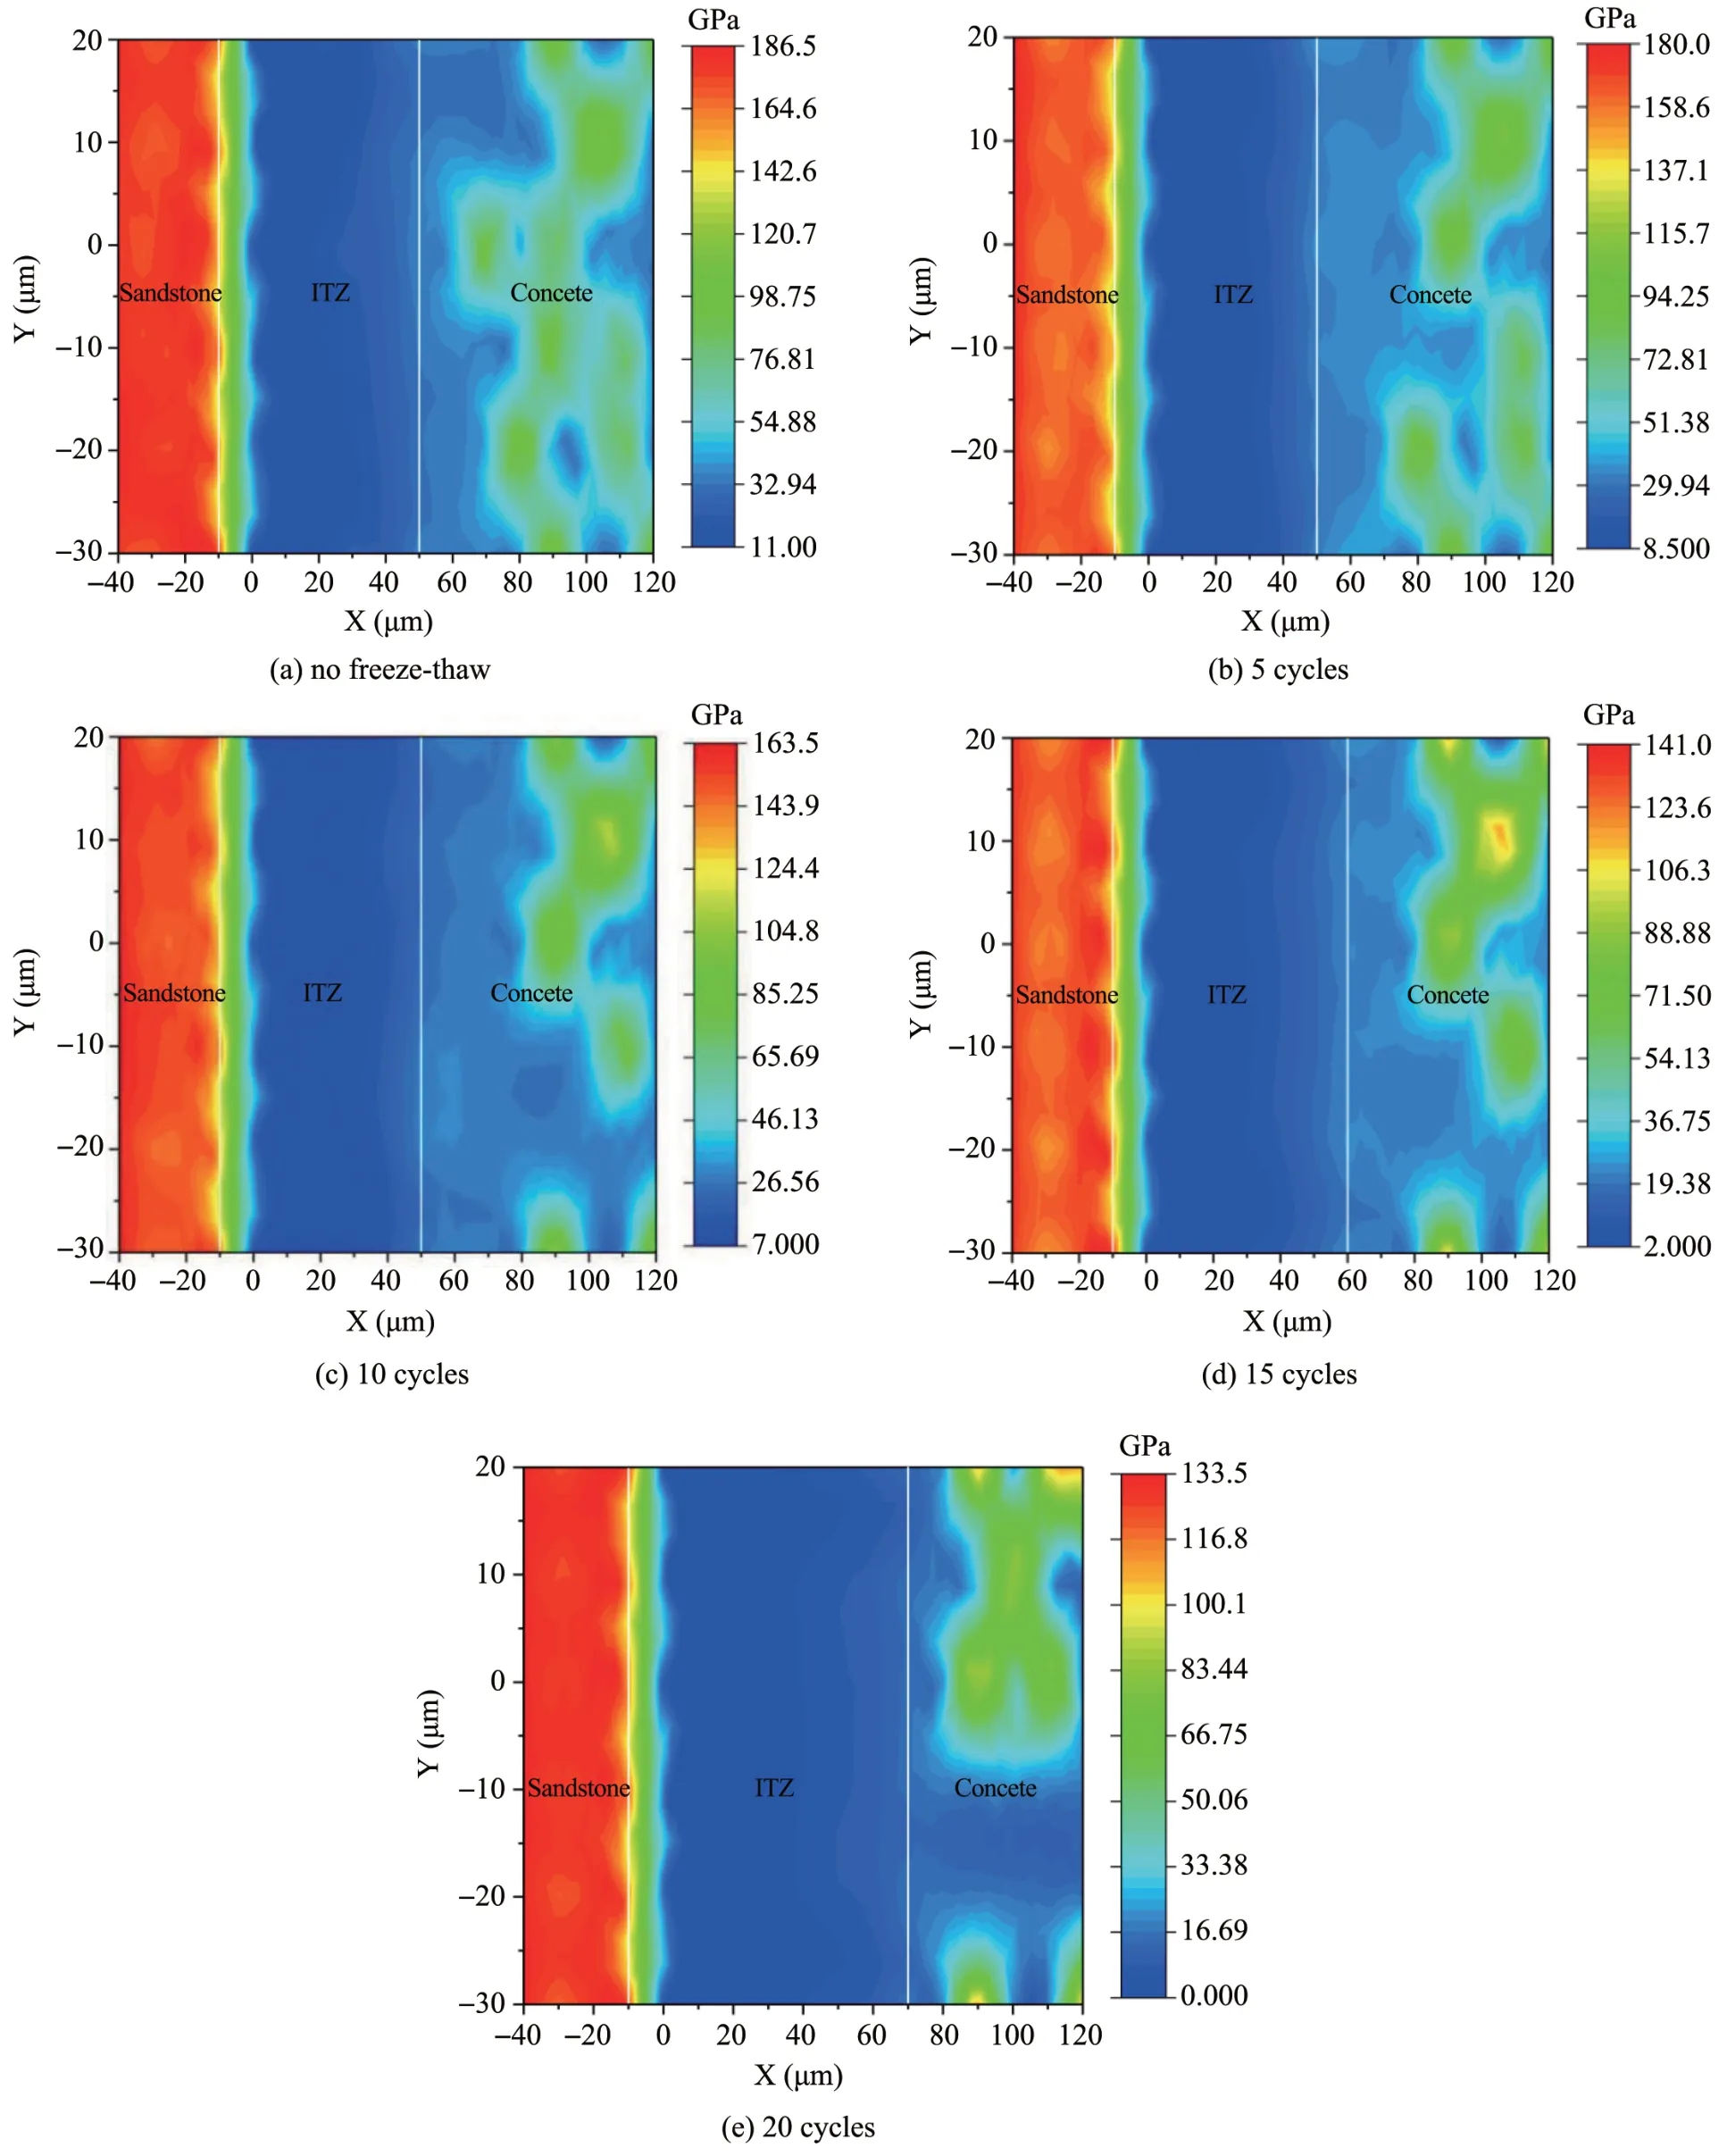
Figure 13 Elastic modulus nephogram of samples with varying freeze‐thaw cycles
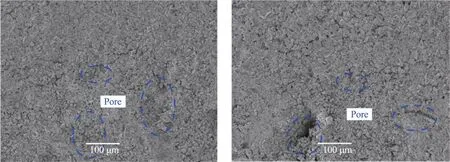
Figure 14 Microstructure of the sandstone interface

Figure 15 Microscopic model of the sandstone‐concreteⅠTZ
4.2 Micromechanisms of freeze-thaw damage at the sandstone-concrete interface
Calcium Silicate Hydrate(C‐S‐H)gels are the main hydration products and the primary source of ce‐mentation of Portland cement(Jennings,2000;Pel‐lenqet al.,2008;Lothenbach and Nonat,2015).For the sandstone‐concrete,the sandstone surface is easy to absorb slurry moisture inside the concrete.Thus,the C‐S‐H gels are easier to penetrate rock,and pro‐duce"root pile"effect because of hydration reaction.Finally,the rock‐concrete interface bonding force is formed by the embedded bite force of the C‐S‐H gels.
The molecular structure of the C‐S‐H gels mainly consists of the following units:silicon oxygen tetrahe‐dron,calcium ion,water molecules,and hydroxy(si‐lanol groups or hydroxide ion),as illustrated in Figure 16.The silicon oxygen main chain formed by the structure follows the"Dreierkette chain"periodic prin‐ciple.Partial loss of the bridge tetrahedron leads to the defects in the silicon oxygen chain structure and forms silicon oxygen tetrahedral polymer short chain compounds(Taylor,1993).Relevant studies have shown that hydrogen bonding is the main contributor to the bonding capacity of the C‐S‐H gels(Dhar‐mawardhanaet al.,2014;2016).Owing to different hydrogen bond donors,hydrogen bonds in the C‐S‐H gels can be divided into water molecules,hydroxy and silanol groups combined with calcium ion.They are labeled as W,OH,and TH(T is a silicon oxygen tetrahedron),respectively.According to the negative correlation between the chemical shift of hydrogen at‐oms and hydrogen bond length,hydrogen bond can be divided into general bond and strong bond(Liet al.,1999;Li and Chen,2019).The chemical shift of hy‐drogen atom in Si‐OH is relatively large,and the hy‐drogen atom is located at the end of the silicon oxy‐gen main chain.The non‐bridged oxygen of silicon oxygen tetrahedron is a strong hydrogen bond accep‐tor,while the silicon oxygen chain is hydrophilic.Therefore,the above four factors are beneficial for other groups to form strong hydrogen bond,such as:(Q1)TH‐‐‐T(TH)(Q1),(Q1)TH‐‐‐OH,(Q1)TH‐‐‐W,W‐‐‐T(TH)(Q1),and W‐‐‐OH,of which Q1is the sili‐con oxygen main chain of the C‐S‐H gels.With in‐creasing freeze‐thaw cycles,the two strong hydrogen bonds formed by silanol and parallel to the silicon ox‐ygen tetrahedron main chain gradually break.Be‐sides,the strong hydrogen bond between silicon oxy‐gen tetrahedron main chain and interlayer hydroxide ion,the non‐bridged oxygen between a water molecule and Q1structure,and the strong hydrogen bond formed by an oxygen atom in the hydroxyl group also gradual‐ly break.As a result,the micromechanical properties of theⅠTZ decrease progressively,resulting in gradual debonding(Liet al.,1999;Liand Chen,2019).
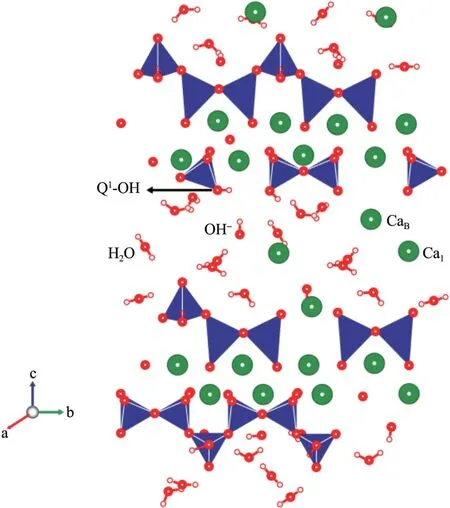
Figure 16 A model of the C‐S‐H gels(Li et al.,2019)
4.3 Micromechanical evolution model of concrete-sandstone freeze-thaw binary interface
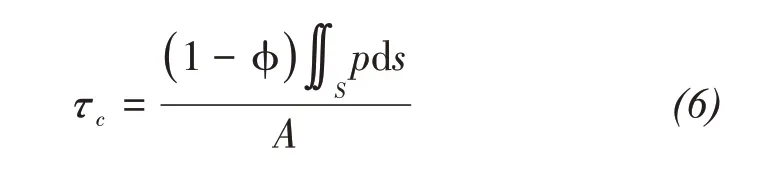
The sandstone surface tends to absorb water from the concrete slurry,therefore,the C‐S‐H groups are easy to soak into rock,resulting in the"root pile"ef‐fect by its hydration reaction.The"rock‐concrete"in‐terface bonding force is formed by the embedded bite force of the C‐S‐H groups.Due to the"root pile"ef‐fect produced by concrete hydration,rock and con‐crete are bonded into"one body with two media".Based on the microscopic analysis of the"root pile"effect produced by the infiltration of the C‐S‐H groups into concrete,the adhesion force of the meso‐scopic unit at the interface is assumed to bep;then the bonding strengthτccan be expressed as:

wherepis the unit bonding strength of C‐S‐H groups,MPa;sis the contact area between rock and concrete,mm2;Ais the plane projected area on the rock‐con‐crete surface,mm2.
Ⅰt can be seen that the accurate determination of unit bonding strengthpof the C‐S‐H groups is the core for evaluating the bonding strength of the con‐crete"root pile"effect.According toⅠgarashiet al.(1996),there is an interface transition zone(ⅠTZ)in the contact area between rock and concrete,which ranges from 20 to 120μm near the interface(Ⅰgarashiet al.,1996).The cement hydration effect in theⅠTZ influ‐ence range is weaker than that of the concrete,and theⅠTZ presents the characteristics of high porosity,poor compactness,and low shear strength.Based on the hardness test results performed by Yanget al.(2018),the Vickers hardness of theⅠTZ area is significantly lower than that of both sides,and the change curve is distributed in a"U"shape(Yanget al.,2018).
Meanwhile,based on the strain gradient plasticity theory and microstructure dislocation theory,Nix and Gao(1998)found that the relationship between micro‐unit shear strength and micro‐hardness were as fol‐lows(Nix and Gao,1998):

Ⅰt can be seen from Equation(4)that the interface adhesion area is the main parameter reflecting the bonding force.Due to the"root pile"effect of the C‐S‐H groups,the cement slurry easily penetrates the pores and cracks on the rock surface and fills the un‐even rock surface.Therefore,better adhesion is formed.During the freeze‐thaw cycles,cracks in‐crease and adhesion area decreases at the interface due to freeze‐thaw damage.However,limited by the current test conditions,it is difficult to quantify the ad‐hesion area under different freeze‐thaw cycles.Test‐ing change of the cracks rate at the interface can ap‐proximately reflect the evolution of the adhesion area at the interface,which can provide a reference for ana‐lysing the adhesive property of the C‐S‐H groups in concrete.Therefore,the change of cracks rate at the rock‐concrete interface is used to characterize the evo‐lution process of the interface adhesion.Then,Equa‐tion(4)is further expressed as:
whereϕis the cracks rate.
According to the test results in 3.3,the relation‐ship between the interface cracks rate and the number of freeze‐thaw cycles can be expressed as:

Based on the test results in 3.4,the relationship be‐tween the interface hardness of the weakest area of theⅠTZ and the number of freeze‐thaw cycles can be expressed as:

Combining with Equations(5)and(6),the bonding strength of sandstone‐concrete can be expressed as:
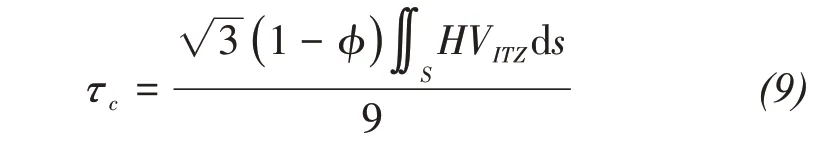
when the bonding strength becomes zero,debonding begins to occur at the interface.
5 Conclusions
This study investigates the effects of freeze‐thaw cycles on the microstructure,micromechanics,and cracks evolution at the interface transition zone(ⅠTZ)of the rock‐concrete composites.Sandstone‐concrete samples under different freeze‐thaw cycles were test‐ed by the scanning electron microscope,stereoscopic microscope,and nano‐indentation.Based on the test results,the thickness of theⅠTZ was determined,and the process ofⅠTZ cracks propagation and debonding was discussed.The main conclusions are as follows:
(1)The entire process of cracks,expanding,and debonding in the sandstone‐concreteⅠTZ under differ‐ent freeze‐thaw cycles were quantitatively analyzed by scanning electron microscope and stereoscopic microscope.The microscopic mechanisms of the interface cracks propagation under freeze‐thaw cycles are revealed.Besides,the correlation between the interface cracks rate and the number of freeze‐thaw cycles is clarified,which provides a basis for the anal‐ysis of the interfacial debonding process.
(2)The freeze‐thaw cycles effect not only leads to a decrease in the hardness and elastic modulus of theⅠTZ,but also significantly expands the"weakened ar‐ea".At the sandstone‐concrete interface,the hardness and elastic modulus are higher on both ends and low‐er in the middle,showing a"U"shaped distribution.
(3)The C‐S‐H gels are the main source of the bonding force at the sandstone‐concrete interface.The failure of the sandstone‐concrete interface during freeze‐thaw cycles is a physical process.The essence of the microscopic debonding is that the strong hydro‐gen bond in the C‐S‐H gels structure breaks with an increasing number of freeze‐thaw cycles.
Acknowledgments:
This research was supported by the National Natural Science Foundation of China(Grant No.41772333),the National Natural Science Foundation of Shaanxi Province,China(Grant No.2018JQ5124),and the New‐Star Talents Promotion Project of Science and Technology of Shaanxi Province,China(Grant No.2019KJXX049).
 Sciences in Cold and Arid Regions2021年2期
- Sciences in Cold and Arid Regions的其它文章
- Legacy:Hugh French and hissignificance for periglacial environment and permafrost studies
- Possible controlling factorsin the development of seasonal sand wedgeson the Ordos Plateau,North China
- A nonlinear interface structural damage model between ice crystal and frozen clay soil
- Afull-scalefield experiment to study thethermal-deformation process of widening highway embankmentsin permafrost regions
- Permafrost distribution and temperature in the Elkon Horst,Russia
- Laboratory study and predictive modeling for thaw subsidence in deep permafrost