Effect of river plume on phytoplankton community structure in Zhujiang River estuary*
Qi ZHONG, Bing XUE , Md Abu NOMAN ,3, Yuqiu WEI , Haijiao LIU,Hongbin LIU, Liping ZHENG , Hongmei JING, Jun SUN ,3,**
1 Institute of Marine Science and Technology, Shandong University, Qingdao 266200, China
2 Research Centre for Indian Ocean Ecosystem, Tianjin University of Science and Technology, Tianjin 300457, China
3 Tianjin Key Laboratory of Marine Resources and Chemistry, Tianjin University of Science and Technology, Tianjin 300457,China
4 Department of Ocean Science and Division oflife Science, Hong Kong University of Science and Technology, Hong Kong 999077, China
5 Institute of Deep-sea Science and Engineering, Chinese Academy of Sciences, Sanya 572000, China
Abstract To examine the phytoplankton assemblages and the eff ect of diluted waters on them, a research cruise was conducted from July 19 to August 7, 2015 in the Zhujiang (Pearl) River estuary in the northern South China Sea (21°N-23.5°N, 111°E-117°E). Samples were collected from 65 stations including one for time-series sampling. A total of 212 phytoplankton taxa were identified from 61 genera belonging to 4 phyla. Among them, 122 species identified from 42 genera of Bacillariophyta and 83 species from 15 genera of Pyrrophyta. Chain-forming diatoms dominated the phytoplankton community where Pseudonitzschia delicatissima, Guinardia striata, Thalassionema nitzschioides, and P. pungens comprised about 52% of the total abundance. However, higher cell abundances concentrated on both sides of the estuary,because oflow salinity and high nutrients brought by diluted water. In addition, Canonical Correspondence Analysis revealed that salinity and dissolved inorganic nitrogen shaped the species composition in the study area. Furthermore, the Jaccard similarity index showed prevailing high similarity in the distribution of species in low-salinity diluted waters, and the Bray-Curtis similarity depicted distinguished grouping for phytoplankton assemblages along the salinity gradient. However, phytoplankton diel vertical cycles showed maximum abundance occurred at 2꞉00 am, which was mainly contributed by benthic phytoplankton species Pseudo-nitzschia spp. and T. nitzschioides.
Keyword: phytoplankton; Canonical Correspondence Analysis; diel cycle; Zhujiang (Pearl) River estuary
1 INTRODUCTION
The South China Sea (SCS) is a semi-enclosed sea and the largest marginal sea of the west Pacific Ocean(Liu et al., 2002). It is located in the tropicalsubtropical region and prevails southwest monsoon in summer, causing utmost seasonal variations (Peng et al., 2006). The northern SCS (nSCS) is aff ected by riverine input, coastal upwelling, mesoscale eddies,Kuroshio intrusion, and other dynamic processes,which makes the hydrological and nutrients condition complex and ecologically important (Lu et al., 2010;Han et al., 2012; Lin et al., 2014; Zhang et al., 2016;Guo et al., 2017). Like other large Chinese rivers, the Zhujiang (Pearl) River drainage area is well-cultivated with commercial crops, which increased nitrate concentration higher and phosphate concentration somewhat constrained (Cai et al., 2004). Furthermore,the conjunction of the Zhujiang River with the Mekong River provides a large freshwater input to the nSCS (Dagg et al., 2004).
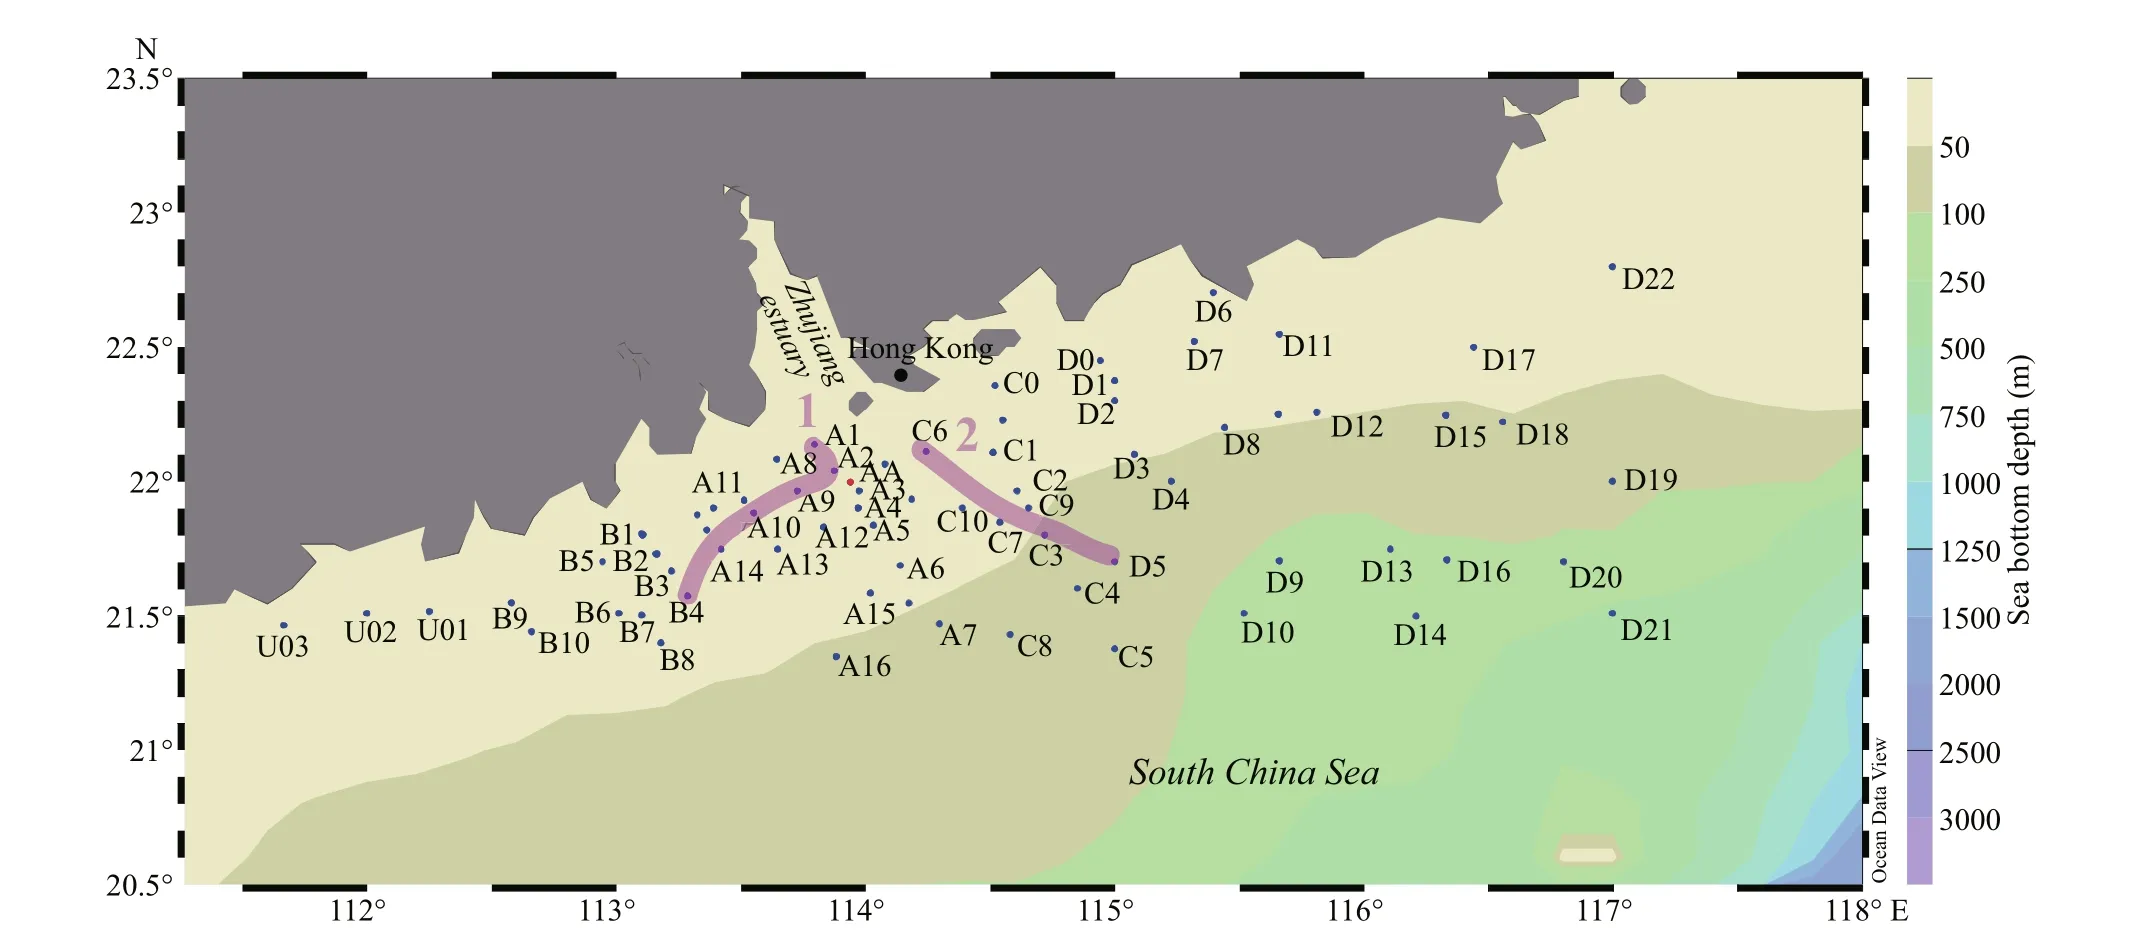
Fig.1 Sampling locations in the Zhujiang River estuary and northern South China Sea
Phytoplankton is one of the most significant primary producers, off ering about half of the ocean primary production (Sun, 2011). Variations of phytoplankton structure can change the global climate by carbon flux(Sarmiento et al., 1988), cloud albedo (Charlson et al.,1987), and oceanic luminous flux and heat flux(Sathyendranath et al., 1991). Moreover, phytoplankton can react quickly to sensitive ecological changes(Reynolds, 1984; Stolte et al., 1994). Hence,phytoplankton is regarded as a biological indicator to observe ocean ecosystem alterations via seasons,nature and human-induced (Harris, 2012; Rimet and Bouchez, 2012). Temperature, salinity, hydrographic and environmental conditions have a great eff ect on phytoplankton assemblages (Gong et al., 2003; Chen et al., 2004; Tian and An, 2013) through controlling their photosynthesis (Shen and Shi, 2002) and cellular metabolism (Pilkaitytë et al., 2004).
Research work on the phytoplankton in the SCS began since the 1970s (Guo, 1983). Afterwards, Le and Ning (2006) and Sun et al. (2007) studied community structure and spatial patterns of phytoplankton, while Peng et al. (2006) explained dynamics of phytoplankton growth due to nutrient increase, Chen et al. (2006) discussed community distinctions of phytoplankton in an upwelling region,as well as in warm eddy waters. However, not in summer but in winter, some studies were done on phytoplankton community and other factors regulating growth and development of phytoplankton (Ma and Sun, 2014). Although previous studies on community structures of phytoplankton in the nSCS have achieved some quantitative assessments, there is a deficiency ofinformation about the influence of river discharge on the summer phytoplankton assemblages of this region and their diel cycle. Therefore, to analyze the distributions of the phytoplankton assemblages and the eff ect of river discharge, species composition and their diel cycle during summer in the nSCS, which will provide indispensable information for future research here.
2 MATERIAL AND METHOD
2.1 Study areas and field samplings
The northern South China Sea and Zhujiang River estuary summer cruise was conducted in 2015 (July 19 to August 7) from 21°N-23.5°N and 111°E-117°E in the nSCS. Samples were collected in 65 stations including a time-series station. Apart from the time series station (AA), 196 water samples were collected covering 65 stations (Fig.1). Two unique sections were selected to observe the eff ect of river plume on the phytoplankton assemblages (Fig.1). Water samples were collected from 3 to 6 distinct depths at each station from the surface to 200 m (sampling depths relied upon the bottom depth) utilizing a rosette sampler equipped with a CTD (SBE 917 Plus,Seabird Co.). Time-series samples were collected every three hours around o’clock in the time series station (AA). Hydrological parameters including water temperature, salinity, water depth, and hydrostatic pressure were also recorded by the CTD.Collected water samples of diff erent layers were transferred into 250-mL polypropylene bottles and then fixed in 2% (final volume concentration) buff ered formalin solution and stored in darkness. Nutrients samples were also collected with Niskin water samplers and stored at -20 °C until analysis.
2.2 Sample analysis
In laboratory, for the phytoplankton enumeration,25-mL samples were settled through a settling column for 24 h following the modified Utermöhl method by Sun et al. (2002). Thereafter, phytoplankton cells were identified and enumerated through an inverted microscope (Olympus, Motic AE 2000) at 200× (or 400×) magnification. The taxonomic identification of phytoplankton was done according to Jin et al. (1965)and Yamaji (1991) and simultaneously, the Latin name of certain phytoplankton was referred to Sun et al. (2002). Nutrients including dissolved inorganic nitrogen (DIN), silicate, and phosphate were analyzed by using a Technicon AA3 Auto-Analyzer (Bran-Luebbe) (Han et al., 2012).
2.3 Data analysis
The dominant species of phytoplankton were assessed by the dominance index ( Y) (Sun and Liu,2004):

To explain the species diversity, Shannon-Wiener diversity index ( H′) was calculated by the following formula (Shannon, 1948):

Species evenness was calculated by Pielou’s evenness index ( J), mentioned by Pielou (1969):
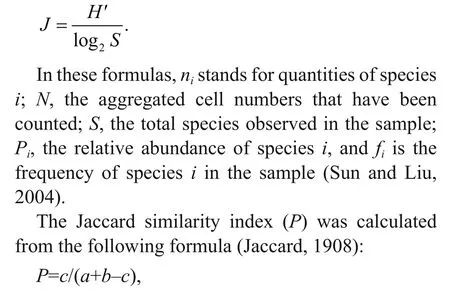
where a and b are the numbers of species in two diff erent samples, and c is the number of the common species in the two samples.
Horizontal, sectional and time-series distribution of phytoplankton and other physiochemical parameters were projected by Ocean Data View(Version 4.6.7). The Box-whisker plots (made by Grapher 10) were used to demonstrate the vertical distribution of all phytoplankton groups in the investigated region. Relationships between phytoplankton and environmental parameters were analyzed through Canonical Correspondence Analysis (CCA; Canoco 4.5). Bray-Curtis similarity-based cluster analysis was analyzed (PRIMER 6.0) to find out the grouping of phytoplankton assemblages in coastal waters and mixed waters (Clarke and Gorley, 2001).
3 RESULT
3.1 Environmental conditions
According to the T- S diagram (Fig.2), two diff erent types of water masses were identified from this area as the diluted water of the Zhujiang River estuary has made eff ects on salinity and other essential elements of water masses. The ‘coastal waters’ meant that primarily influenced by the river plume (salinity lower than 32, Chen et al., 2018); and ‘mixed water’meant that less influenced by diluted waters, in which salinity was higher (>32) (Fig.2).
The temperature of surface water varied between 26.28 to 31.09 °C (mean value of 28.78 °C); while the salinity ranged from 28 to 33.89. During the investigation, the distribution of surface temperature was increased generally along the coast of eastern Guangdong province to the external ocean, and the water temperature in the southwest was higher than the northeast (Fig.3). Salinity in the inshore area was relatively lower than the off shore. Especially, the dominance of coastal waters (salinity <32) in the Zhujiang River mouth and nearby areas depicted the influence of freshwater intrusion. Section distribution(Fig.4) showed that temperature in both sections decreased vertically while salinity demonstrated the reverse trend. The vertical distribution of salinity exhibited the influence of diluted water particularly in the shallow waters.
3.2 The species composition of phytoplankton assemblages
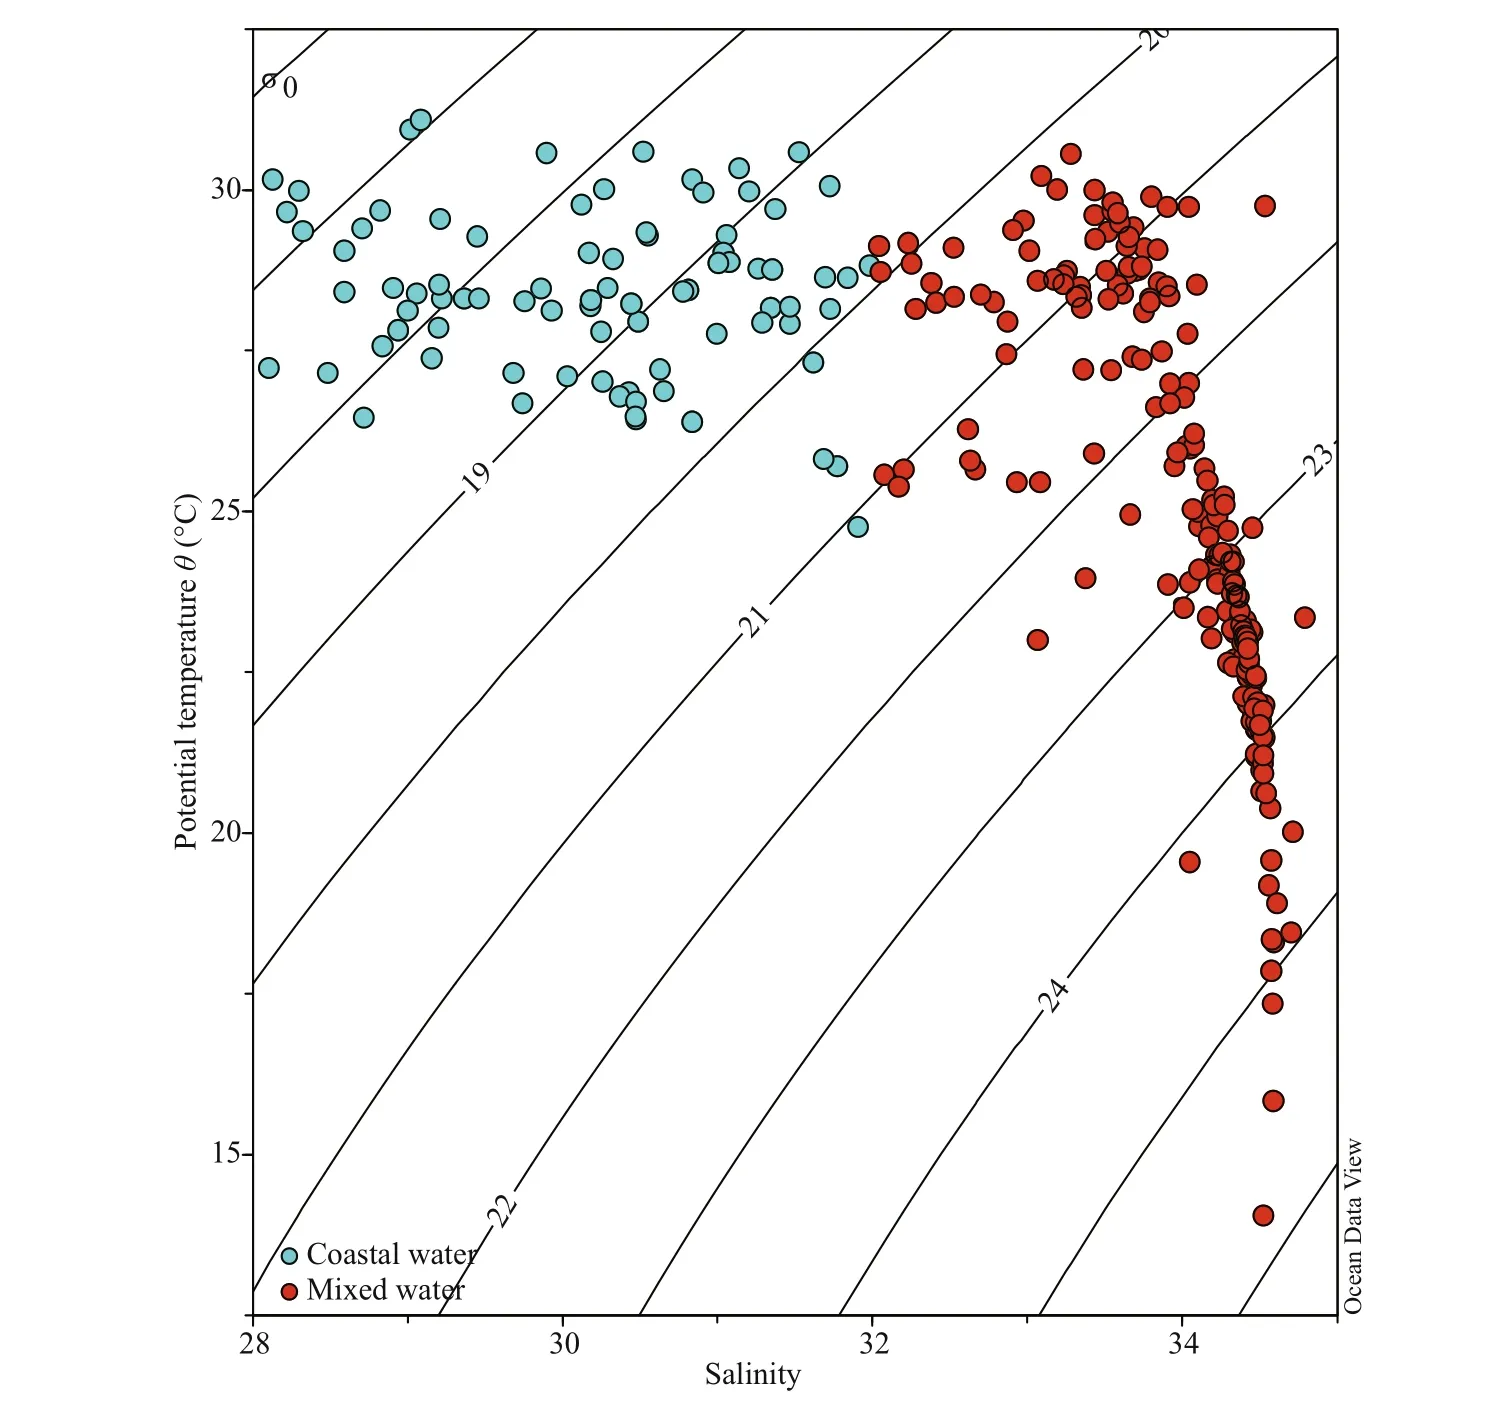
Fig.2 Temperature and salinity ( T- S) scatter plot showing the water masses distribution of the survey area

Fig.3 Surface distribution of temperature (°C) (a) and salinity (b)
During the study period, 212 phytoplankton taxa were identified from 61 genera belonging to 4 phyla.Bacillariophyta and the Pyrrophyta contained the highest number of taxa while Chrysophyta and Cyanophyta shared less in the number of taxa. Among them, 122 species occupied 42 genera of Bacillariophyta represented 57.54%, while 83 species from 15 genera of Pyrrophyta accounted for 39.15%.With the exception of one species that were uncertain,other species were progressively sporadic, including 2 taxa from 2 unique genus of Chrysophyta and 4 taxa from 2 distinct genera of Cyanophyta comprised 0.94% and 1.88% respectively. Phytoplankton of warm-temperate near-shore species in the studied region was high in numbers. Pseudo- nitzschia delicatissima, Thalassionema nitzschioides,P. pungens, and Guinardia striata were the dominant species (Table 1). Additional to Trichodesmium thiebautii and T. erythraeum, these dominant species belonged to Bacillariophyta (Table 1).
3.3 Phytoplankton abundance
Among the diff erent water layers, the cell abundance of phytoplankton in the survey area displayed a great variation, fluctuating from 0.07×10³cells/L to 702.93×10³cells/L with the average abundance of 45.61×10³cells/L. In the present study, diatoms were the most dominant group among the phytoplankton (mean value of 43.85×10³cells/L) occupying 96.14% of the total cell abundance, followed by dinoflagellates (mean value of 0.49×10³cells/L) encountered 1.09% of the total cell abundance. Though it comprised a small percentage of the total cell abundance, Dictyocha fibula of Chrysophyta was also identified in many stations ( fi=0.208), with the maximum abundance of 1275.86 cells/L from 30-m depth at Station D3.

Fig.4 Distribution of temperature and salinity along section 1 and 2
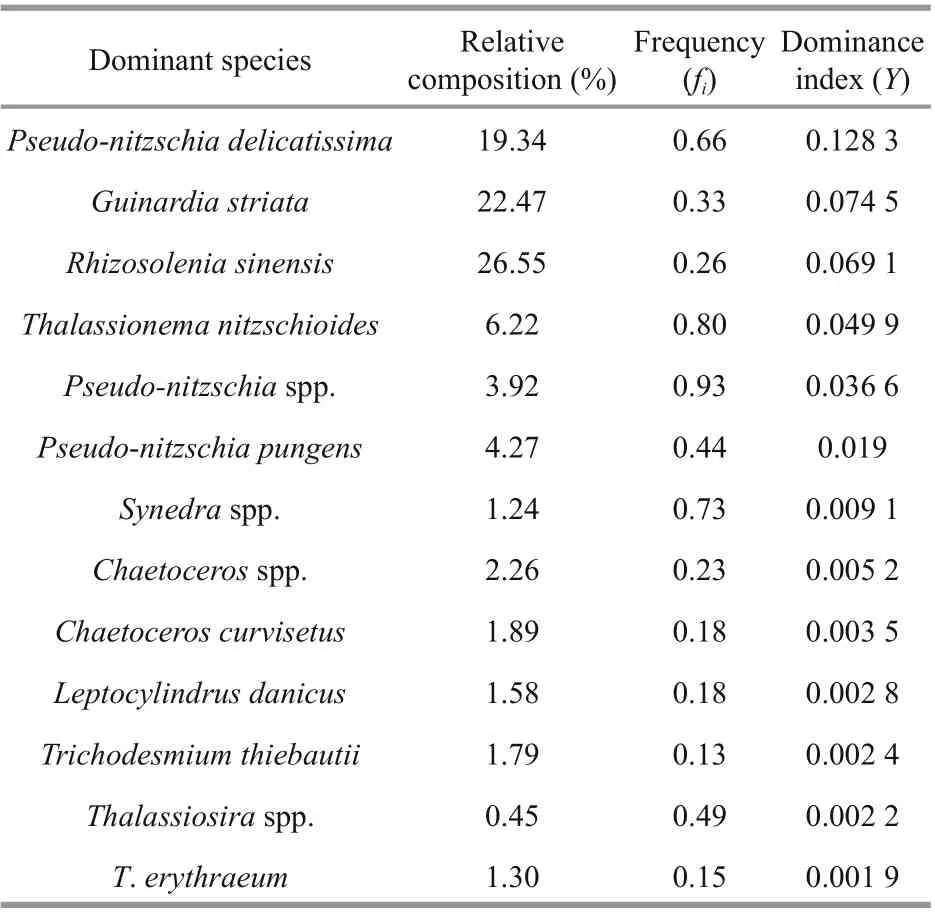
Table 1 Diff erent dominant species of phytoplankton in the survey area in summer 2015
3.3.1 Vertical and horizontal distribution of phytoplankton
The vertical distribution of phytoplankton in the survey area has been analyzed (transformed by log10)and graphically represented through Box-whisker diagram. As appeared in Fig.5, the maximum cell abundance of phytoplankton observed in the surface layer. With the increase of water depth, the cell abundance of phytoplankton decreased gradually.Among them, the vertical distribution of diatoms kept analogous with the total phytoplankton. Similarly,dinoflagellates also showed a more or less decreasing pattern with the increasing water depth.
The horizontal distribution of phytoplankton showed a general declining trend from the shore to the outer sea (Fig.6). The phytoplankton abundance was higher in coastal waters near the Zhujiang River mouth particularly in both sides of the river mouth than in any other zones. The distribution of diatoms mirrored the spatial pattern of phytoplankton.However, bearing a small percentage of the cell abundance, dinoflagellates had little eff ect on the overall abundance, and even showed higher abundance in coastal waters.
3.3.2 Section distribution of phytoplankton Figure 7 represents the appropriation of cell abundance in diff erent sections. Similar to the surface distribution, the abundance of diatoms was harmonious with total abundance. Despite the cell abundance decreased with the depth, the cell abundance of dinoflagellates varied irregularly whereas cyanobacteria always appeared to the upper layer of each section. Therefore, the phytoplankton abundance was higher in the near-surface area influenced by diluted waters as we hypothesized earlier that diluted waters dominated the shallow part of waters.
3.3.3 Composition and distribution of dominant species
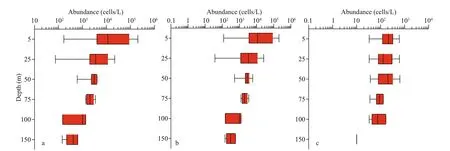
Fig.5 Vertical distribution of phytoplankton cell abundance (cells/L)
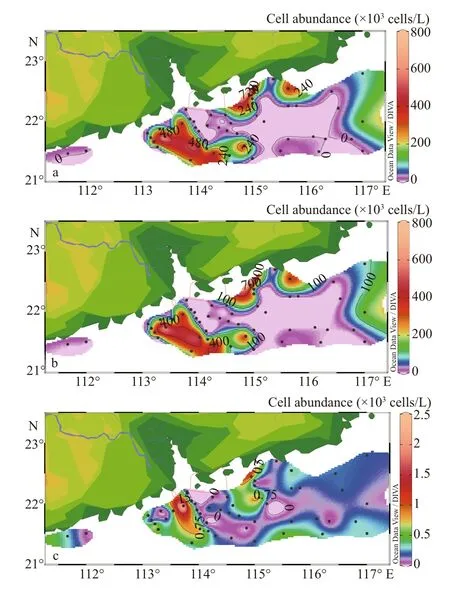
Fig.6 Horizontal distribution of phytoplankton cellabundance in the surface water (×10 3 cells/L)
The maximum abundance of dominant species was recorded mostly in the surface layer. As it is shown in Fig.8, particularly, all the dominant species had high cell abundance in both sides of the Zhujiang River estuary, which was amicable with the spatial pattern of surface phytoplankton. The average cell abundance of P. delicatissima was 9.42×10³cells/L,while the highest cell abundance was observed from 5-m depth in Station D11 off the shoreline of Guangdong. G. striata (mean 9.52×10³cells/L) and Rhizosolenia sinensis (mean 11.62×10³cells/L) cell abundance also reached the maximum at the 5-m depth in the Station A7. In addition, T. nitzschioides(mean 4.03×10³cells/L) with the highest cell abundance (70.22×10³cells/L) appeared at the layer of 20 m in Station D2. Pseudo-nitzschia spp. (mean 2.35×10³cells/L) to some extent dispersed along the direction of diluted water and abundant in both sides of the Zhujiang River estuary. Additional to the dominant species such as P. pungens (mean 2.23×10³cells/L), Synedra spp. (mean 0.83×10³cells/L), Chaetoceros curvisetus (mean 1.10×10³cells/L), Leptocylindrus danicus (mean 1.06×10³cells/L), T. thiebaultii (mean 1.02×10³cells/L), Thalassiosira spp. (mean 0.76×10³cells/L), and T. erythraeum (mean 0.29×10³cells/L) distributed unevenly in some portion of the diluted area in high cell abundance.
3.4 Diversity indices of phytoplankton
In the investigated areas, even they varied with regions, Shannon-Wiener diversity index ( H′) and Pielou’s evenness index ( J) showed an approximately similar trend (Fig.9). In surface, the diversity value ranged from 0.04 to 3.50 (mean 1.85) and the evenness was 0.01 to 0.85 (mean 0.48). The maximum diversity appeared in Station A5 that situated in the mouth of the Zhujiang River estuary whereas the lowest diversity occurred in D19 in the outer sea area.However, high diversity in coastal waters of Zhujiang River estuary might be due to the abundant nutrients brought by the diluted water, which resulted in the preponderance oflow-salinity tolerating species in coastal areas (Ling et al., 2012).
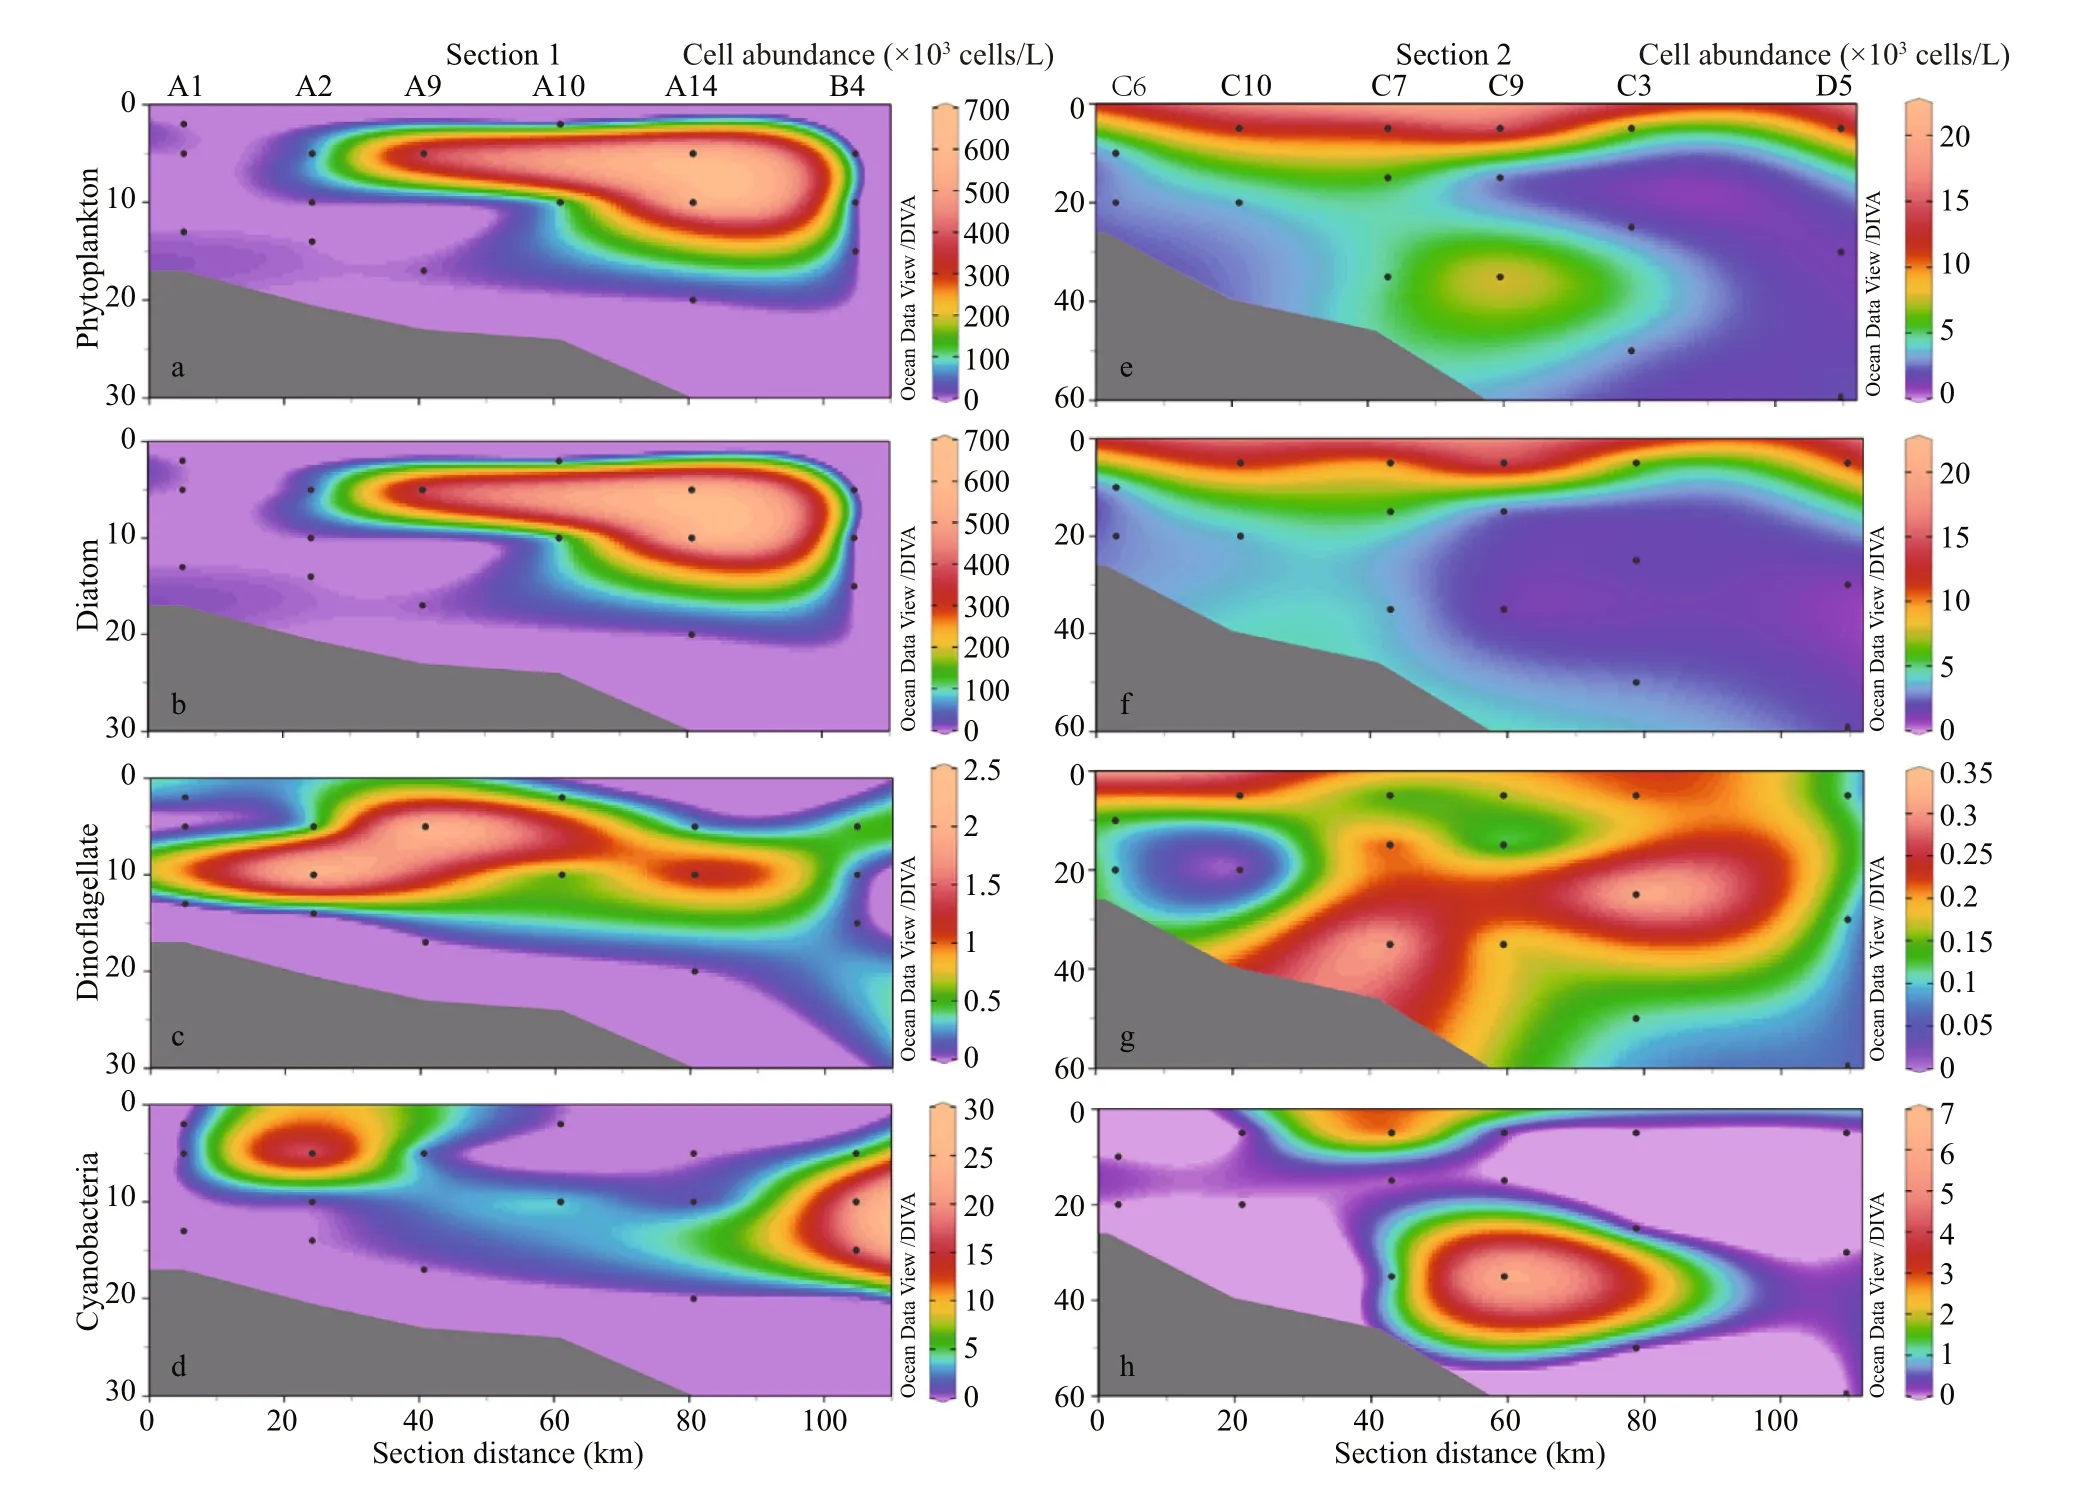
Fig.7 Distribution of biological parameters (×10 3 cells/L) along section 1 (a–d) and 2 (e–h)
3.5 Environmental influence on phytoplankton community structure
Because of the condition of ecological versatility among various groups, the reliance of species on encompassing parameters (temperature, salinity,nitrite, DIN, phosphate, silicate and sampling depth)could be reflected by the situation in the Canonical Correspondence Analysis (CCA) diagram (Fig.10).CCA results show that 34.7% of the total inertia(1.245) in the species data was explained by environmental variables. Eigenvalues of CCA axis 1 and axis 2 were 0.540 and 0.243, respectively, and the species-environment correlation coeffi cients were 0.890 and 0.784. The correlation coeffi cient of environmental axis 1 and axis 2 was 0, indicating that the degree of a linear combination of CCA axis and environmental factors could properly reflect the relationship between these first 36 species and environmental factors. Based on the intersecting correlation of environmental variables with the CCA axis, salinity, phosphate, and depth were strongly related to axis 1 whereas silicate, nitrite, DIN ( P <0.05)and temperature to axis 2; these environmental parameters assumed significant jobs on the spatial pattern of phytoplankton.
To clearly depict the impact of environmental factors on the phytoplankton community structure,the phytoplankton community could be classified into several groups consisting of a diverse assemblage of phytoplankton. Species that favored high-salinity gathered in a group showed a negative relationship with most of the nutrients. Another group included species that were negatively correlated to the temperature and salinity, the greater part of them were broadly distributed in the whole study area. The third group was made out of species that were positively correlated with nutrients ( P <0.05), distributed mostly in the coastal waters and influenced by the diluted water.
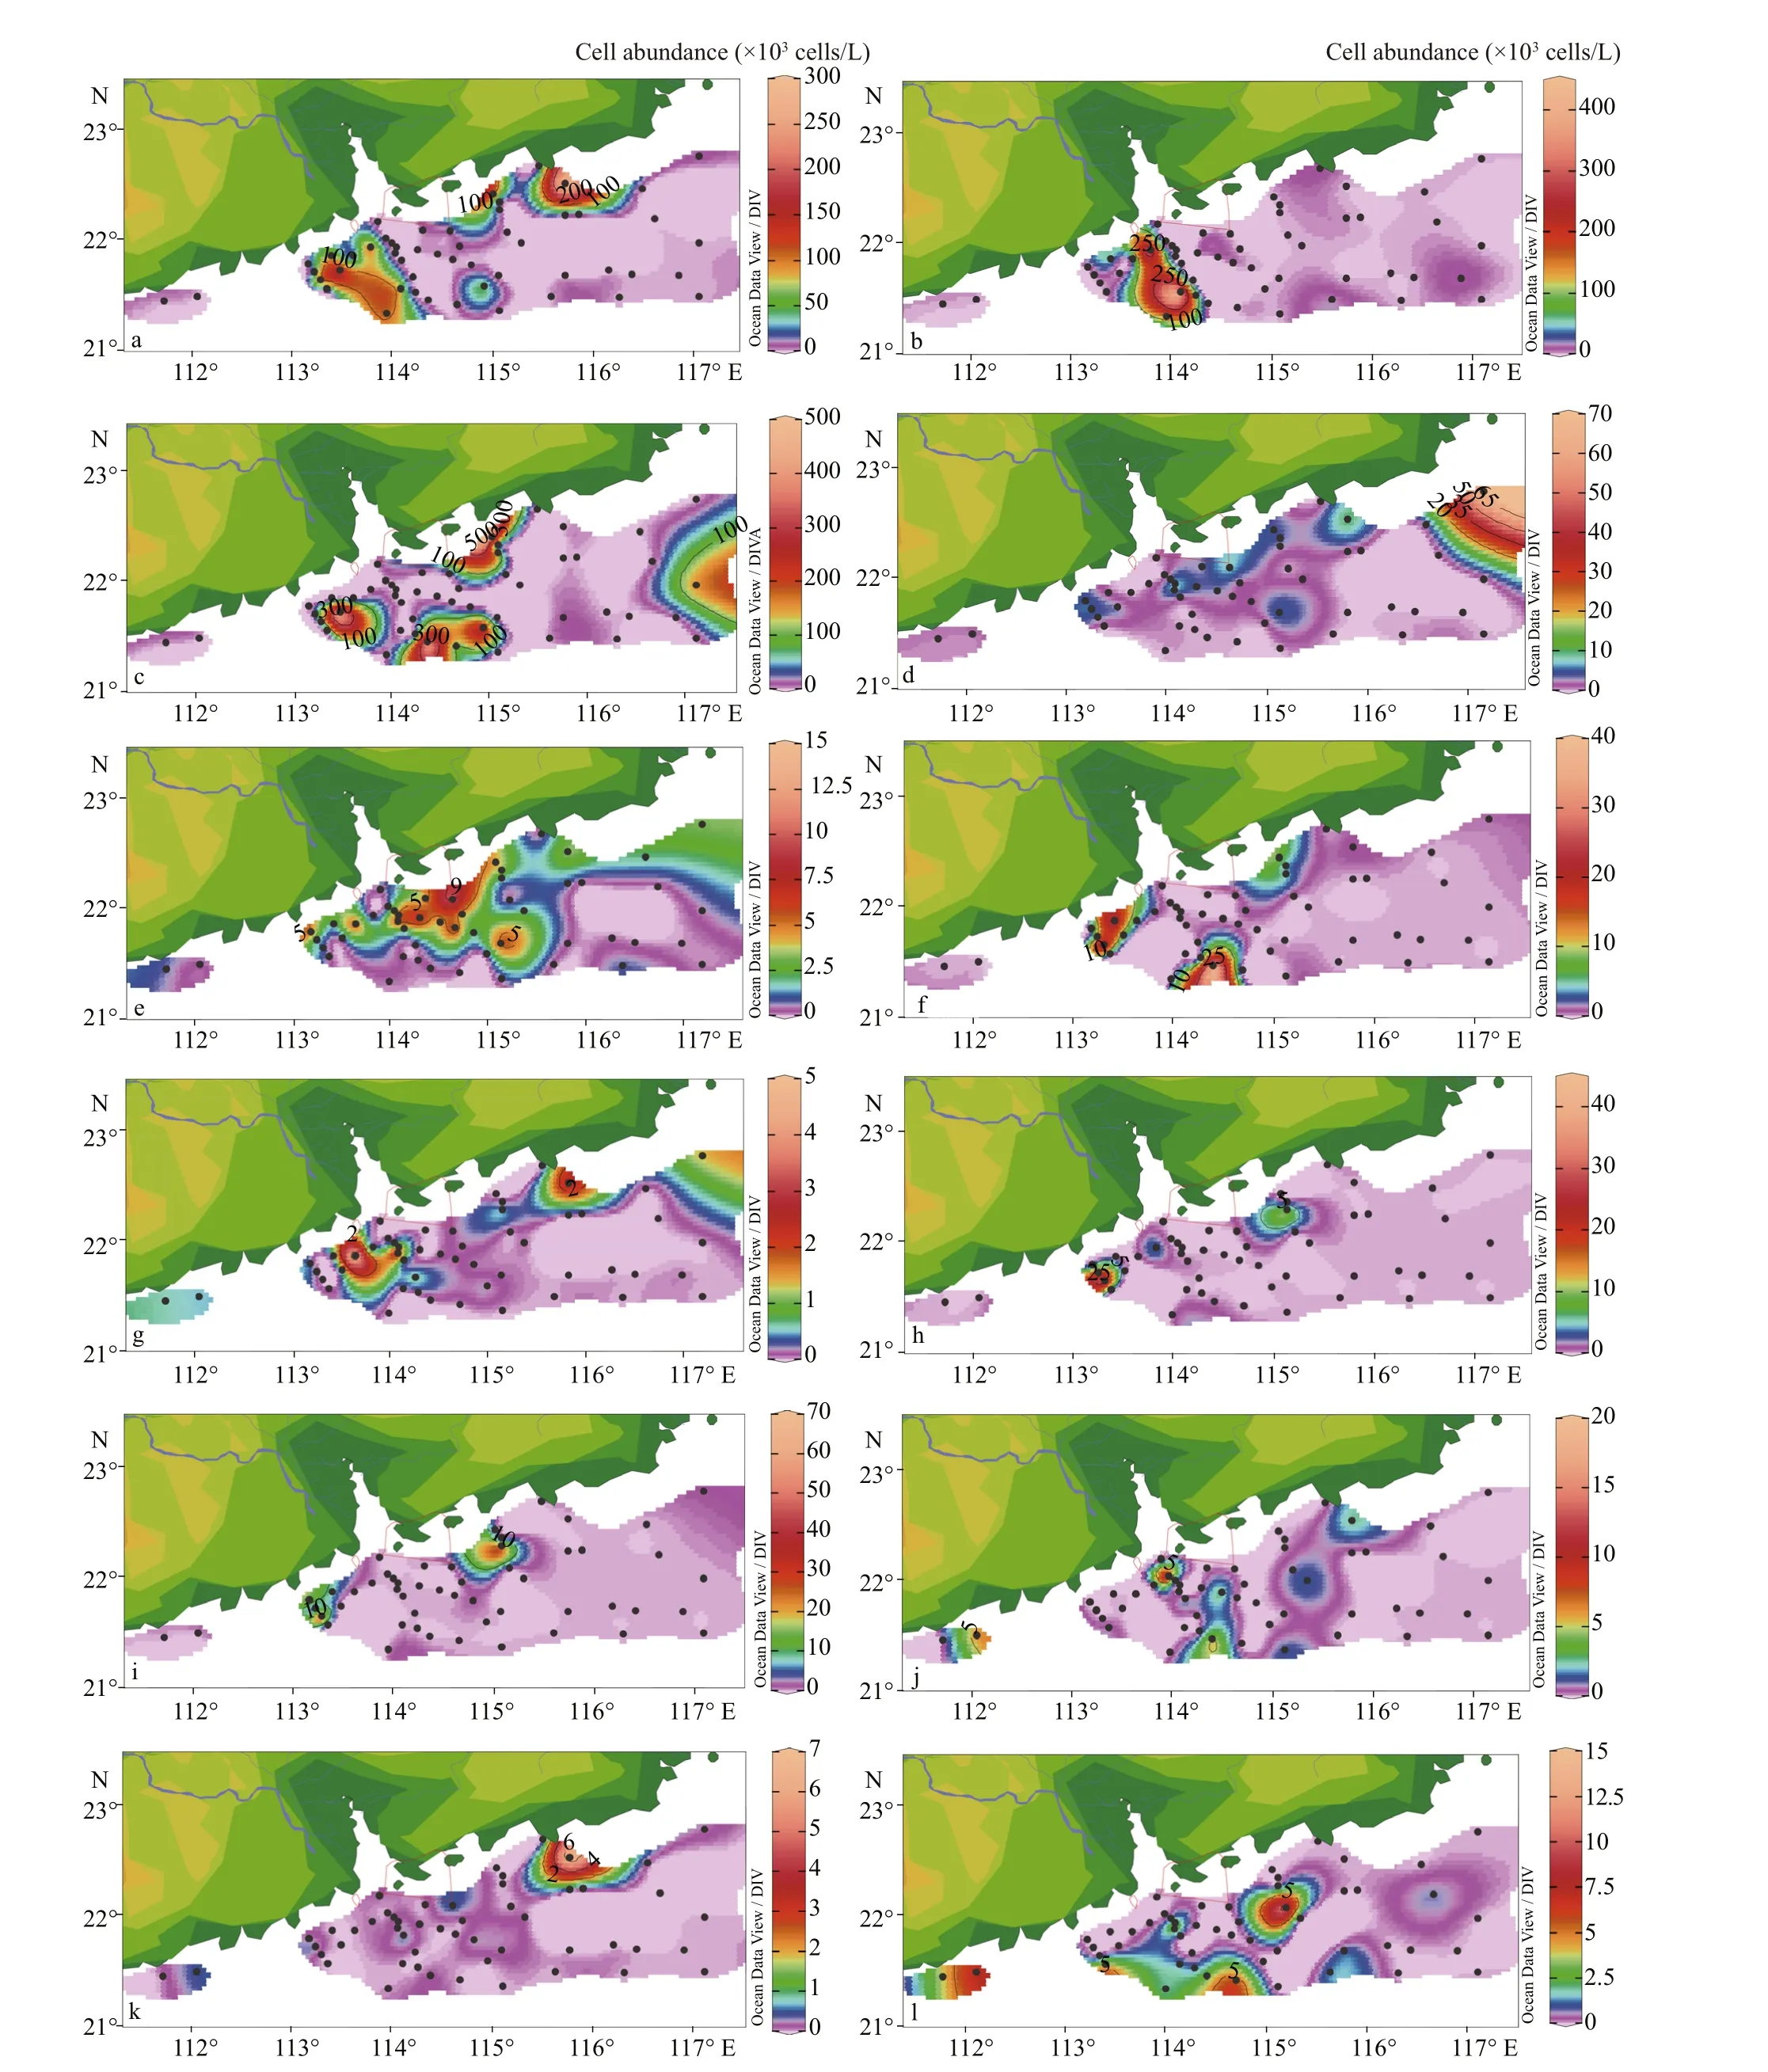
Fig.8 Horizontal distribution of dominant species in the surface water (×10 3 cells/L)

Fig.9 Horizontal distribution of Shannon-Wiener index and Pielou’s evenness index in the surface water
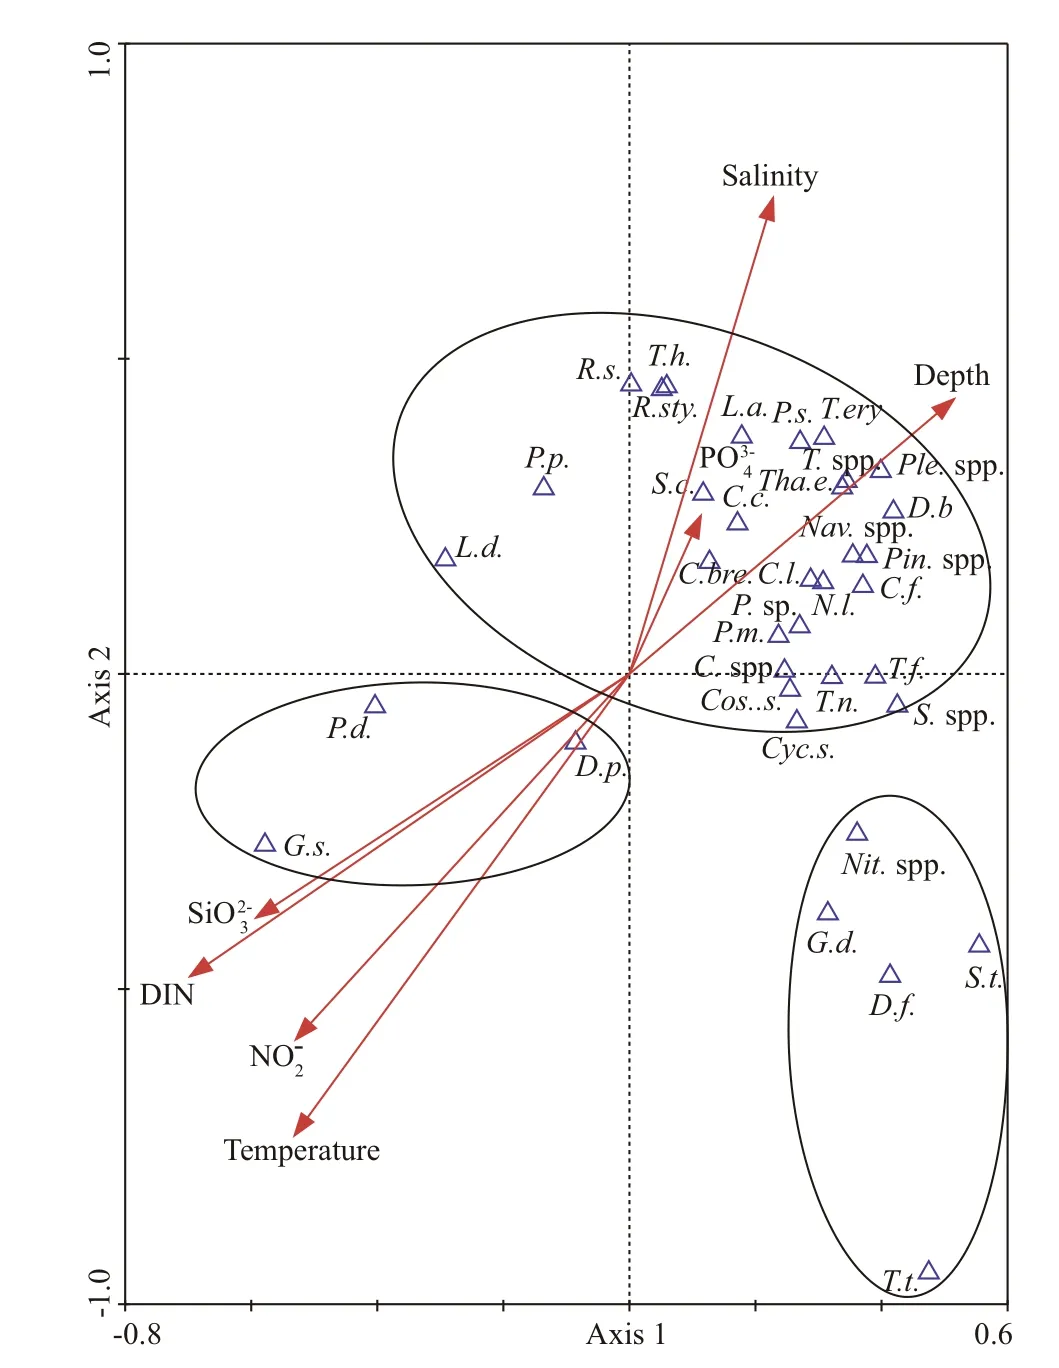
Fig.10 CCA scatter bi-plot for phytoplankton dominant species and environmental factors
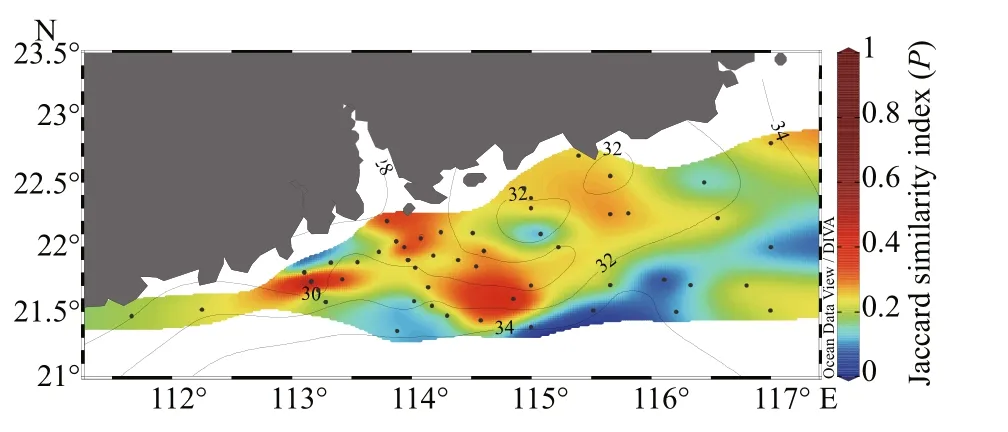
Fig.11 Surface distribution of the Jaccard similarity index( P)
In addition, the Jaccard similarity index (varied from 0.05 to 0.44) was used to describe species similarity among the stations (Fig.11). Station B2 was assessed to compare diff erent species composition among stations as it was composed mostly by the common species in the survey area. Clearly, high similarity was recorded in waters with coastal waters whereas the low estimations of the Jaccard similarity index were recorded in mixed waters.
Further, based on the Bray-Curtis similarity of species abundance at the surface layer, three major clusters were identified at 40% similarity level(Fig.12). Cluster I accumulated the mixed water stations where the salinity was higher and located at the off shore area. Cluster II showed the grouping of coastal waters stations where phytoplankton assemblages were influenced by the low salinity of diluted waters. However, the cluster III grouped both coastal waters and mixed waters stations, which revealed that the phytoplankton assemblages in some stations of coastal waters were not influenced by diluted waters. The results are analogous to the distribution of Jaccard similarity index in the surface area.
3.6 Diel cycle
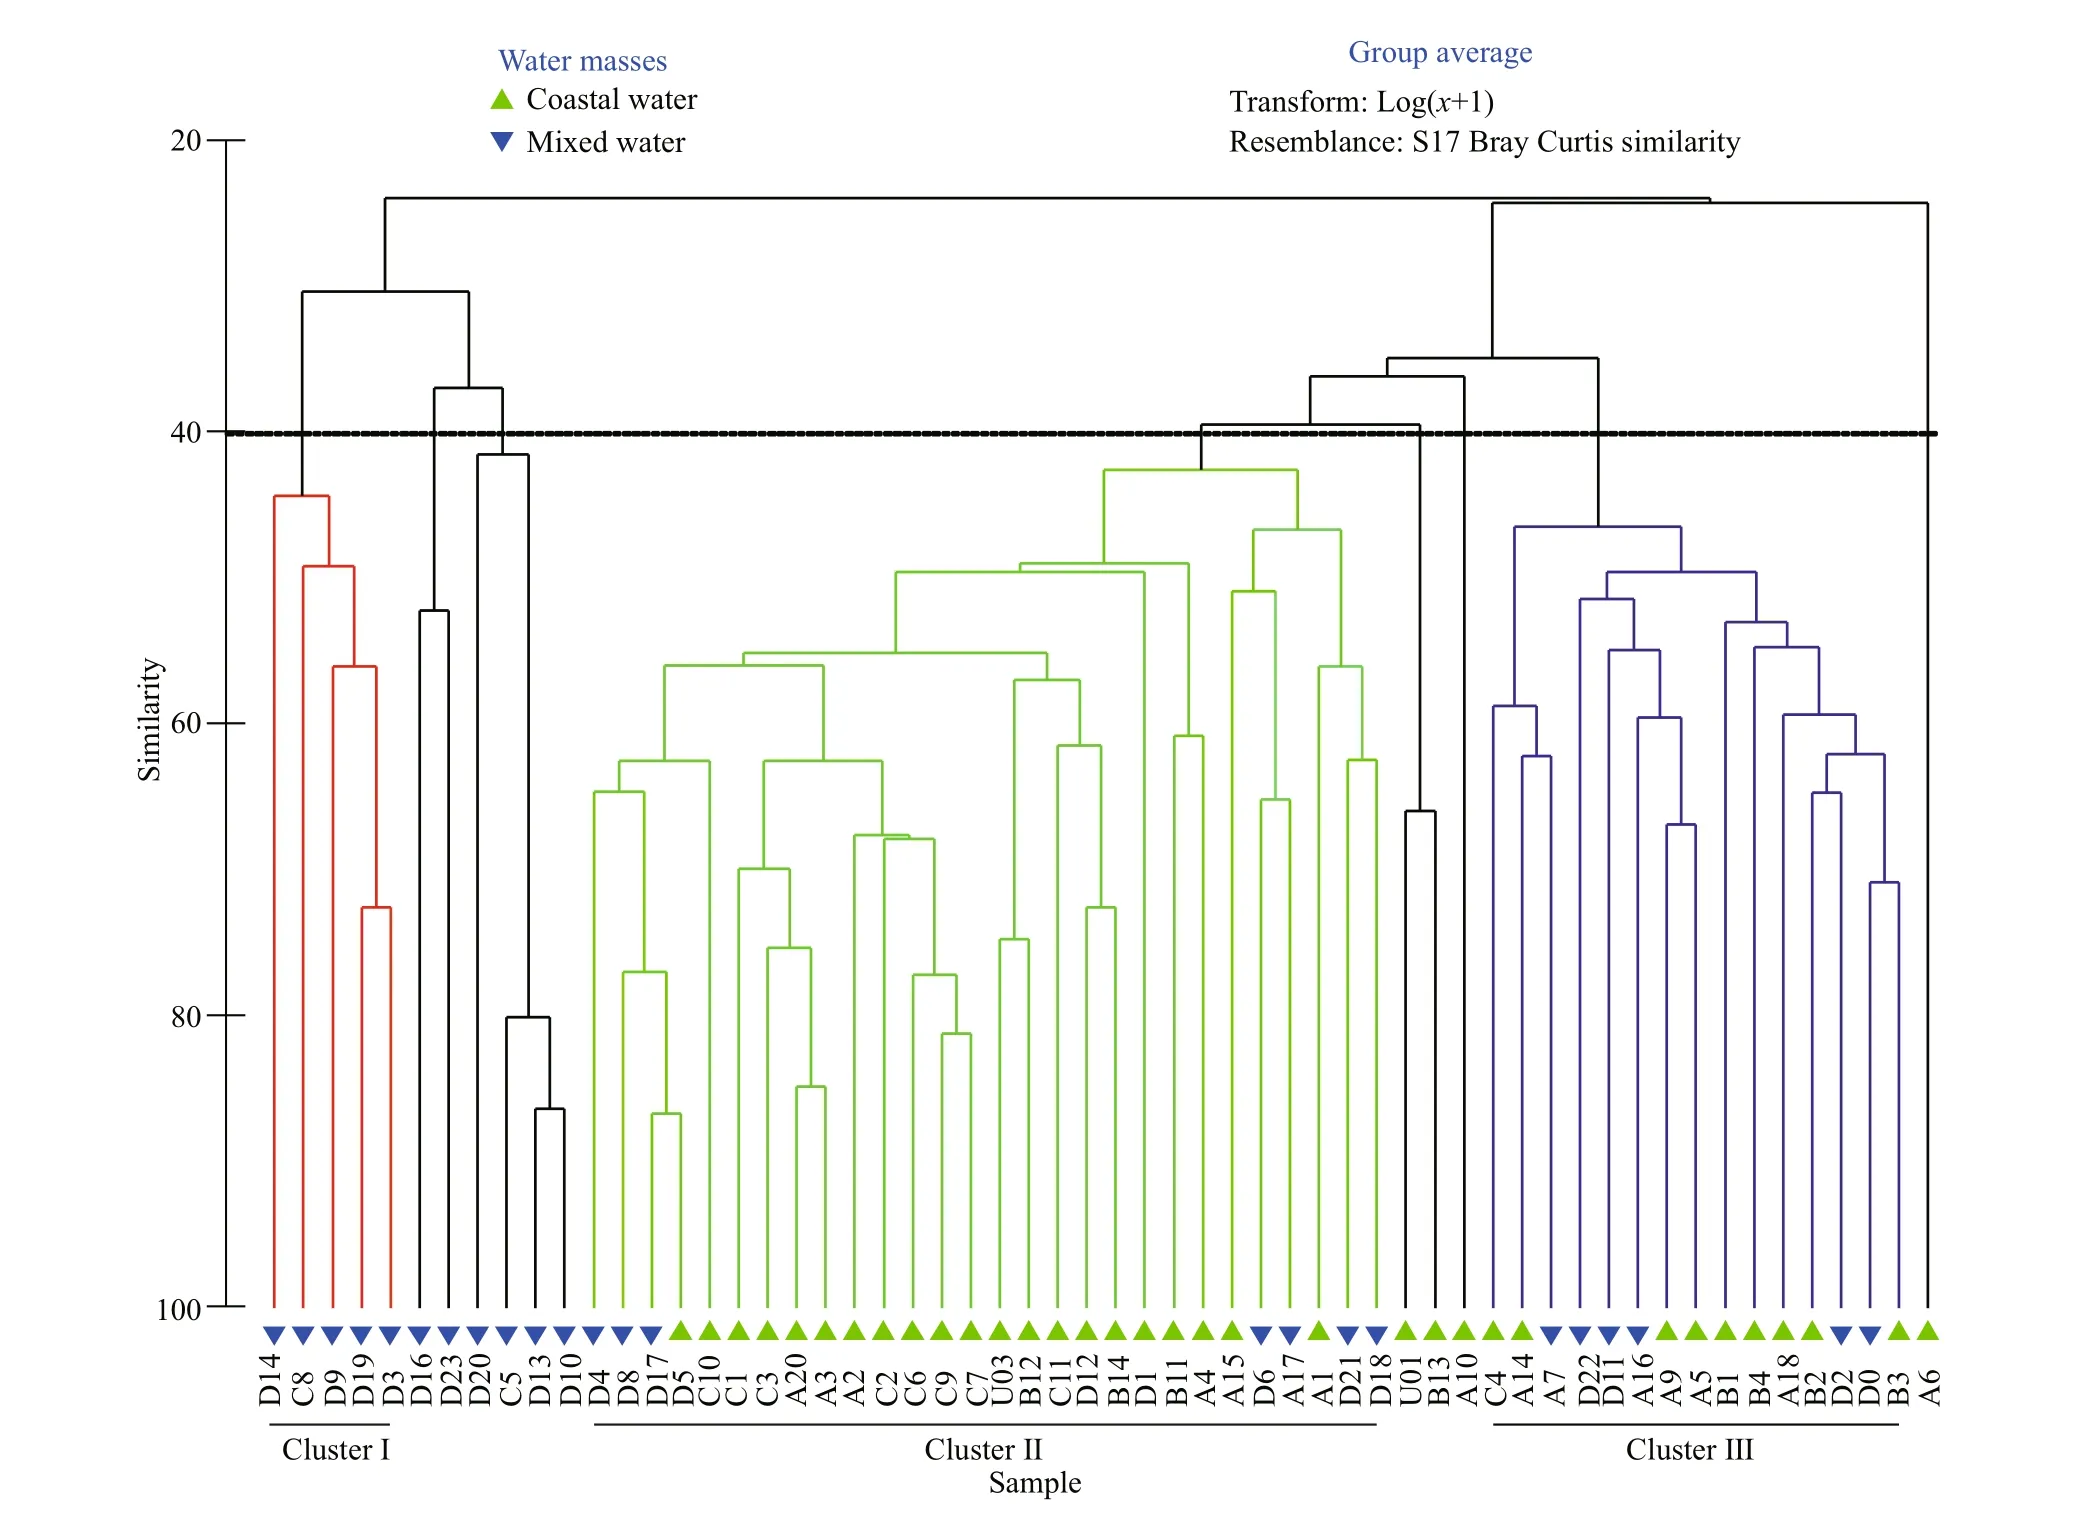
Fig.12 Bray-Curtis similarity-based cluster analysis of species assemblages in the surface layer of the study area
In our study, Station AA was set up for time-series sampling, in which six certain sampling time representing the diel cycles of the phytoplankton.Samples were collected from three diff erent depths in this station. Apart from the sample collection,preservation and some other unexpected reasons led to the loss of some samples. The maximum cell abundance (121.84×10³cells/L) observed from 25-m depth at 02꞉00 am in this station (Fig.13). The cell abundance in this time diff ered greatly from the other times particularly contributed from smaller sized Pseudo-nitzschia spp. (47.20×10³cells/L) and T.nitzschioides (25.76×10³cells/L). However, their abundance was comparatively lower in other times than 02꞉00 am. Along with the diatom, cyanobacteria and chrysophyta shared a small proportion leading to maximum abundance on that time. Moreover,dinoflagellates also emerged with peak cell abundance at 02꞉00 am comprising 1.4×10³cells/L at 3-m depth.
4 DISCUSSION
4.1 Environmental parameters on phytoplankton assemblages
The hydrological characteristics of the sea area close to the Zhujiang River estuary are intricate and dramatic. River discharges among seasons were proved to be an essential factor controlling the seasonal variation of regional environmental and ecological distributions in the Zhujiang River estuary(Li et al., 2006; Qiu et al., 2010). The temperature and salinity ( T- S) scatter diagram manifests that mixed water characterized by the high salinity and relatively lower temperature whereas the diluted water dominated the coastal water and its salinity regime.Chen et al. (2018) observed the extension characteristics of the Zhujiang River diluted waters from July to August in 2015 and reported that the intrusion of diluted waters decreased the salinity(lower than 32) around the Zhujiang River estuary.Moreover, they reported that the diluted water in summer extended from the coast to the east and west of the river mouth. As the composition of the phytoplankton assemblages has a strong association with the water masses (Liu et al., 2004), the diluted waters might positively influence the phytoplankton abundance as it was also higher in both sides of the river mouth rather than other areas. The horizontal distribution of phytoplankton, Jaccard similarity index and the cluster analysis revealed that the influence of diluted waters increased phytoplankton abundance in coastal waters but not in the river mouth.Because, the mainstream of the estuary transported most of the nutrients from the inner part to the outer very rapidly and gave little time for phytoplankton to utilize the nutrients in a large volume and grow, which led to a relatively lower abundance at the mouth of the estuary (Qiu et al., 2010). In addition, Tan et al. (2004)found that zooplankton consumed up to 104% of the daily phytoplankton in the flushing dilute zone in summer.
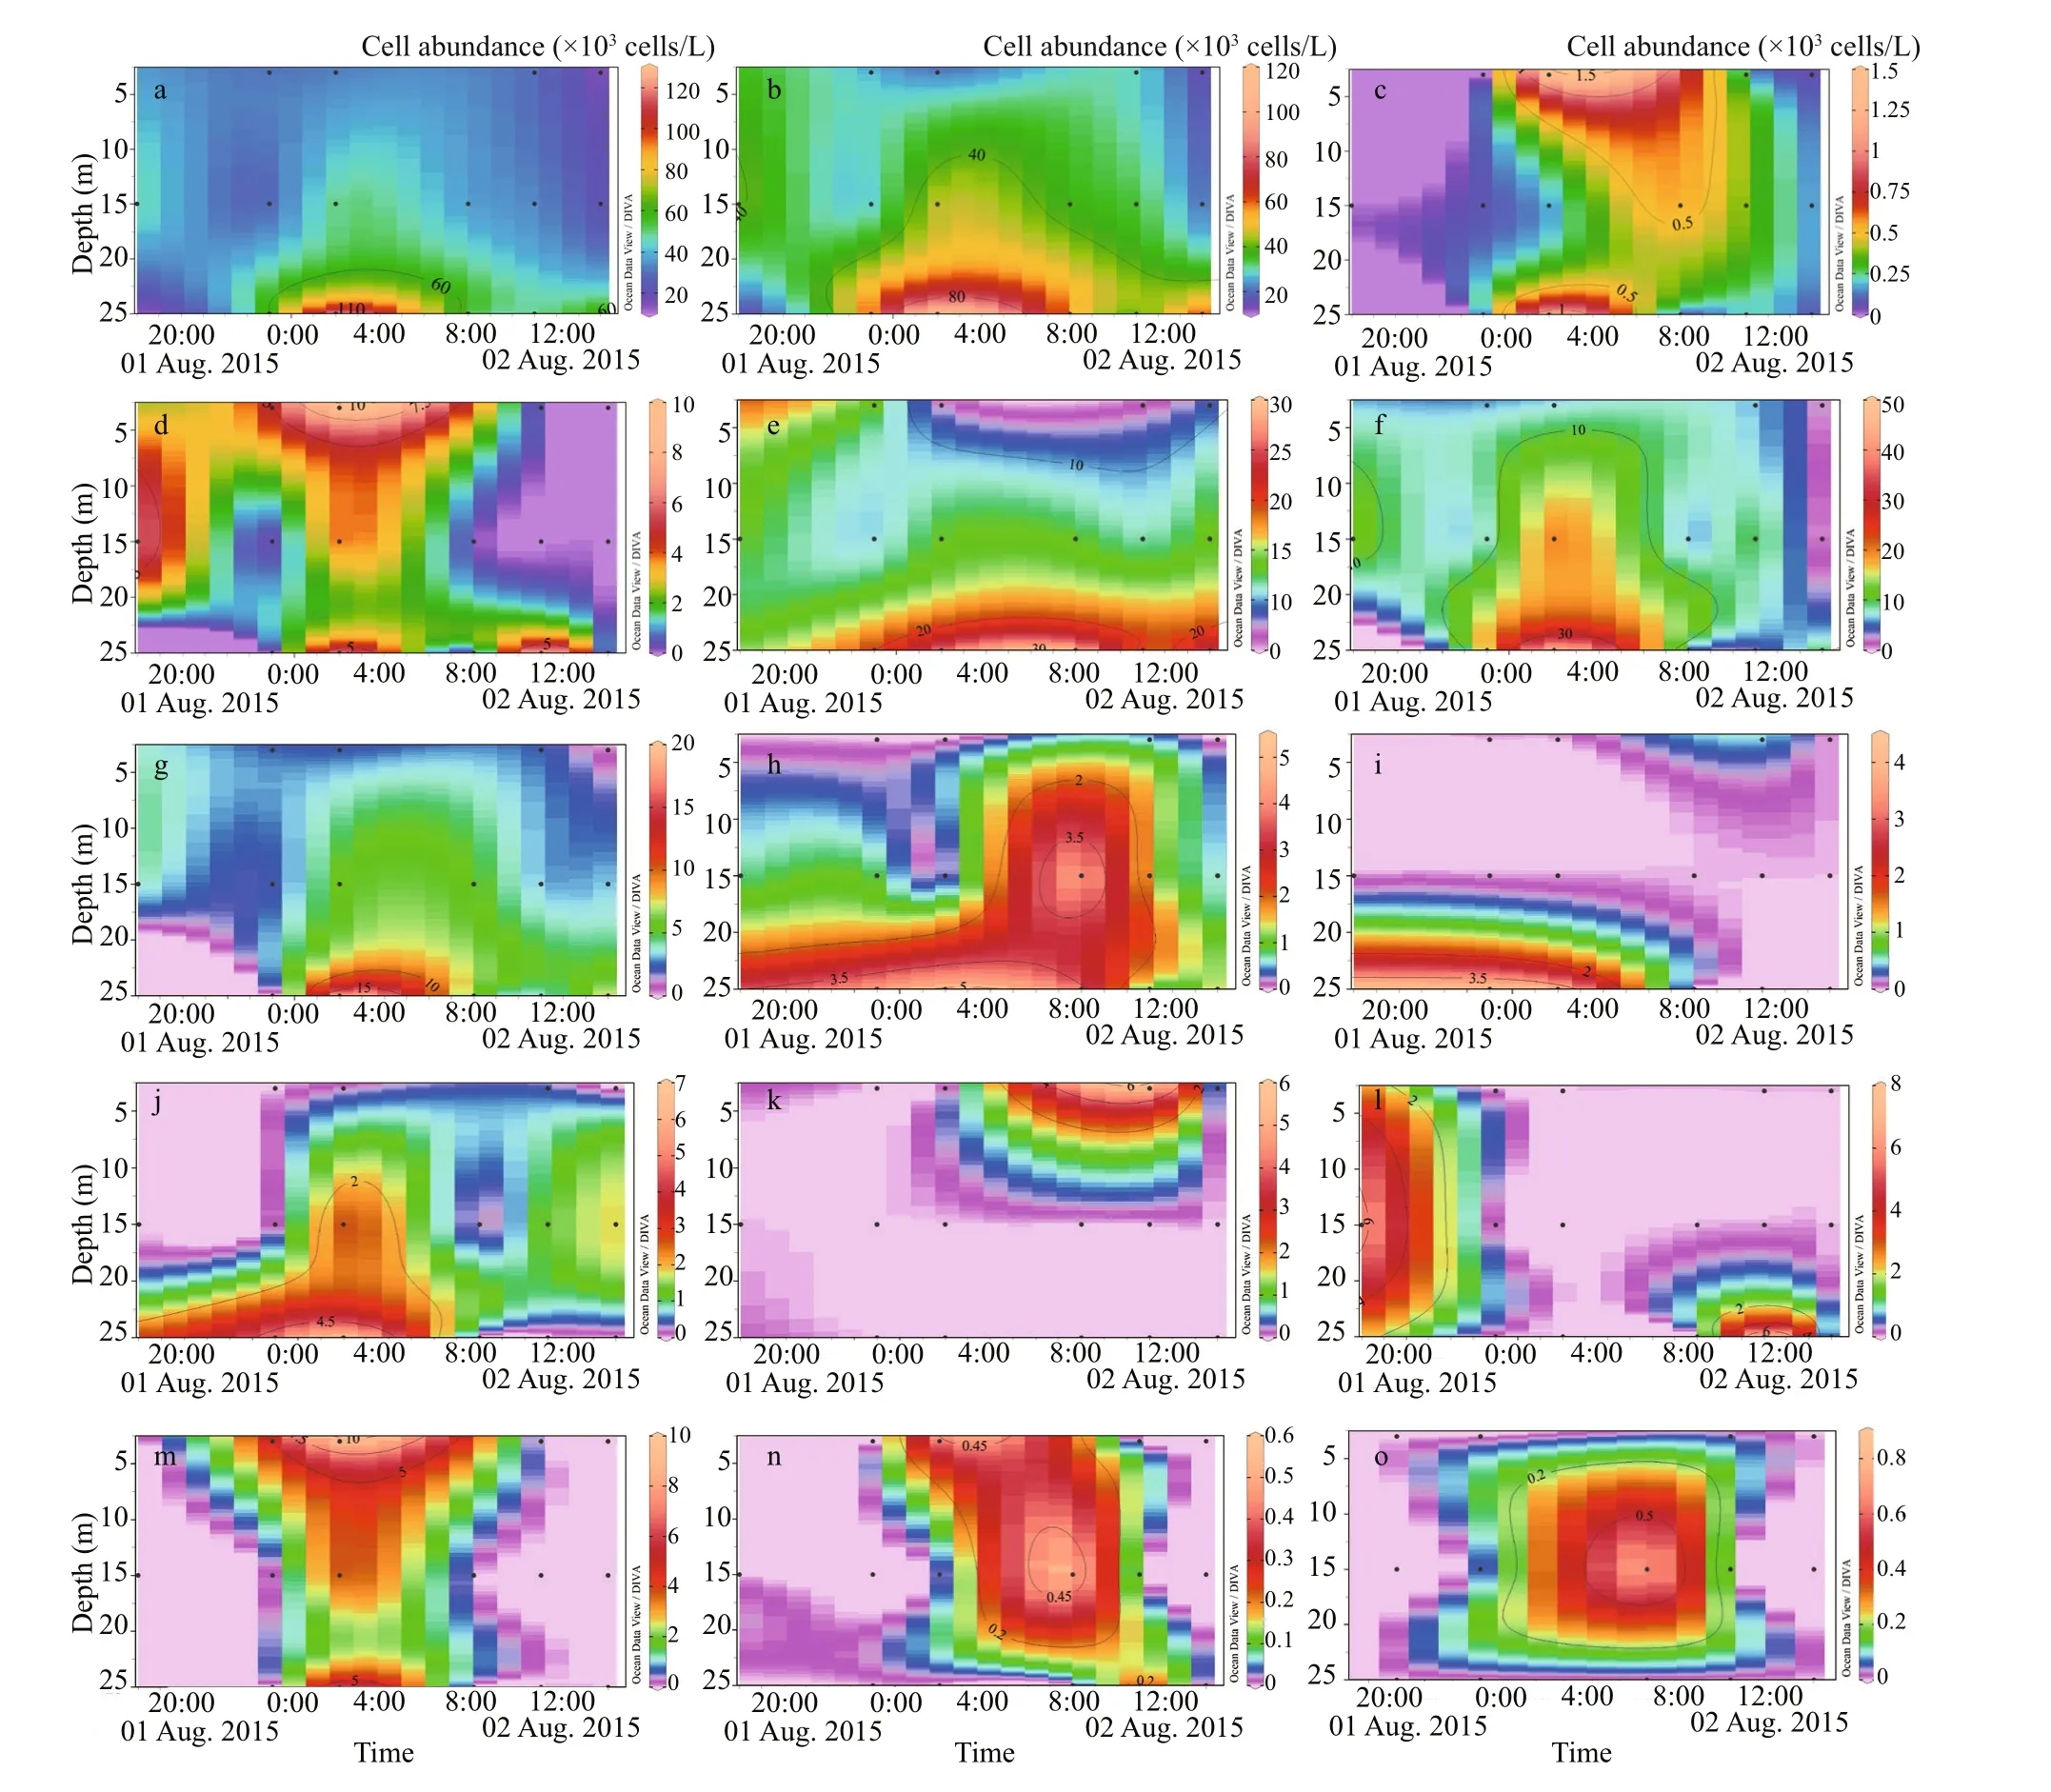
Fig.13 Diel cycle of phytoplankton (×10 3 cells/L)
Wang et al. (2009) additionally indicated that temperature and salinity could influence phytoplankton distribution. In addition, it was reported that salinity could delineate the distribution of phytoplankton species in the Changjiang (Yangtze) River estuary(Zhao et al., 2013). Likewise, the Jaccard similarity index plot and the cluster analysis (Figs.11 & 12) also indicated that taxa in the survey area did not form a homogenous community rather comprising species of diff erent population optima and distributional ranges.Stations with low-salinity coastal waters contained mainly diatoms including Rhizosolenia spp. and Chaetoceros spp., which showed a similar outcome with Philippart et al. (2000), though Pseudo- nitzschia spp. (Ruggiero et al., 2015) and Thalassionema nitzschioides (McIntire and Overton, 1971) were most frequently distributed in the coastal area.Prorocentrum leniculatum and Ceratium inflexum had a high occurrence in survey areas prevailing high salinity.
Lower diversity ( H′) and evenness ( J) appeared in the surface water in the southwest of Zhujiang River estuary, relating to the areas of high phytoplankton cell abundance, affi rming that the low diversity index often indicates a vigorous growth of the phytoplankton community (Sun et al., 2007). According to Cai et al.(2004), the Zhujiang River brings nutrients streaming to the waters off Guangdong coast, which in combination with the coastal rivers caused a lowsalinity and high-nutrient surface that permits the growth of diatoms (Lecher et al., 2017). It was evident from previous studies that nutrient-rich water enhanced phytoplankton abundance (Yuan and Deng,1998; Le and Ning, 2006). However, diatoms propagated actively in the survey area rather than any other groups and comprised around 96% of the total abundance. This is perhaps that the silicate cell walls of diatoms shield them from strong water turbulence(Hamm et al., 2003). In the case of dinoflagellates,their growth was aff ected by the water turbulence because they are more vulnerable to strong turbulence(Thomas and Gibson, 1990). In addition, the river discharge also contained a high silicate concentration(Cai et al., 2004), which could be a reason for a large number of diatoms among phytoplankton. However,the vertical distribution of phytoplankton exhibited that the abundance of phytoplankton declined vertically. There were explanations in previous studies(Takahashi et al., 1986; Du et al., 2013; De Queiroz et al., 2015; Noman et al., 2019) that water depth might have an influence on the abundance of phytoplankton distribution.
4.2 Comparison of historical data
For species composition of nSCS, eurythermal and widely distributed warm-water species were dominant in number, manifesting apparent tropic and subtropics features on taxa diversity (Ma et al., 2016). The phytoplankton composition was mainly characterized by the abundance of diatoms, which is in accordance with Ke et al. (2011), Xue et al. (2016), and Ma et al.(2016). Some of the dominant species of our study such as G. striata, Chaetoceros spp. and Thalassiosira spp. were also recorded in autumn (Ma et al., 2016)and winter (Sun et al., 2007). It has been reported that T. thiebaultii, P. delicatissima, P. pungens, and T. nitzschioides. Pseudo-nitzschia were common dominant species of the South China Sea (Xue et al.,2016), whereas Skeletonema costatum and Fragilariopsis spp. were identified in summer (Le and Ning, 2006) and winter (Sun et al., 2007)respectively. In addition, Song et al. (2011) verified the appearance of high phytoplankton biomass in the estuarine plume for a long-time dimension, which also certificated that Pseudo-nitzschia delicatissima dominated the plume region.
Comparing the survey with historical data of recent studies (Table 2), the present study had higher average cell abundance and relatively higher diversity. Since sampling stations were diff erent from those of previous studies, most of them were vulnerably aff ected by the discharging water and anthropogenic activities, just as various investigation strategies and sampling layers that led to the disparities (Lin, 2013). At the same time, limited by the high variability of the plume, the exact part of the maximum phytoplankton biomass in the Zhujiang River estuary was often hard to be determined,especially in summer (Yin et al., 2001; Huang et al.,2003). Therefore, it needs more comprehensive data to better understand the changes in the phytoplankton assemblages of this area.
4.3 Relationship between phytoplankton species composition and environment conditions
The nutrients in the seawater are indispensable for the growth and reproduction of phytoplankton, hence the nutrient concentrations are the decisive factor for the growth of phytoplankton (Ma and Sun, 2014).Though the environmental factors of some samples were lower than the detection limit and lack of relevant data, the CCA analysis can preliminarily elucidate the predominant factors of phytoplankton in the nSCS in summer. CCA biplot (Fig.10)demonstrating that despite P. delicatissima, G. striata,and D. pumila had a positive correlation with nutrients, others were positively correlated with salinity, which revealed that the diluted waters also eff ected the phytoplankton species composition. Sin and Wetzel (2002) pointed out that the growth of phytoplankton in the estuary depends on appropriate nutrient input under condition that light is unlimited.In addition, as one of the essential elements for the growth of phytoplankton, most of the dominant species were highly dependent on phosphate and it might be a limiting nutrient for the most of the speciesin this area. According to Zhang et al. (1999), the content of phosphorus near the estuary is not significant, partly due to the instability of freshwater intrusion, which could give a simple illustration why the dominants highly relied upon phosphate for growth. Cai et al. (2004) detailed that the Zhujiang River had high DIN input and generally low phosphate input, bringing about an unusually high N꞉P ratio.Therefore, the phytoplankton of nSCS in summer was restricted by the joint eff ects of nitrogen and phosphorus (Xu, 2007) as the CCA of our study showed that most of the species had positive correlation with phosphate while strong negative relationship with DIN ( P <0.05).
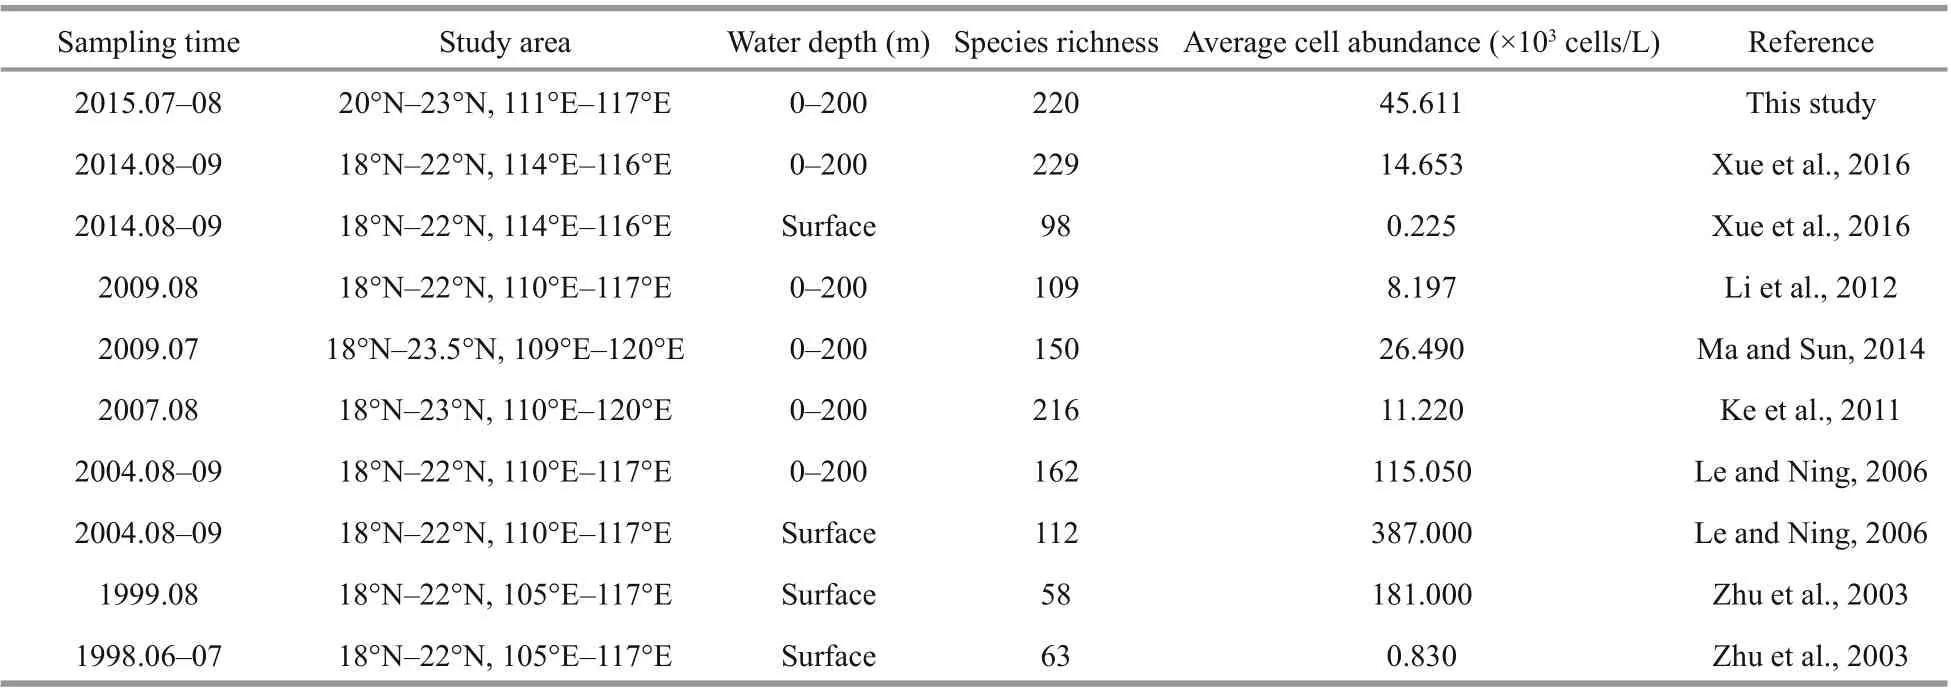
Table 2 Comparison of historical data of phytoplankton on cell abundance in the northern South China Sea
Sunlight played an important role in the diel vertical distributions of phytoplankton. In our study,the maximum cell abundance of phytoplankton appeared at 02꞉00 am in all layers, which concurred with Xue et al. (2016). Among the species, Pseudonitzschia spp. gave off an impression of being the maximum at 02꞉00 am (25 m), while Chaetoceros spp. showed the maximum at 11꞉00 am (3 m). Since Pseudo-nitzschia spp. belongs to the benthic diatoms,the probable explanation is that they showed the maximum abundance at that time because of the dispersion of algal cells by the currents at night after daytime growth (Tang and Chen, 2006). Consequently,it could explain the distinctive diel cycles because of various species possessed diff erent photosynthetic pigments; for example, the light-protecting pigment and the antenna pigment had diff erent responses to the light (Wang et al., 2013). It was reported that dinoflagellates, in particular, could perform diurnal vertical migrations enabling them to proficiently utilize nutrients at depth during the night and solar radiation close to the surface in daytime (Cullen and Macintyre, 1998), which might aid them to be maximum at that time.
5 CONCLUSION
Phytoplankton assemblages of nSCS in summer was mainly composed of Bacillariophyta and Pyrrophyta. The average cell abundance of phytoplankton was 45.61×10³cells/L bearing the maximum off the Hong Kong Island, in which Bacillariophyta cells abundance contained 96.14% of the absolute abundance. The surface layer characterized by water with low salinity and high nutrients, sustaining species of eurythermal and low salinity propagated quickly.
Due to high flushing of the mainstream, high cell abundances appeared on the east and west side of the Zhujiang River mouth, where eurythermal, widelydistributed and warm-water species including P. delicatissima, T. nitzschioides, P. pungens, and G. striata were prevailing in number. Maximum cell abundance phytoplankton concentrated at the surface to 25-m depth where the salinity was low because of diluted waters. CCA results reveal that salinity and inorganic nutrients especially DIN and phosphate were the key factors controlling the phytoplankton species composition. Distinctive light penetration attributes influenced the distributions of phytoplankton in the diel cycle, and the cell abundance reached the crest at 02꞉00 am. However, it is necessary to assess long-term quantitative analysis to further understand the variations of phytoplankton community structure and its response to environmental changes in the South China Sea.
6 DATA AVAILABILITY STATEMENT
The data of nutrients and CTD in this study are available from Data Mining Research Center, Xiamen University, but restrictions apply to the availability of these data, which were used under license for the current study, therefore not publicly available. Data of cell abundance generated and analyzed during the current study are available from the corresponding author on reasonable request.
7 ACKNOWLEDGMENT
Hongbin LIU wish to acknowledge the support of Hong Kong Research Grants Council (Nos.T21/602/16, 16128416, and 16101318). We would also like to show our gratitude to Professor Minhan DAI of Xiamen University for sharing the nutrients data, and also Professor Jianyu HU of Xiamen University for sharing the CTD data.
 Journal of Oceanology and Limnology2021年2期
- Journal of Oceanology and Limnology的其它文章
- Predicting sediment flux from continental shelfislands,southeastern China*
- Laboratory simulation of dissolved oxygen reduction and ammonia nitrogen generation in the decay stage of harmful algae bloom*
- Development of high-resolution chloroplast markers for intraspecific phylogeographic studies of Phaeocystis globosa*
- Effects ofiron and humic acid on competition between Microcystis aeruginosa and Scenedesmus obliquus revealed by HPLC analysis of pigments*
- Exploring the sublethal genotoxic effects of class II organophosphorus insecticide quinalphos on freshwater fish Cyprinus carpio
- An illustrated checklist of macrofaunal molluscs from softsediments of the Abrolhos Parcel (northeastern, Brazil) with 15 new records*
