Experimental and computational investigation of hybrid formation flight for aerodynamic gain at transonic speed
Yang TAO, Neng XIONG, Xiaobing WANG, Jun LIN, Zhiyong LIU, Shang MA,Junqiang WU
High Speed Aerodynamic Institute, China Aerodynamics Research and Development Center, Mianyang 621000, China
KEYWORDS CFD;Formation flight;Surfing aircraft vortices;Wake vortex;Wind tunnel test
Abstract The influence of the wing-tip vortex of leading aircraft on energy savings, quantified by formation aerodynamic force fraction of the following aircraft, is studied at transonic speed for a matrix of leading aircraft’s vortex locations. The research model adopts the hybrid formation of medium and large aircraft. The leading aircraft is scaled by 2.1%, and the following aircraft is scaled by 1.4%. An aerodynamic benefit ‘‘map” is developed to determine the optimum location of the following aircraft relative to the leading aircraft wake and to compare with experimental results,thus validating the use of CFD for the formation flight at cruising speed.The response surface model of aerodynamic gain effect relative to formation parameters is established via numerical calculation and wind tunnel test. The optimal formation parameters and the setting criteria of the study model are optimized. Results show that the wing-tip vortex of large aircraft significantly increases lift and reduces drag on the medium-sized aircraft following it. Reduced drag slightly increases with the flow direction position.With the increase of flow direction distance,the peak area moves from 15%of wing-tip overlap to 20%of overlap.In addition,the maximum drag decreases about 16%,and the maximum lift increases about 12%.The lift drag ratio of the optimal position is increased by 27%,which is twice as large as that of the same scale ratio aircraft formation.Results show that the increase of lift is mainly caused by the increase of suction peak and suction range.
1. Introduction
Formation flight was first observed in the migrations of birds.Flying in formation results in aerodynamic advantage and thus energy efficiency.1-5Inspired by this phenomenon,a concept of Surfing Aircraft Vortices For Energy (SAVE) is proposed.6The aircraft flying in the wake of another aircraft at proper position can be benefited by upwash. Thus, aerodynamic performance is improved, and enhanced range or payload can be achieved. More interestingly, this scheme does not require any modification of aircraft. Hence, numerous investigations, including analytic analysis,7-10numerical simulations,11wind tunnel tests12and flight tests9,13-15are conducted, and many important findings are reported.
Formation flight is usually categorized into close- and extended-formation flights based on the longitudinal distance of the two aircrafts in formation.16The former has a spacing of 1-10 span, and the latter has a spacing of more than 10 span.This classification criterion closely relates to the features of the wake vortices of aircrafts.Many studies about wake vortices are conducted. Benkenida et al.17used the patched grid and adaptive mesh refinement technique to simulate the inviscid flow around a generic aircraft model. Phuriwat et al.18combined Reynolds-Averaged Navier-Stokes (RANS) with Particle-based Vorticity Transport Method (PVTM) to validate wing performance and wake, and the results agreed well with experimental data. The flow visualization of interactions of wingtip vortices conducted by Inasawa et al.19showed the evolution of vortices when two wings overlapped with each other by 5%. They thought that the reduction of circulation of the wake vortex of the trailing wing caused by the wake of the leading wing is the reason for the increment of lift-todrag ratio of the trailing wing.
The aerodynamic advantages of formation flight attract great attention. Experimental results derived from Bangash et al.20confirmed aerodynamic advantage and indicated that the spatial offset and the angle of attack of the leading wing significantly impacted the trailing wing.Formation parameters were optimized to pursue the largest aerodynamic benefit.Chichka et al.21focused on drag reduction in formation flight.Kless et al.22considered the influence of roll trim.Various controllers tracking correct positions were designed. Chao et al.23validated their wake vortex detection system by using the UAV platform. Shan and Liu24considered motion synchronization.Okolo et al.25simulated extended duration, in which fuel consumption could lead to significant weight reduction. Optimal routes for commercial formation flight were performed by Kent et al.26Flanzer et al.27analyzed aircraft formations and route networks for the cargo aircraft fleet of C-17.
Most of these investigations are based on low fidelity simulations,such as discrete vortex lattice method.Besides,inviscid aerodynamic forces and moments and incompressibility are often considered.Many wind tunnel studies of formation flight are mainly carried out in the range of low speed incompressible flow, whereas limited research are conducted on transonic wind tunnel test under cruise speed condition. Although Ning et al.28studied formation flight at transonic speeds, no wind tunnel test validated the predictions. To deeply understand the evolution of vortices and accurately predict aerodynamic performance of formation flight at cruising speed, numerical simulations considering viscid aerodynamic forces and transonic wind tunnel experiments are conducted in the current work.Large transport aircraft and medium-sized aircraft models are used to carry out the transonic test of two aircraft formation,and the aerodynamic forces/moments of the following aircraft under different formations are measured by using the wind tunnel test. Based on the experimental results, the response surface model of aerodynamic forces/moments relative to formation position parameters is established, and the optimal formation parameters are obtained. CFD method is used to simulate the same state of the test. The aerodynamic increment of the following aircraft is in good agreement with the test results.The CFD results are used to evaluate the influence of the space wake interference and the leading aircraft’s wing-tip vortex on the pressure distribution of the following aircraft under different formation parameters. The influence law of wake vortex is analyzed as well.
2. Experimental setup and numerical method
The aircraft wake involved in formation flight is a complex flow structure.The interaction among the motion,delay,and instability of the aircraft wake and other aircraft is a complex turbulent flow phenomenon in which vortices and free inflow and moving objects interact with each other.The research is carried out by combining numerical simulation with wind tunnel test.
2.1. Experimental setup
2.1.1. Wind tunnel and support system
Tests were conducted in FL-26 wind tunnel, which is a semireflux and temporary jet transonic wind tunnel with a cross section of 2.4 m×2.4 m. The Mach number ranged from 0.3 to 1.2.In the half-model test section,60°oblique orifice panels with open-close ratio of 10% were on up and down,and solid walls were on both sides.The stream wise length was as long as 7 m,which can realize the formation simulation of two aircraft with large flow distance.
Transporter model was used in the formation tests. The leading aircraft model scale was 2.1%, and the wingspan was about 735 mm. The following aircraft model scale was 1.4%,and the wingspan was about 490 mm.During the test,the support device of the leading aircraft model was mainly composed of the following parts:blade bracket,blade bracket connection section, intermediate transition section of bracket, common bracket section, and anti-shaking steel cable. The support device was connected with the lower wall plate of the wind tunnel test section, and the angle of attack of the leading aircraft was changed by using angle changer. The following aircraft model was installed on the head of the six-degree-of-freedom mechanism by a turning balance tail strut and a rolling tail strut connected thereafter,and was connected with the bracket in the middle of the wind tunnel. The six-degree-of-freedom mechanism supporting the following aircraft was also the executing mechanism controlling the movement of the model. It was a mechatronics device controlled by a closed-loop position control system, and could provide six independent operations of pitch, yaw, roll, axial, lateral, and vertical to the following aircraft supported by the control instructions of the computer or the manual input device.The 6-DOF motion mechanism of Capture Trajectory System (CTS) was used to transform the position parameters of the formation of the following aircraft in the direction of extension, height, and the position of the flow direction in a small range. The position of the flow direction in a large range was adjusted by fixing the leading aircraft to the position of the lower panel in the test section.
The numerical simulation area of the relative position of two aircraft formation is shown in Fig. 1(a). Relative coordinates defined the original point as the right wing tip of the leading aircraft coincides with the left wing tip of the following aircraft.Flow,spanwise,and vertical directions werex-axis,yaxis, andz-axis, respectively. Such positions were dimensionless when using the rear wingspanb, which corresponds to the test results.Flow direction was simulated separately.Three locationsx/b=1.5, 3.0, and 5.0, with the spacing of 1/8bbetween+0.25band-0.25b, respectively, were encrypted with a step of 1/16bnear the wingtip. The specific test points are shown in Fig.1(b).The position of formation in numerical calculation was consistent with the experimental results.
All tests were conducted at a freestream Mach number of 0.76.The corresponding Reynolds number was approximately 8.0×10⁶(based on wingspan of the following aircraftb=0.49 m).Data were recorded using the wind tunnel continuous data acquisition system. Force and moment data were sampled at 1000 Hz and averaged for every 1° increment in angle of attack α of the following aircraft model.
2.1.2. Uncertainty analysis
The pyramidal balance was calibrated prior to testing,and calibration was repeatedly checked using a standard benchmark loading for forces and moments. The balance range and static calibration error are given in Table 1, from which we can see that the three force readouts remained within 0.3% of the applied load, and the moment readouts remained within 0.3% too. The Mach number accuracy was 0.0015-0.002,and the total pressure control accuracy was 0.2%-0.3%.
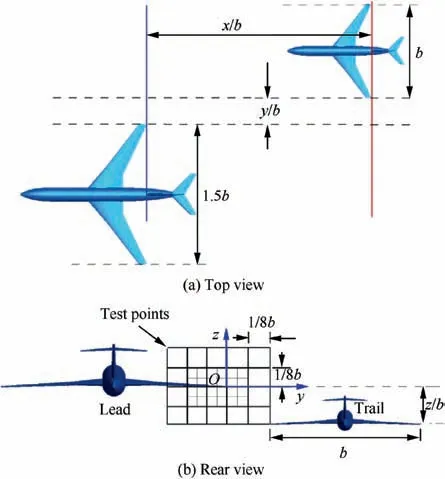
Fig.1 Top and rear view schematic diagram of relative position of two aircraft formation flight.

Table 1 Balance range and static calibration error.
2.2. Numerical method
2.2.1. Governing equations and numerical procedure
Formation flight involving non-negligible wing-tip vortices and other sensitive flow features requires high precision numerical calculations, fine mesh and accurate turbulence model. An in-house code is used herein, the detail of which can be found in Refs. 29,30.
The three-dimensional Reynolds-averaged Navier-Stokes equations are used as the governing equations to describe the physical phenomena, which can be expressed by the finite volume form:

where W is the vector of conservative variables, F and Fvare inviscid and viscous flux vectors, respectively, Ω is the control volume with the boundary ∂Ω,and dS is the infinitesimal face vector.
The turbulence model is needed to simulate the viscous problem. According to our experience, k-omega SST model has a good prediction of adverse pressure gradient, smallscale separation and some other aspects. It has unique advantages in calculating the external flow field of aircraft, and also performs well in terms of computational resource requirements and computational robustness.For the cruise state of a typical aircraft,the model behaves well,and the calculation results are generally in good agreement with the wind tunnel test results.Therefore, thek-ω SST (shear stress transport) model is used to simulate the turbulent behavior. So in addition to Eq. (1),thek-ω SST turbulence model31is adopted to evaluate the turbulence effect as the model is robust and well-behaved both near walls and in vortex regions. The dimensionlessk-ω SST equations with compressible modification are given below:

In the formula,kis the turbulent kinetic energy and ω is the vorticity of the fluctuating velocity, and the model parameters are usually taken as follows: σk=2.0, σω=1.4,Ck1=1.0,Ck2=0.09,Cω1=0.555,Cω2=0.83,Cμ=0.09.
The corresponding far-field boundary conditions are given by giving the velocity, pressure and density of the incoming flow. For the walls, the non-slip boundary conditions are adopted.
The governing Eqs. (1) and (2) constitute the governing equations for simulating the whole turbulent flow. With the corresponding boundary conditions, the governing equations can be solved numerically. For the flow governing equations and boundary conditions, the finite volume method is used to solve them numerically. The implicit LU-SGS approximation method is used for the temporal discretization in the calculation. Roe’s flux difference scheme is used to discretize the space convection term in the governing equations, while the central scheme is used to discretize the viscous term.After convergence of flow field calculation, aerodynamic forces and moments can be obtained by surface integration of the following aircraft model.
2.2.2. Grid specifications and mesh update method
Considering the relative location of the formation,a symmetric half of the leading aircraft and the full part of the following aircraft are simulated in present work. The symmetry plane may have some effects on the flow near the following aircraft as they are close to each other, but the approach is believed to be appropriate based on the following two reasons: (A)the influence quantity of the symmetry boundary condition is much smaller than that of the leading aircraft wake—only 5.7% of lift coefficient and 0.7% of drag coefficient, from calculation;(B)the present simulation comes closer to the real λshaped formation flight—as if a mirror copy of the following aircraft model stays on the other side of the symmetry.
A set of multi-block structured grids are adopted in the investigation. The H-type topology maintains enough anisotropic grid cells in the region between the two aircrafts, by assigning dense nodes in bothyandzdirection, therefore ensures high resolution for the wing-tip vortex. The grid spacing in normal direction of first layer near the wall is chosen to ensurey+≈1 so as to capture the velocity distributions in the viscous sublayer of the wall boundary layer.
The grid independence is studied in the early stage of the calculation. For the typical formation position ofx/b=1.5,y/b= -0.2 andz/b=0,three sets of grids with different size were adopted, and the results are given in Table 2, as well as the corresponding experimental results.
It can be seen that the grid size has an evident impact on the CFD results. With the grid size becomes smaller, the aerodynamic increment of the following aircraft gradually converges and approaches to the test results, and ideal results can be obtained with medium grid size. Considering both the simulation accuracy and computing resources, the medium grid size containing 17 million cells has been chosen to carry out the following research. Fig. 2(a) shows the distributions of surface mesh of one formation state.
Formation flight involves the relative motion of complex shapes. Parametric modeling is difficult, for it not only needs to satisfy large-scale shape adjustment, but it also needs to maintain good consistency and grid viscous characteristics before and after deformation. Otherwise, it will lead to large numerical error. The small number of modeling parameters cannot satisfy the smooth transition between the control point and the overall shape of the profile, whereas the large number of modeling parameters leads to inefficient optimization calculation.The grid intersection affects optimal calculation.Therefore, reasonable parametric modeling technology should minimize the number of modeling parameter points to ensure smooth and stable shape transition.32,33
According to the requirement of formation parameter transformation in formation flight simulation, a RBF_TFI structural grid updating method based on combination of Radial Basis Function (RBF) and transcendental difference was developed.RBF_TFI method calculated the displacement of the edge node of the grid block by using radial basis function interpolation method and updated the coordinates of the edge node.The deformed surface and volume meshes were reconstructed via TFI method. This method has high generation efficiency, can maintain the consistency of the new grid and the grid on the topological structure and grid points, has high generation efficiency, and can meet the requirements of formation flight calculation.Fig.2(b)shows the schematic diagram of mesh update method.

Table 2 Influence of mesh size on aerodynamic gain in formation flight.
2.2.3. Response surface model of aerodynamic forces
Based on flow field data, the first aerodynamic force, and the first moment, the numerical response surface model of the aerodynamic coefficients of the following aircraft was established by using the Kriging method.34
Specifically, the proxy model of each objective function(where lift-drag ratio and lift coefficient, drag coefficient, lateral force coefficient, pitch moment, yaw moment, and roll moment were selected as objective functions) was established by using the calculated data of all sample points (flow field data, first aerodynamic force, and first moment). Here, the Kriging method was used to establish the numerical response surface model. Kriging method is an interpolation method,which predicts the response of unknown points by known points and their response values. It generally takes the following form:

where Y(x) is an unknown Kriging model, FT(x) is a known function of independent variablex, β is the parameter to be estimated, Z(x) is a stochastic process, which is a local deviation with zero mean but non-zero variance based on the global model.
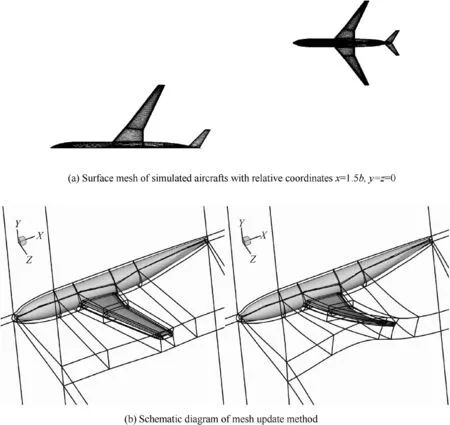
Fig. 2 Grid specifications and mesh update method.

Fig. 3 Vortex-induced lift-drag ratio at different flow direction positions, from wind tunnel test.
3. Results and discussion
3.1. Vortex-induced aerodynamics

Fig. 4 Vortex-induced drag coefficients at different flow direction positions, from wind tunnel test.

Fig. 5 Vortex-induced lift coefficients at different flow direction positions, from wind tunnel test.

Fig. 6 Vortex-induced side force coefficients at different flow direction positions, from wind tunnel test.

Fig. 7 Vortex-induced roll moment coefficients at different flow direction positions, from wind tunnel test.

Fig. 8 Vortex-induced yaw moment coefficients at different flow direction positions, from wind tunnel test.

Fig. 9 Vortex-induced pitch moment coefficients at different flow direction positions, from wind tunnel test.
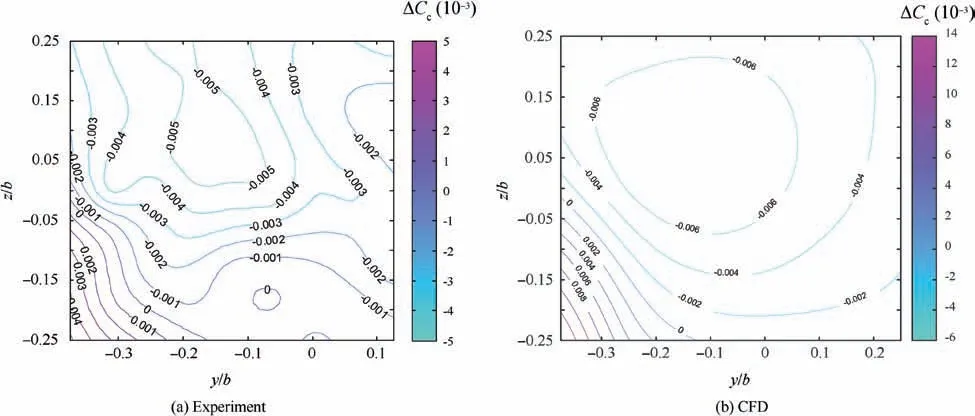
Fig. 10 Comparison between CFD and Experiment (Side force coefficient at x/b=5.0).
The vortex-induced aerodynamics changes are discussed in this section,based on wind tunnel experiment results.The angle of attack of the leading aircraft was 2.0°, and the angle of attack of the following aircraft was about 2.4° after considering the elastic angle, which are close to the designed cruise condition of both aircrafts. The lift-drag ratio of the following aircraft in the free flow state was 15.31 at the same angle of attack.Fig. 3 shows the lift-drag ratio K at different flow direction positions.The lift-drag ratio of the following aircraft increases greatly in the range of the measured spread and normal directions. The peak value was within the range of 5%-20% overlap of the two wings. With the increase of the stream-wise distance, the optimal position of the following aircraft where the maximum lift-drag ratio was obtained moved inward(closer to the leading aircraft)and downward,which was similar to the development trend of the wing wake-tip vortex. At the same time, the magnitude and range of the lift-drag ratio increased gradually with flow direction,which might be related to the increase of the influence range of the wake vortex core.The maximum lift-drag ratio increased by about 27%. Fig. 4 shows the trend of drag coefficients variation ΔCD in cross sections with different flow directions. The drag coefficients for single aircraft was 0.0284.The long tail vortex had substantial drag reduction effect on the following aircraft.The magnitude of drag reduction increased slightly with the flow direction position,and the variation of the peak area was basically similar to that of the lift-drag ratio. The maximum resistance decreased by about 16%. Fig. 5 shows the trend of lift coefficients variation ΔCLin cross sections with different flow directions.The lift of following aircraft in the foundation state was 0.4456.Fig.5 shows that the long tail vortex affected the lift of following aircraft.The increment of lift increased slightly with flow direction, and the variation of peak area and lift-drag ratio was basically the same. The maximum lift increased by about 12%.
Fig. 6 shows the trend of cross-section lateral force coefficients variation ΔCcat different flow directions.The following aircraft was subjected to the force pointing to the side of the following aircraft in most areas.Only the lateral force pointing to the side of the following aircraft existed in the lower left area. At the same time, near the corresponding position of the maximum lift-drag ratio, the lateral force was 0 or close to 0,which was good for formation flight.The formation flight in the lateral direction was statically stable. Fig. 7 shows the trend of cross-section rolling moment coefficients variation ΔClin different flow directions.The following aircraft was subjected to right rolling moment far from the mainframe, to left rolling moment near the mainframe, and to zero rolling moment near the corresponding position of the maximum lift-drag ratio. Therefore, the roll angle of formation flight was statically and neutrally stable in terms of roll moment.Fig. 8 shows the trend of yaw moment coefficients variation ΔCnof cross section in different directions. The following aircraft wing plane received right yaw moment at the position far from the mainframe and left yaw moment at the position near the mainframe. Fig. 9 shows the trend of pitching moment coefficients variation ΔCmat different flow directions.The following aircraft wing plane was subjected to bowing moment in the position far from the mainframe laterally and the head-up moment in the position near the mainframe laterally.
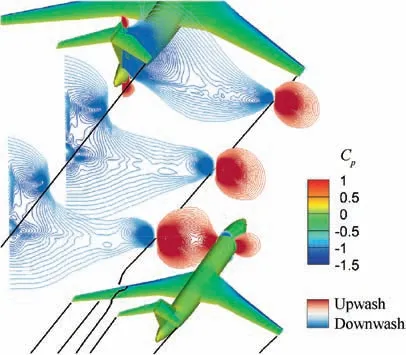
Fig. 11 Wake flow structure in formation flight, by CFD.
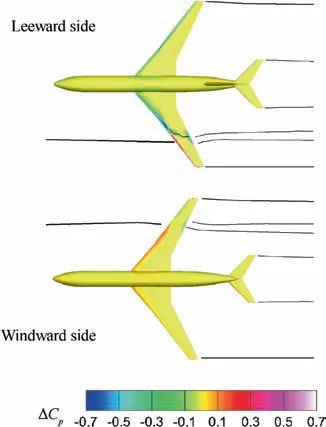
Fig. 12 Wake induced ΔCp of following aircraft, by CFD.
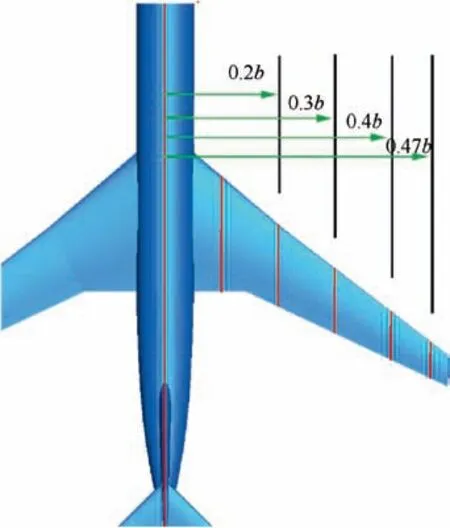
Fig.13 Section diagram of different wings of following aircraft.
3.2. Formation effect on surface pressure
The comparative study was conducted between CFD and experiment. Fig. 10 shows the comparison between CFD and experiment for side force coefficientCc.From the experimental result,Ccdecreases evidently neary/b= -0.15 andz/b=0.1, and increases when the following aircraft comes to inner and more downward position. Similar phenomena appear in computational result despite some quantity deviation,meaning that presently used numerical method has a certain validity and can contribute a better understanding of the flow mechanism of wing-tip vortex influence.
3.2.1. Basic flow mechanism of formation flight
Numerical simulation of typical formation position ofx/b=1.5,y/b= -0.2, andz/b=0 was conducted to study the basic flow mechanism of the formation flight. Fig. 11 shows the flow field of including the wake vortex core, the wash flow distribution of different stream-wise sections and the surface pressure distribution of both aircrafts. It can be seen that the wash flow distribution downstream of the leading aircraft is mainly affected by the wing-tip vortex. The rolling direction of the vortex determines that the downwash area is located on the side near the fuselage of the leading aircraft,and the upwash area is on the opposite side of the vortex core.To study the influence of the wing-tip vortex on the following aircraft, the contour of the surface pressure coefficients variation ΔCpcaused by the formation is given in Fig.12.The wake of the leading aircraft mainly affects the pressure distribution on the wing surface of the following aircraft. When the wings of two aircrafts overlap to a certain extent, the outer part of the wing on the overlapping side of the following aircraft is affected by the downwash area, so the pressure on upper surface increases and the lower surface decreases.The rest part of the wings is in the upwash area, causing pressure decrease on the upper surface and increase on the lower surface. With the change of formation position parameters,the following aircraft is in different positions of the wake flow field of the leading aircraft,and the influence of local washing flow is changed,too,so that the aerodynamic forces are different.In the following sections, four sections of the main affected wing (seen in Fig.13)of the following aircraft are selected to study the influence of different spanwise position, stream-wise position and vertical position of the following aircraft on the pressure distribution change.
3.2.2. Effect of spanwise formation position on pressure distribution of following aircraft
Fig.14 shows the calculated influence of the spanwise position change of the formation on the pressure distribution of the wing sections of the following aircraft in extended directions.Too large overlap area of the wing tips caused the lift loss of the lateral section of the rear wing. When the wing tips overlapped a little, there was a lift increase near the outside of the wing. Generally, the beneficial effect iny/b= -0.125 was better.As the following aircraft moved outward,the magnitude of this beneficial effect and the influence area decreased gradually.
3.2.3. Effect of vertical formation position on pressure distribution of following aircraft
Fig.15 shows the calculated influence of the vertical formation position on the pressure distribution of the wing sections of the following aircraft. All vertical positions can bring lift benefits compared with free flow.For this short-range formation flight,the benefit was optimal when the leading and following aircrafts were in the same horizontal plane,that is wherez/b=0.
3.2.4. Effect of stream-wise formation position on pressure distribution of following aircraft
Fig. 16 shows the calculated influence of the change of the steam-wise position on the pressure distribution of the wing of the following aircraft. It can be seen from the diagram that different flow direction positons can bring lift benefits compared with free flow.The effect on inner wing section is better when the distance is closer, and the lift effect on outer wing is slightly better when the distance is far which is related to the motion of the tail vortex of the leading aircraft.
3.3. Vortex interaction and analysis
Wake vortex is a very complex flow phenomenon that many researchers have studied. According to the collaborative research program,the near wake field,the extended near wake field, the mid wake field, and the far wake and dissipation fields are the four significant stages of aircraft wake. The formation position in this study is mainly between the near wake field and the extended near wake field.
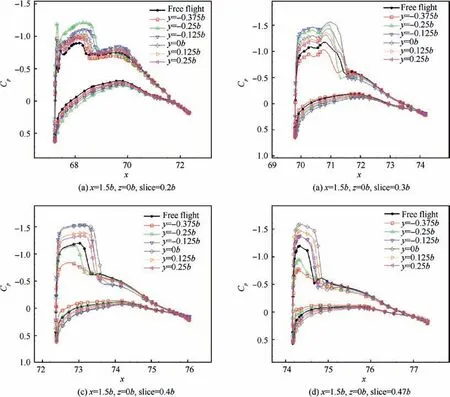
Fig. 14 Effect of spanwise formation position on pressure distribution of following aircraft at different wing sections, by CFD.
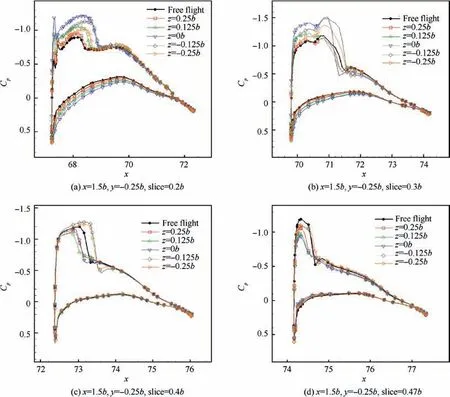
Fig. 15 Effect of normal formation position on pressure distribution of following aircraft at different wing sections, by CFD.
Fig. 17 shows an overall view of leading aircraft wing tip vortex induced lift-drag ratio increment at different flow directions obtained by wind tunnel experiment. As shown in the figure, when the flow direction distance of the two aircraft was relatively close (x/b=1.5), the wake flow of the leading aircraft was basically between the near wake field, the extended near wake field, very close to the rear edge of the aircraft wing, and the flow direction range is about the order of the average aerodynamic chord length of the wing, which was characterized by the vortex shear layer composed of Highly Concentrated Vortices starting from the rear edge of the wing. In addition, the leading aircraft’s vortex core at the wingtip was relatively concentrated, and the washing area at the rear was relatively concentrated. The maximum liftdrag ratio increased about 3.33. When the relative position moved to the downstream direction (x/b=3.0 and 5.0), the rear was in the flow field of the approach vortex extension area of the leading aircraft (and the extended near wake area in this area field), the region was generally within 10 times the span of the aircraft, which was mainly characterized by the rolling up and fusion of the wingtip vortex. Finally, a pair of counter rotating vortex pairs were formed. The increment of the maximum lift-drag ratio of the following aircraft was about 4.35, which basically remained unchanged with the change of the flow direction position. The effective position moved downward and inward with the increase of the flow direction, and the aerodynamic characteristics of the following aircraft were more sensitive to the spanwise spacing.The wingtip vortex was stable in rotation speed for quite a long time after rolling up, and obvious laminar flow phenomenon appeared. In this stage, the effect of turbulence was very small and can be ignored.16,35In this stage,the wake existed for a long time, and the rotation speed was stable,which had the greatest impact on the following aircraft. The research of formation flight vortex surfing was mainly carried out in this range. Table 3 shows the following aircraft’s maximum increment of lift-drag ratio and the corresponding formation parameters in different flow directions. The optimal position was about 20%in the extension area of the approach wake, which was slightly larger than the 15% overlap of the same size aircraft in the literature.22In terms of quantity,the increase of lift-drag ratio was also much higher than that of 15% in the literature,22reaching over 27%. Analysis showed that the formation flight revenue was more stable in the extended near-wake field. In the research scope of close formation flight,the influence of lateral spacing was the greatest followed by the influence of vertical and longitudinal spacing. In a narrow range of the lateral distance, the effect of eddy current surfing was substantial. The vertical distance increased, and the surfing effect decreased.
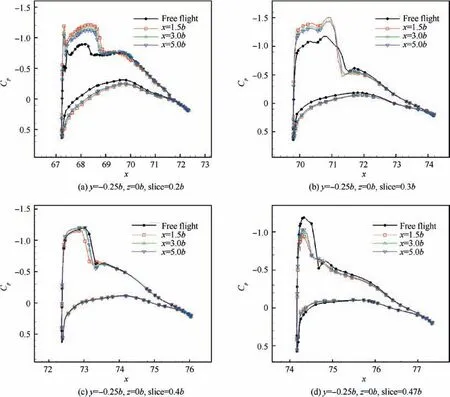
Fig. 16 Effect of stream wise formation position on pressure distribution of following aircraft at different wing sections, by CFD.
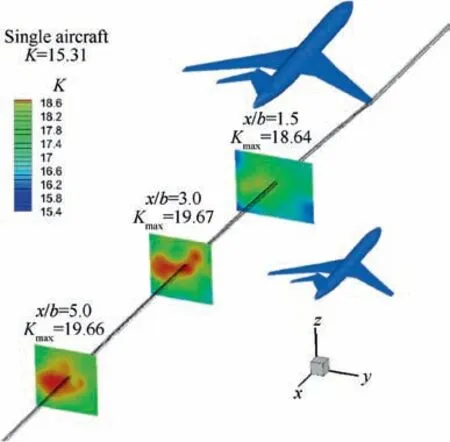
Fig. 17 Overall view of leading aircraft wing tip vortex-induced lift-drag ratio increment at different flow direction positions, by wind tunnel test.

Table 3 Following aircraft’s optimal gain of lift-drag ratio and formation parameters in different flow directions.
4. Conclusions
Hybrid formation flight offers more significant reductions in induced drag and lift increment than traditional formation flight with the same type of aircraft. Numerical method for large aircraft hybrid formation was established, including equation discrete and mesh updating methods. The Kriging response surface model of aerodynamic force and relative formation parameters was established by using the calculated data.The test results are in good agreement with the calculated values and trends. By analyzing the numerical calculation and test results, the following conclusions can be obtained:
(1) Hybrid formation flight is very beneficial to the improvement of the aerodynamic characteristics of the following aircraft. Under cruising condition, the drag of the following aircraft in a reasonable position decreases by about 16%, and lift increases by about 12%. Significant increase in lift-drag ratio is found for two aircraft as high as about 27%.
(2) The lateral force near the maximum lift-drag ratio and the moment coefficients in three directions are about 0,in which the lateral force is statically stable. The rolling moment is statically unstable,which needs to be considered in flight control.
(3) The three flow direction-sections studied are all located in the extended region of near-field wake vortices (1b-10b). In this region, the lift-drag ratio of the following aircraft is obviously improved. Formation flight can be carried out in a wide flow direction (1.5b-5.0b). The aerodynamic gain tends to stabilize in 3.0band 5.0bintervals.
(4) The slight overlap of wing tips is beneficial to the dissipation of the counter-rotating vortex pair,and the effect of increasing lift and reducing drag is more effective.The following aircraft should be in the upwash flow of the leading aircraft as far as possible. Compared with 15% wingtip overlap of conventional formation flight,the optimal wingtip overlap area of hybrid formation flight is increased to about 20% span length.36,37
Declaration of Competing Interest
The authors declare that they have no known competing financial interests or personal relationships that could have appeared to influence the work reported in this paper.
Acknowledgment
This work was supported by the National Natural Science Foundation of China (No. 11372337).
 CHINESE JOURNAL OF AERONAUTICS2021年1期
- CHINESE JOURNAL OF AERONAUTICS的其它文章
- Tangling and instability effect analysis of initial in-plane/out-of-plane angles on electrodynamic tether deployment under gravity gradient
- Aerodynamic periodicity of transient aerodynamic forces of flexible plunging airfoils
- Effects of swirl brake axial arrangement on the leakage performance and rotor stability of labyrinth seals
- Tomography-like flow visualization of a hypersonic inward-turning inlet
- Hypersonic reentry trajectory planning by using hybrid fractional-order particle swarm optimization and gravitational search algorithm
- A theoretical and 1-D numerical investigation on a valve/valveless air-breathing pulse detonation engine
