
A cross-sectional study of the relationships between ethnicity and occupational classes with mental wellbeing in the UK
2021-02-07 04:56:12AlizaAyaz
Life Research 2021年1期
Aliza Ayaz
1Institute of Epidemiology and Healthcare,University College London,Britain.
Background: Various aspects of a job (e.g.contract clauses,promotion,wages,job security and workplace hierarchy) are becoming increasingly complex and have some effect on an employee’s wellbeing.Simultaneously,research about an increase in mental health issues due to workplace obstacles for ethnic minorities is amassing but there is a lack of policymaking to tackle this via accessible mental health support at the workplace.My study aims to assess the effect of occupational class and ethnicity on wellbeing in the UK working population.Methods:The study assessed 3,374 adult employees who participated in the Health Survey for England from 2014-2016 and were categorised in 1/3 National Statistics Socio-economic Classification groups.The Warwick-Edinburgh Mental Wellbeing Scale was used as a measure of mental wellbeing.I explored the relationship between occupational class and wellbeing score using linear regression,accounting for demographic and socioeconomic covariates:age,sex,income and education.My sample’s ethnicity breakdown was White:3,051; Black:83; Asian:180; Mixed:39; Other:21 adults.Results: Of the sample,46.8% of adults belonged to managerial and professional occupations and 90.4%were of White ethnicity.Managerial and professional occupations had a higher mean wellbeing score (48.54; P <0.001) than routine and manual occupations (47.69; P < 0.05).Multiple ethnic background showed the highest mean wellbeing score (52.82; P < 0.05),compared to White adults with the lowest wellbeing score (48.57; P << 0.001).Unlike occupational class which had a small effect size (partial eta-squared = 0.02),when holding education,income,age and sex constant,ethnicity had a statistically significant association with wellbeing.Conclusion:White ethnicity and routine and manual occupations are high-risk groups for poor mental wellbeing.The impact of ethnicity and occupational class on wellbeing scores remained after accounting for socioeconomic and demographic factors.
Key words:Mental health,Workplace health,Ethnicity,Employee wellbeing,Health inequalities,England,Health Survey for England
Background
Ethnic inequalities in mental wellbeing,as well as the association between work and mental wellbeing,have been increasingly noted in the literature [1,2].Yet,there remains a lack of tailored wellbeing support in workplaces,with no identification of high-risk groups[3].The UK dynamic resonates with a sample from the Canadian Community Health Survey [4]:compared to White respondents,South Asian,Chinese,and Black respondents have higher levels of self-reported physician-diagnosed mood and anxiety disorders and lower mental health service use [5].Taylor (2017) notes that wellbeing differences are potentially more defined in routine and manual occupations (RMOs) who have a higher risk of both physical and psychological damage,including anxiety and depression.Often,ethnic minorities are clustered in these occupations.I analysed the distribution of wellbeing scores across ethnicities by occupation class in Figure3 below then more closely and simply analysed the association between a)wellbeing and occupational class (OC),b) wellbeing and ethnicity.For this purpose,my research identifies the importance of OC in determining mental wellbeing and the extent to which Black and Minority Ethnic(BME) groups should be prioritised to receive mental wellbeing support.
The Centre for Mental Health predicts that 1/4 people in the UK will have a mental illness at some point [6].However,mental wellbeing is different from the general measures of mental health in the existing literature:it is not merely the absence of mental disorders,but a state of psychological functioning and the ability to cope with daily life that impacts how one thinks,feels and behaves[7].Anxiety and depression most commonly compromise mental wellbeing and an increasing proportion of these are caused by work-related stress[8].The extent to which this stress is prolonged determines whether it leads to significant changes in mental wellbeing [9].Therefore,employees’ mental wellbeing is a socioeconomic priority,determining the extent to which someone can contribute to society and work productively [10].
Different ethnic groups have different experiences of mental health problems that reflect their culture and context [11],with Asian and Black communities facing more individual and societal challenges that affect their wellbeing [12].Accordingly,I hypothesise that wellbeing is better among the White ethnic group and the managerial and professional occupations (MPOs).
The World Health Organisation further notes that work-related conditions and stress have emerged as the most common factors in deteriorating mental wellbeing among various ethnic groups globally [10].The 2017 Health Survey for England (HSE) reported that working days lost due to stress,depression or anxiety accounted for 49% of all working days lost due to ill health [13].The Mental Health Foundation notes that it is important to explore these ethnic differences in mental health according to the occupational category [12].
Age,gender,income quintile,and highest educational qualification are noted as covariates among the HSE items that are associated with both mental wellbeing and OC.These covariates have been suggested in the studies Crisp,Smith and Nicholson(2016),EHRC (2016),Kumar et.al (2017) and Crompton and Shrimp (2015) respectively.Furthermore,recent literature has found associations between mental wellbeing and household tenure [14],poor diet [15],physical inactivity [16],smoking [17],or long working hours [18].However,I was unable to operationalize these variables from my conceptual model due to a lack of appropriate and/or consistent measures in every HSE cohort.Figure1 below shows a conceptual framework that attempts to map out the associations between employment grade/OC and mental wellbeing,ethnicity and wellbeing and the potential mediators.
There is a lack of information on the effective delivery of employee wellbeing reforms in employers’existing duties to make reasonable improvements to mental health support [19].As such,it is difficult for employers across different occupational groups to recognise the socioeconomic reasons for hiring and retaining people with poor mental wellbeing both in the short and long term.This hinders the creation of workplaces where people can thrive.These academic findings regarding ethnic and occupational disparities will influence employer policies and behaviours across different types of workplaces to implement wider frameworks that result in improved mental wellbeing outcomes.Hopefully,these span from work-related advice and supportive engagement to adjustments at work for managing their mental health [20].Some examples of these measures include peer/line manager relationship building for social support,as well as increasing employee control in the workplace [21].
My study,therefore,aims to look at the relationship between wellbeing and OC and wellbeing and ethnicity to answer.1) What are the ethnic group differences in mental health? 2) Do these remain when considering occupation and other determinants of mental health? 3)How does occupational social class moderate the relationship between ethnicity and mental health?
Methods
Study design
The study used data from the HSE,a cross-sectional,nationally representative study that is repeated annually and uses multi-stage random stratified sampling.The HSE uses a mix of interviews and nurse visits to collect
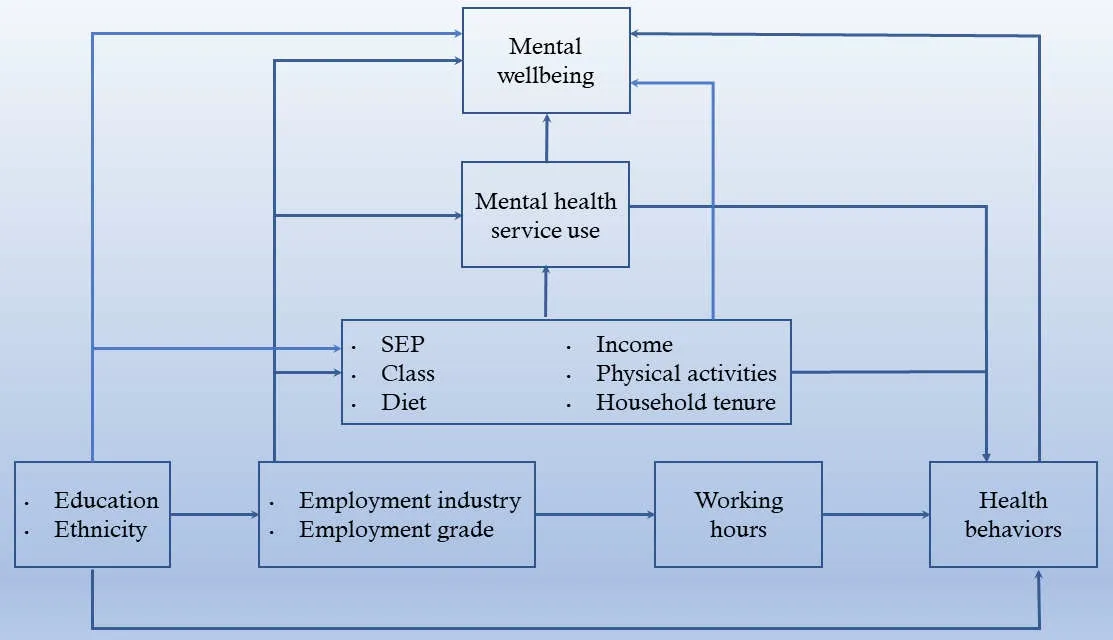
Figure1 Conceptual framework of the association between occupational class and mental wellbeing.SEP,socioeconomic position.
data on physical health,mental health and wellbeing,social care,lifestyle behaviours and physical measures.HSE data were accessed through the UK Data Service.This dissertation pools three years of HSE data from 2014-2016.It considers only those aged 25-64-yearold and those allocated to 1/3 employment categories of the National Statistics Socio-economic Classification(NSSEC3).I used this age group as it considers that most people might not have finished education before age 25 to qualify for professional roles and that most people retire after age 64 in the UK [22].
I pooled the HSE 2014-2016 surveys to make my sample size larger because the yearly data collected on mental health in minority ethnic groups were subject to small sample sizes,limiting my ability to look at mental wellbeing within a specific ethnic group.
Details regarding the methods of collecting information,interviewing and surveying are also available at NHS digital (2020).I did not need ethical approval for this research as it was already obtained by the HSE from West London Research Ethics Committee(reference number 14/LO/0862) for the years 2014-16.
Variables
My exposure variables are occupational class and ethnic group while my outcome variable is mental wellbeing.I also look at education,income,sex and age as covariates of the aforementioned associations.
Exposure variables
OC was measured using the NSSEC3.This variable measures the employment relations and conditions of occupations [23].I used the three-category version which categorised individuals according to MPOs,intermediate occupations (IOs) or RMOs.NSSEC3 allocation was done through interviewers who asked questions on employment size/organisation,occupation description,last or current main job,occupation title,supervisory status,self-employed or working with employees and number of employees if self-employed[24].This shows how the NSSEC3 variable captures the workplace condition and employment relations of occupations to some extent.
Ethnicity was self-reported in a questionnaire in the following categories:White,Black,Asian,mixed ethnic backgrounds (MEB) or Other.
Outcome variable
I measure wellbeing through the Warwick-Edinburgh mental wellbeing scale (WEMWBS) as it provides a single summary value (between 14-70) indicating a person’s overall level of mental wellbeing with an indication of positive mental functioning.A higher score indicates a higher level of mental wellbeing.Wellbeing scores were assessed in self-completion booklets in an interview (which could include up to 4 people) with questions about their level of autonomy and satisfaction in life,developing and maintain mutually benefiting relationships,purpose in life and self-esteem or self-acceptance [25].In the HSE,in both cases of self-reporting and where the interviewers filled in the answers for participants when they answered the WEMWBS,social desirability bias could have been introduced due to the tendency to respond more favourably than their actual wellbeing levels,thus skewing the results [26].
In this study,I refer to the NHS direct and WEMWBS thresholds for interpreting the WEMWBS scores in my analysis but treat the WEMWBS score as a continuous variable:scores below 40 indicate low mental wellbeing; scores 7-17 represent probable depression or anxiety and scores 18-20 represent possible depression or anxiety.Scores equal to or greater than 60 indicate high wellbeing and they represent the top 15% of scores on WEMWBS [25].
Covariates
Income was derived from the total gross previous month household income,equivalized for household composition and recoded into 5 quintiles.
Education was measured via the highest educational qualification from the following groups:NVQ4/NVQ5/degree or equivalent,higher education below degree,NVQ3/GCE A-level equivalent,NVQ2/GCE O level equivalent,NVQ1/CSE other grade equivalent,foreign/other and no qualification.
I also study age in ten-year age bands and sex.These were self-reported,and I combined data from 3 waves(2014-2016) to maintain consistency in the variables over time and to avoid a small sample size with insufficient power to detect differences.
Analytical sample
Despite pooling 3 waves of HSE (2014-2016) which gave me a combined sample of 10,080 participants,only 3,374 (1,474 women,1,900 men) fit my criteria:participants allocated to 1/3 NSSEC3 classes; aged 25-64 years and complete cases for my covariates.I used the complete case analysis because the proportion of missing cases/item non-responses were < 5% and hence I removed any individuals with missing data,“don’t know” or “refused” and unwanted coded categories for my variables of interest as depicted in Figure2.
There is sample exclusion at each stage of Figure2 because participants either had non-response or lied outside the variable categories of my interest at each stage.The numbers do not add up as the missingness numbers do not account for overlap.
I excluded those with foreign educational qualifications as there are inconsistencies in how these foreign qualifications are ranked by UK workplaces and how they are translated to the UK equivalent educational qualification system used in the HSE [27].Additionally,my dissertation aims to contextualize adults growing up in the UK i.e.have benefitted from UK-quality education.
Obtaining foreign qualifications have the potential to provide a positive experience to individuals by offering them a significant opportunity to meet and connect with new people and ideas,kickstart their adult life,and make a better future for themselves through earning higher education qualifications.Nevertheless,employees at workplaces are likely to face adjustment challenges due to differences in foreign and locally acceptable qualification which may manifest as mental health issues with varying degrees of impact [28].Besides educational challenges and financial issues,it is also common for employees in all 3 NSSEC3 occupational classes to leave home for their studies,which can have a significant impact on individual wellbeing [29,30].
My regression analysis is based on a model which by design required samples to be home educated.My research concludes that poor well-being has previously been predicted by a less positive personality,a less healthy lifestyle,a higher course demand - often an attribute of foreign qualifications,less control and support for academic work and unfamiliarity with local employing well-being strategies.Moreover,the regression analysis considers that those with foreign qualifications are often required to go through training periods before working in full authority of their roles,leaning towards more negative well-being.
Analytical technique
I conducted my analysis using R-Studio.A descriptive analysis was conducted with categorical variables presented as proportions/percentages and continuous variables summarized using mean and standard deviation (SD).I also noted the 95% confidence intervals (CIs),odds ratios (ORs) andPvalues statistical significance atP< 0.05.An independent-samples t-test and two-way analysis of variance test (ANOVA) were performed to determine differences in mean wellbeing scores between categorical variable groups and to compare regression model fit respectively.
Multivariate linear regression was used for implementing models using a stepwise approach first showing unadjusted associations in Model 1 with ethnicity as a covariate,then Model 2 with OC.I study 2 more models:Model 3 to better understand the effect of socioeconomic factors (income and education) and Model 4 to study the additional effect of demographic factors (age and sex) on wellbeing.
While theP-values confirm whether an association exists,they do not indicate the strength of association.Therefore,I use Cohen’s d and partial eta-squared (η2)(PES) tests to measure effect sizes.I interpret the effect sizes as follows:0.01~small,0.06~medium,>0.14~large.PES is derived similarly to R-squared and has the most equivalent meaning:out of the total variation in WEMWBS scores,PES gives the proportion that can be attributed to my exposure variables - ethnicity and occupational class and other covariates.
Results
The biggest ethnic group sample was White ethnicity with 3,051 individuals.The mean wellbeing score of my sample is 51.17 units.My results were not what I expected- mental wellbeing was the worst among the White ethnic group.This did not match the results from the existing literature which identified that Black and other ethnic minorities have notably poorer wellbeing[21,31].Table1 shows the mean wellbeing(WEMWBS) scores among categorical variable groups and the effect size which is independent of sample size.Barring age,OC,education level,income,ethnicity all had a significant but small effect size on wellbeing scores with PES 0.02,0.02,0.03,> 0.001,respectively.
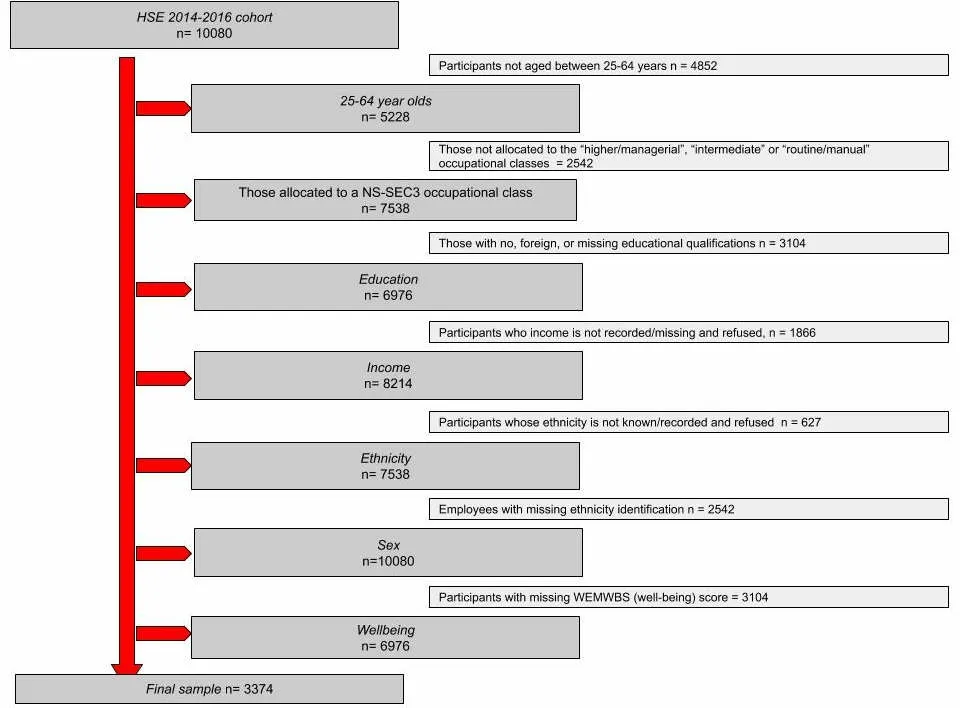
Figure2 Steps to create my analytical sample
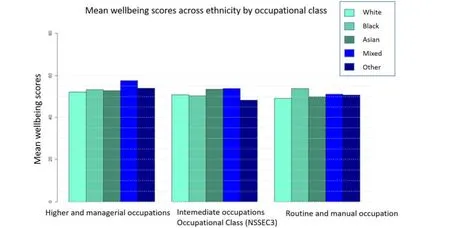
Figure3 Distribution of wellbeing scores across ethnicities by occupational class
Descriptive statistics
Occupational class.Table1 shows the distribution of the population and means across covariates across OC.MPOs had a mean wellbeing score of 52.30 (CI:51.91-52.68) and consisted of 47% of the sample.Those who were in IOs had a mean 51.06 wellbeing score (CI:50.83-51.89),representing 25% of the sample and finally,RMOs had a mean wellbeing score of 49.43 (CI:48.84-50.02) and 28% of the sample.
Ethnicity.Ninety percent of the sample population was White and this group had a mean wellbeing score of 52.55 (CI:50.72-51.32).The second biggest contributor to the sample was the Asian ethnicity at 5%of the sample with a mean wellbeing score of 52.17 (CI:50.78-53.57).The smallest sample of ethnicity was the“Other” ethnic group at 0.62% with a mean wellbeing score of 51.95 (CI:48.06-55.85).The Black ethnicity represents 3% of the sample with a higher mean wellbeing score of 53.05 (CI:51.05-55.05) whereas the MEB group represented 1% of the sample with the highest mean wellbeing score of 54.69 (CI:51.49-57.89).
Gender.Females had a slightly lower mean wellbeing score than males at 51.13 (CI:50.69-51.57) and represented 56% of the sample.
Education.“NVQ1/CSE other grade equivalent” level was just 4% of the sample with the lowest meanwellbeing score of 48.13 (46.51-49.76).
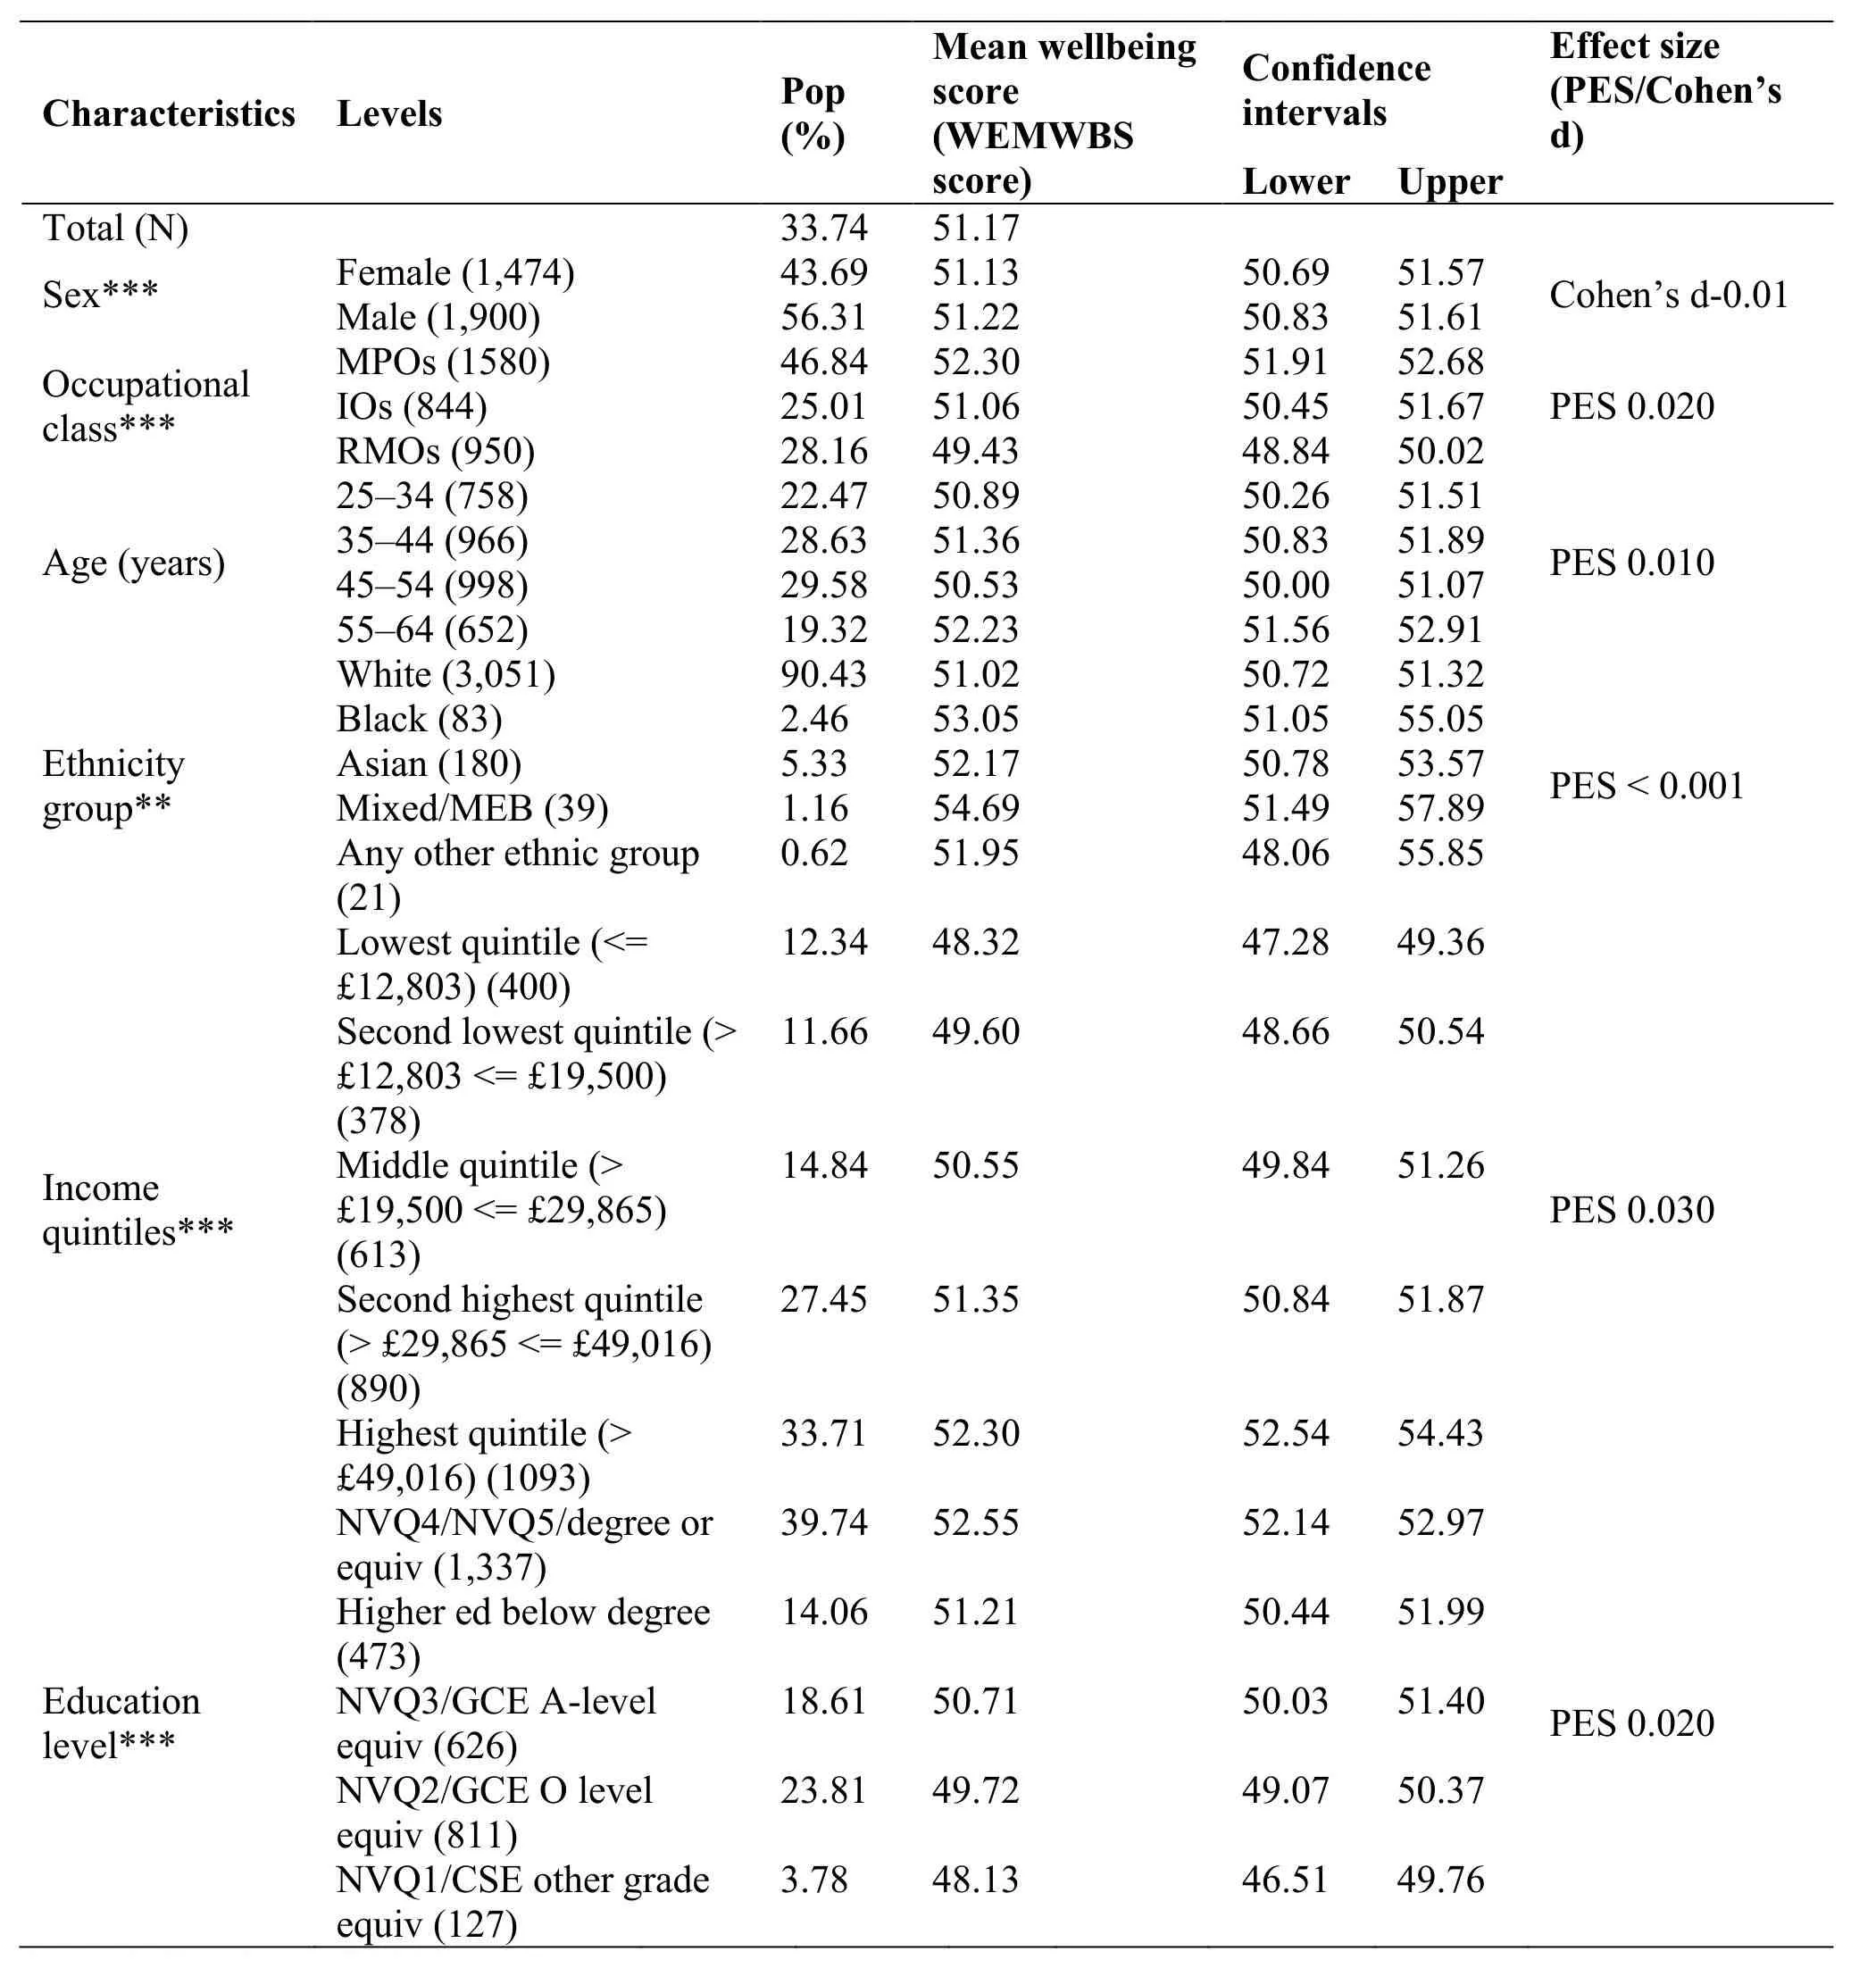
Table1 Mean wellbeing (WEMWBS) scores among selected categorical variable groups and distribution of the population
Age.Thirty percent of the sample population was aged 45-54 years and had the lowest mean score 50.53 (CI:50.00-51.07).The effect size of the association between age and wellbeing was extremely small (Cohen’s d =-0.01).
Income.The lowest quintile represents 12% of the sample with the lowest mean score of 48.32 (CI:47.28-49.36).I then studied the interaction of ethnicity and OC with respect to wellbeing to analyse ethnic differences in wellbeing across the different OCs.This is displayed in Figure3 which shows that there are no significant differences in wellbeing due to the interaction of OCs and ethnicity.The relationship between OC and wellbeing does not depend on ethnicity and vice versa.
Regression
As noted in Table2,in Model 1,the effect of MEB(3.67;P< 0.01)) or Black (2.02;P= 0.03) is higher than White ethnicity and statistically significant on wellbeing scores.In Model 2,I include OC in the regression which reduces the association between ethnicity and wellbeing slightly but at the same statistical significance as Model 1.All OCs have a statistically significant effect on wellbeing,predicting that the lower the OC the lower the wellbeing score (IOs versus MPOs -1.19,P< 0.01,RMOs versus MPOs-2.86,P< 0.01).Wellbeing scores further significantly improve for MEB by 3.71 units (P< 0.01) than White.In Model 3 the wellbeing scores of Asian (1.23,P=0.01),Black (2.33,P< 0.01) and Other (2.11,P< 0.01)ethnicities improve compared to White and become significant while holding education and income constant.In Model 4,while holding sex,age,education and income constant,the statistically significant associations were:increase in wellbeing for MEB (4.25,P< 0.01),Asian (1.40,P= 0.03) and for Black (2.56,P< 0.01) in comparison to White.Meanwhile,the effect of OC in reducing wellbeing disappears after accounting for income,sex,age and education as thePvalues are no longer statistically significant.
In Table2,Black ethnicity has 2.02 units higher wellbeing scores than White in Model 1.Subsequently,while adding other variables in subsequent models,Black ethnicity had even higher wellbeing scores than White (for Black versus White:Model 2 = 2.06,Model 3 = 2.33 and Model 4 = 2.56) and these scores remained statistically significant,therefore suggesting an important disparity.Asian ethnicity has 1.15 units higher wellbeing scores than White ethnicity in Model 1.Subsequently,while adding other variables in subsequent models,Asian ethnicity had even higher wellbeing scores than White (for Asian versus White:Model 2 = 1.07,Model 3 = 1.23 and Model 4 = 1.40)and these scores became statistically significant,indicating a notable disparity.MEB ethnicity has 3.67 units higher wellbeing scores than White ethnicity in Model1.With the addition of covariates,MEB ethnicity had even higher wellbeing scores than White (for MEB versus White:Model 2 = 3.71,Model 3 = 4.13 and Model 4 = 4.25) and these scores remain statistically significant,again suggesting an important disparity.
However,the improvement in wellbeing score for“Other” ethnic groups was only statistically significant in Model 3 (for Other versus White:Model3 = 2.11).IOs have 1.19 units lower wellbeing scores than MPOs in Model 2.Subsequently,when adding other variables in subsequent models,the difference in wellbeing scores between IOs and MPOs reduced (for IOs versus MPOs:Model 3 = -0.04,Model 4 = -0.03) and became statistically insignificant,indicating a weak correlation between the two.Similarly,the RMOs’ mean wellbeing scores were 2.86,0.98,and 0.88 units lower than MPOs in Models 2-4 respectively.The correlation between RMOs and wellbeing became statistically insignificant across Models 2-4.Table3 shows how the variation in wellbeing scores is attributed to the variables in my model while controlling for the number of predictors in my model,allowing a comparison between my bestfitted and most parsimonious model.
Model 4 is my final model in this dissertation analysis.It has the highest R-squared as it has the greatest number of variables.The higher the R-squared,the better the regression model predicts wellbeing.Overall,it is still a small percentage (5%),showing that there are other factors influencing wellbeing that are not accounted for in my models.Capturing what factors affect wellbeing is very complex:wellbeing is subjective,the satisfaction of subjective values at workplace have no quantity measure,there are different socio-political judgements regarding the definition of wellbeing and the level of individual emotional resilience can tamper the true,absolute wellbeing score.Likelihood ratio tests in Table4 produced significant results when in both case A and case B.This suggests that in each case,the models differ significantly from each other.Looking at case B,Model 4 fits the data significantly better than Model 3 and so adding all the four covariates in my model enhances model fit.I do not compare Model 1 and Model 2 as I want to see whether adding covariates to the main exposure model (Model 2) significantly improves my model fit.My research concludes that poor well-being has previously been predicted by a less positive personality,a less healthy lifestyle,a higher course demand - often an attribute of foreign qualifications,less control and support for academic work and unfamiliarity with local employing well-being strategies.Moreover,the regression analysis considers that those with foreign qualifications are often required to go through training periods before working in full authority of their roles,leaning towards more negative well-being.
Discussion
Key findings
MPOs were most likely to have greater mental wellbeing followed by IOs and then RMOs class.In my relatively small national sample of 25-64 year-old NSSEC3 employees of various ethnicities,Table2 shows that the wellbeing scores have little variation across sex and age.The effect of each ethnicity on wellbeing score increased as demographic and socioconomic factors are controlled.Once these were taken into account,compared to White,Asian ethnicity had the least improvement whereas MEB had the greatest increase in wellbeing score.
When controlling for income and education in Model 4,I noted a lower risk of compromised wellbeing in each OC.This was not the case in Kun and Gadanecz(2019) which found that feedback,finding meaning in work and social relationships at work impacted wellbeing much more than income and/or education for most employees,regardless of ethnic differences.My results emphasise that income and education can largely attenuate the risk of poor mental wellbeing between ethnicities but not always.
Poor mental wellbeing still stands as a major threat to work productivity and general individual health,thus placing immense pressure on both public and private healthcare to cater to these needs.The results show that disparities in markers of income and education are a risk factor of poor mental wellbeing.Policymakers can accordingly target the drivers of poor mental wellbeing and understand how they could very much differ from person-to-person depending on their ethnicity despite the same occupational class.Lastly,my dissertationidentifies a specific risk of poor wellbeing scores in RMOs employment.
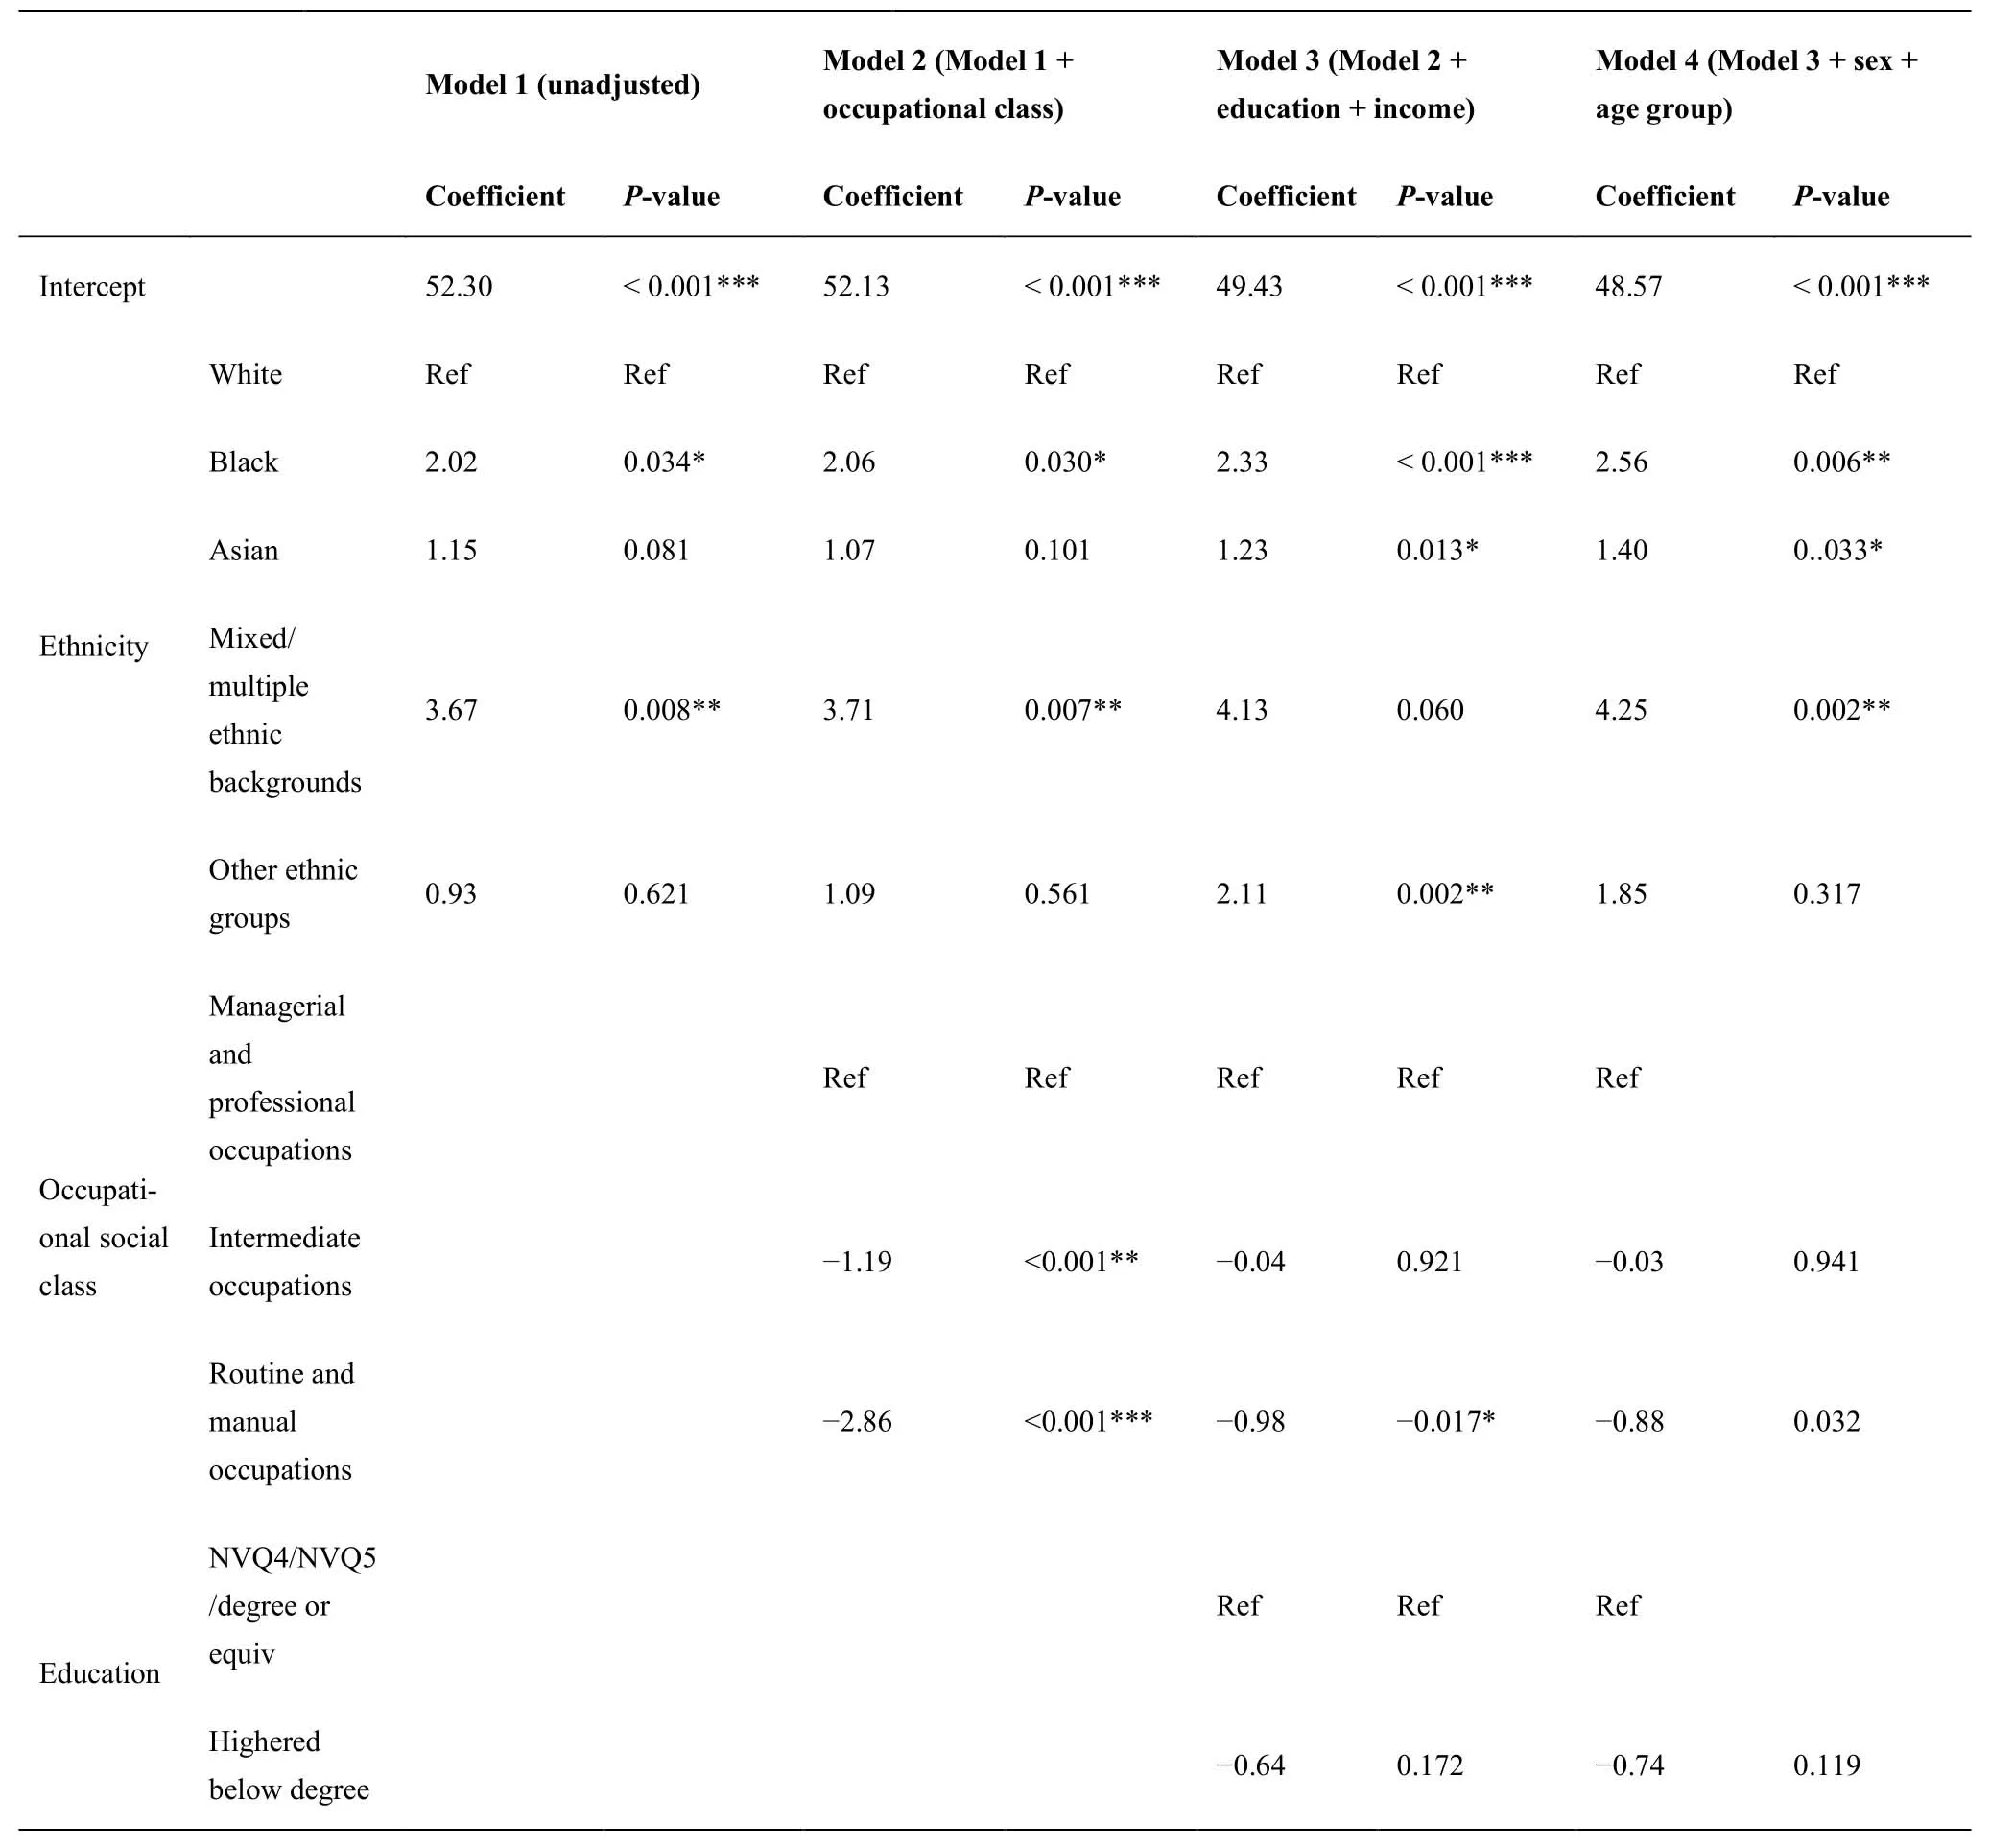
Table2 Full details on each regression model
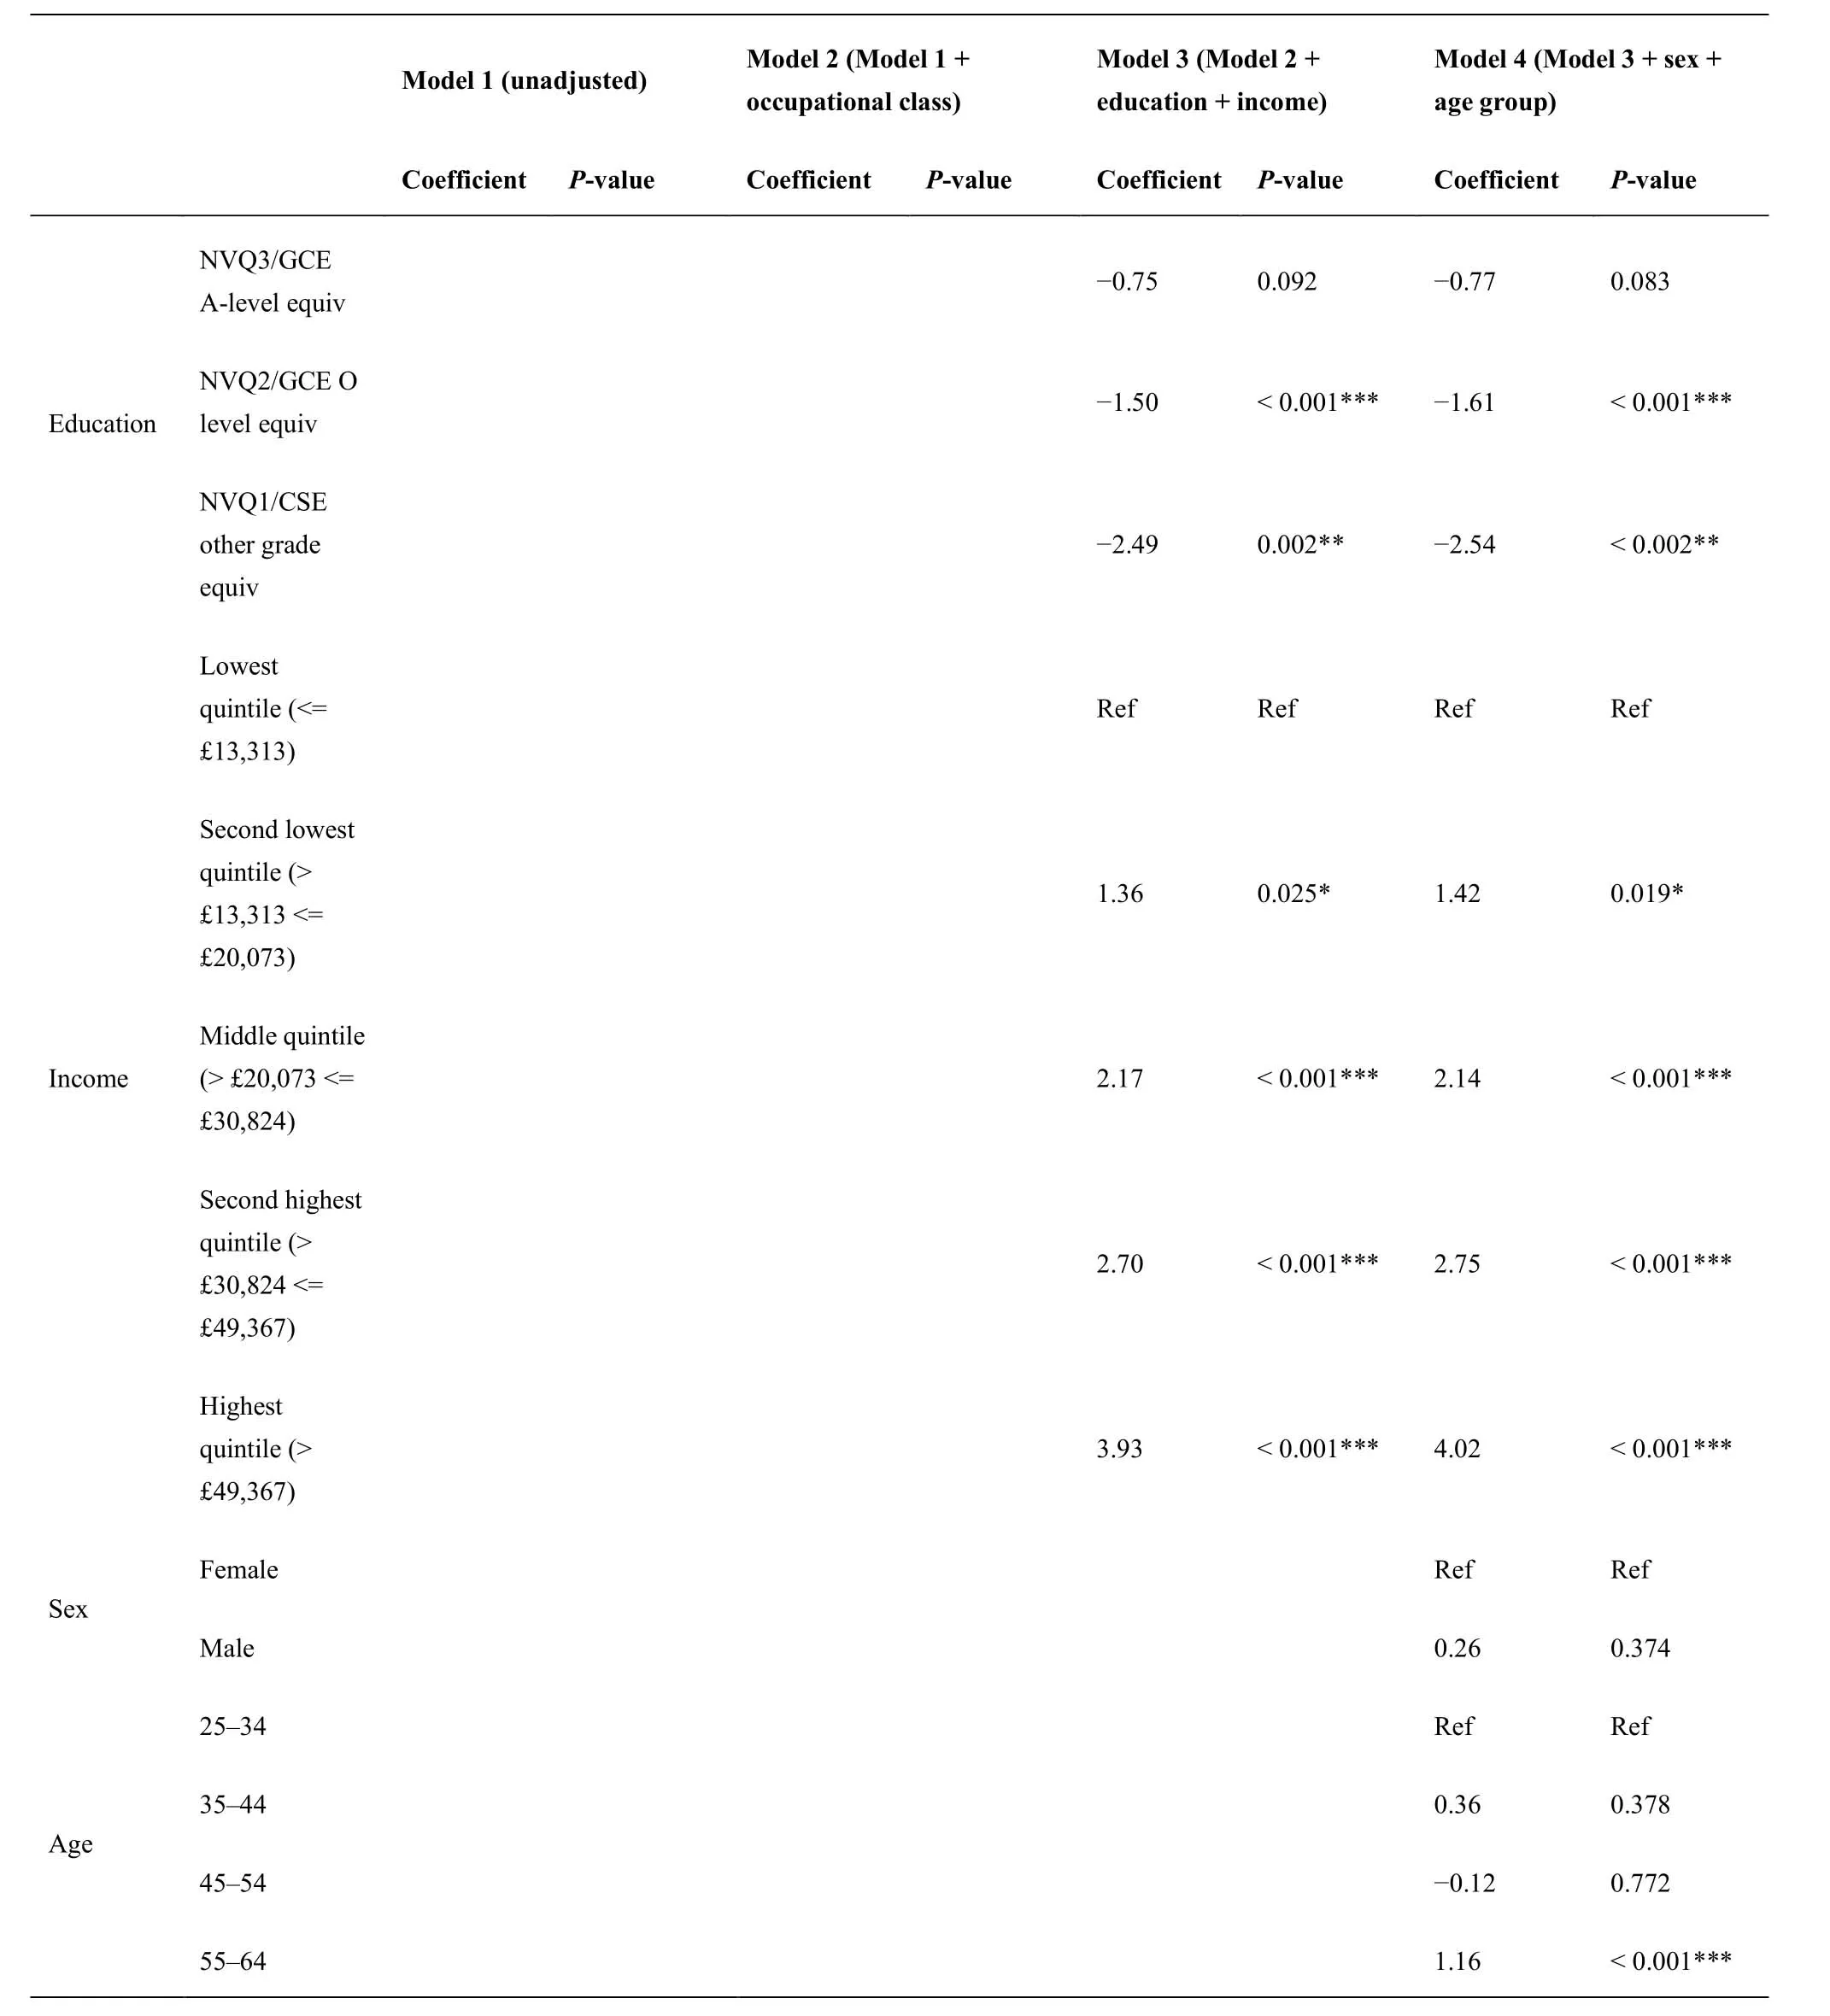
Table2 Full details on each regression model (continued)

Table3 R-squared of my regression analysis
Implications
Grey et al (2013) note that workplace leaves across allsectors are more often attributed to mental health issues amongst BME people in comparison to White people every year mostly due to the lack of culturally appropriate mental health services and absence of cultural understanding.This would lead to an increased focus on working more closely with people from BME communities for mental health service design and delivery in workplaces.While this is important,my results confirm that the White ethnicity is likely to have poorer wellbeing.Hence,in addition to present-day wellbeing support programmes,breakdown in communication and information regarding how and where to access help for this high-risk group could be beneficial.Therefore,experts note that information regarding possibilities of mental wellbeing deterioration and its causes,consequences and remedies should be shared in appropriate languages to support understanding about their health and how they can seek help [32].Periodic reviews of such services by external organizations may further help make required changes and implementations [33].
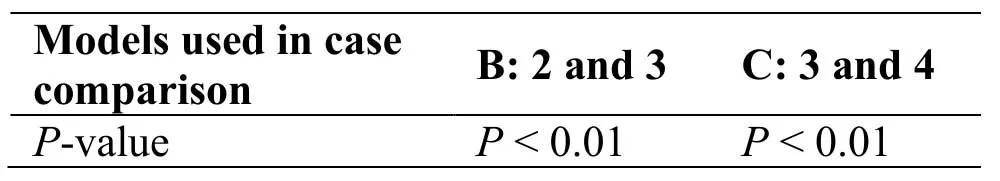
Table4 ANOVA analysis of variance
The McGregor-Smith review on race in the workplace (2017) suggests that Black and minority ethnicities including Indians and Pakistanis are more likely than White individuals to have better wellbeing in the MPOs NSSEC3 category.However,my results:the small R-squared for the interaction of ethnicity and OC(R-squared = 0.02) in Table3 and Figure3 verify that there is no significant interaction of ethnicity and OC on wellbeing scores.
Efforts are needed to better understand how more personalized,tailored approaches in employment support help and vary across occupational groups to address workplace system-level barriers surrounding high unmet mental health needs.We also need to identify ethnically tailored and culturally appropriate clinical supports and practices in different workplaces to ensure equitable and timely mental health care.The Department of Work & Pensions has tried to adopt this method by the consultations for Universal Credit principles [34].
Strengths
Current literature mostly me asures long-term mental illness [31] or perceived need [35] as the outcome while focusing on broader exposure variables:the impact of precarious work,especially those on zero-hour contracts [21],competitive work versus communitybased activities [36].Hence,ethnic and occupational differences in mental wellbeing are touched upon but largely underreported around which specific occupational classes (with certain attributes) and ethnic groups experience poor mental wellbeing on a day-today basis.As current studies measure only one aspect—either the quality of life or anxiety and depression—it is difficult to interpret the implications at an individual or organisational level and compare various kinds of interventions to improve wellbeing.I instead use WEMWBS to measure wellbeing,which is more holistic,reliable and credible in combining the aforementioned aspects with psychological functioning.It can be used with both the national and a target population help drive positive action and change.
My dissertation is one of the first pieces that specifically studies 25-64-year-old active employers from the NSSEC3 in HSE 2014-2016 as my sample population for studying the effect of OC and ethnicity on wellbeing,including their combined effect.It investigates employees’ experiences of poor mental wellbeing:I identified how the influence of income and education,combined with age and sex,could contribute to a negative cycle of disempowerment for the “Other”and “RMOs” category.
Finally,Cohen’s d and PES make evaluation easier via standardized effect sizes of each exposure and confounder variable as the scaling of each variable is irrelevant.Any variation explained by other exposures is removed from the denominator of PES,allowing us to compare the effect of the same variable across different studies even when studying different covariates.
Limitations and future work
The biggest limitation is the small ethnic group sample sizes which might not be representative of the whole of the UK.There is a need for more accurate measures of workplace conditions and/or job quality [3].NSSEC3 categorisation does not accurately and completely capture the conditions of a workplace or the nature of a job; there may be differences within each OC including different benefits systems,promotion,pay,employer treatment and so on—all of which are difficult to quantify and study.Therefore,a variable which specifically informs if job quality has directly been an attributing factor for those with poor mental wellbeing is important.While the HSE and other datasets including the Labour Force Survey collect information on basic demographics and industrial category or occupation type,I suggest that future research presents this data by ethnicity.This will help produce a robust database to explore the association between job quality,ethnicity and mental health.
I did not apply weights and used complete case analysis.Analysing only the complete cases might have led to biased estimates as those that answered the WEMWBS form,highest income and education qualification may have systematically higher incomes/education/wellbeing than those who did not answer,so the mean value of wellbeing of the complete cases could be biased.Using a non-weighted dataset means that due to nonresponse for certain variables,my sample may not be representative of the population of the UK to obtain estimates of wellbeing scores.
Furthermore,hospital accessibility and language are factors that may further skew lower education.For example,the ability to communicate with clinicians/colleagues or likelihood to see a doctor may be similar across ethnicity in MPOs or higher qualifications but not in RMOs or at low levels of education [37].
A causal relation between OC and wellbeing or ethnicity and wellbeing could not be identified due to the study’s cross-sectional design and as regression analysis can only capture correlation,not causation.Accordingly,future work should incorporate longitudinal findings to discern the temporal order of the effect of ethnicity and occupational class on wellbeing.
Furthermore,the cross-sectional methodology meant the time at which events across were not available as well as the routes that led to poor mental wellbeing (e.g.strict supervision,time pressure,office politics).These factors would offer more detail and identify subgroups amongst employee occupational categories,offering a clearer picture of the factors in action.
In addition,I did not account for depression (noted in HSE via “whether reported ever experienced depression,including postnatal depression) as it was not available consistently for every cohort.Depression that is diagnosed prior is often sighted as more prevalent in managerial and professional occupations and is associated with a risk of poor mental wellbeing [38].
Future study should study whether the interaction of ethnicity and OC had a significant effect on wellbeing after accounting for covariates as I did not.My study did not study the extent to which the wellbeing/OC or wellbeing/ethnicity relationship is confounded by health behaviours such as diet,physical activity,alcohol consumption and smoking even though they are commonly associated with poor mental wellbeing and socioeconomic disadvantage [11].This was because some of these measures were either not available in each HSE cohort,were inconsistently recorded or the exploration of these factors was outside the bounds of this study due to time constraints.The absence of analysing such health behaviours meant that I am not able to offer an evidenced,comprehensive explanation of the pathways that result in poor mental wellbeing amongst these OCs.For some other potential covariates such as household tenure that I would have liked to consider,the variations between years were too complicated to merge into a purposeful variable.
It may be useful to supplement the results with a qualitative study.Workplace/work industry dynamics are complex and so the methods through which they affect mental wellbeing may be hard to gather via predetermined quantitative measures.
Moreover,further research is necessary for identifying the main triggers of poor mental wellbeing in workplaces for each ethnicity within each occupational category.For example,a nurse belongs to the IOs category regardless of whether one is a nurse at a hospital or at a school for dealing with accidents and emergencies.However,the difference in workplace settings has important associations with wellbeing outcomes for employees by ethnicity and gender as proven above.Hence,further analysis of the role of a workplace setting is imperative.
Using NSSEC5 or NSSEC8 would give a further breakdown of the OC and can allow us to better explore distinct correlations between the different OCs and wellbeing for each ethnicity.
Conclusion
Findings from my dissertation indicate that OC and ethnicity are significant predictors of mental wellbeing.Unlike OC,ethnicity remained strongly correlated with wellbeing after accounting for income,education,age and sex covariates.All covariates barring age were significant confounders in the association of both exposure variables with wellbeing.The interaction of ethnicity and OC did not have a significant effect on wellbeing.The groups with the lowest wellbeing scores are:White,female,45-54 years,lowest income quintile and those educated only to “NVQ1/CSE other grade equivalent” level.The results indicate that workplaces across the NSSEC3 groups for RMOs and those with“White” employees should tailor support to meet individuals’ wellbeing concerns,including appropriate communication channels and wellbeing-specific healthcare accessibility,as they have the lowest mean wellbeing scores.
- Life Research的其它文章
- Science in Chinese medicine
- Artificial intelligence and the future of medicine:a multidimensional analysis
- Growth retrieval of stressed bacterial cells:logic and contradictions
- Amyloid beta peptides,tau protein acetylation and therapeutic strategies for treating Alzheimer’s disease:a review
- Aqueous wood-ash extract of Parkia biglobosa causes reproductive toxicity in female mice
- Tear and serum electrolyte concentrations as a biomarker in primary glaucoma subjects