Physical properties and phase diagram of NaFe1-xVxAs*
Guang-Yang Dai(代光阳), Xin He(何鑫), Zhi-Wen Li(李芷文), Chang-Ling Zhang(张昌玲),Lu-Chuan Shi(史鲁川), Run-Ze Yu(于润泽), Xian-Cheng Wang(望贤成),†, and Chang-Qing Jin(靳常青),3,‡
1Institute of Physics,Chinese Academy of Sciences,Beijing 100190,China
2University of Chinese Academy of Sciences,Beijing 100190,China
3Materials Research Laboratory at Songshan Lake,Dongguan 523808,China
Keywords: iron based superconductor,“111”type NaFeAs,V doping,phase diagram
1. Introduction
The discovery of the superconducting LaO1-xFxFeAs[1]with transition temperature (TC) of 26 K has attracted great interest in the condensed matter physics field. Soon after this discovery, the TCwas quickly enhanced to a maximum of 55 K by replacing La with Sm atoms.[2]Subsequently,several new families of iron-based superconductors were discovered successively, such as 122-type (Ba, K)Fe2As2,[3]111-type LiFeAs,[4]and 11-type FeSe.[5]The parent compounds of most iron-based superconductors generally undergo a tetragonal-to-orthorhombic structural transition and a spin density wave (SDW) transition from paramagnetic to antiferromagnetic state at low temperature. By chemical doping or applying pressure, the structural and SDW transitions can be suppressed and then superconductivity is induced or enhanced.[6–14]
The parent compound NaFeAs,as a member of the“111”family,exhibits a structural transition at TS=52 K and a SDW transition at TSDW=41 K, respectively.[15]So far, the doping effects on the superconductivity via the substitution of Fe in NaFeAs by Co,[13]Cu,[14]Ni,[16,17]and Rh[18]atoms have been investigated, which are considered to introduce electrons into NaFeAs. With the increase of doping level x in NaFe1-xTxAs (T denotes Co, Ni, Cu, and Rh), the structural/SDW transitions are gradually suppressed and dome-like doping dependence of TCis observed. For Co-doping, the maximum TCis 21 K with the optimal doping level x=0.028.The Rh doping effect on the superconductivity of NaFeAs is almost identical to that of Co doping, and the doping effect of Ni is double that of Co if the doping level is fixed. While for the dopant Cu, the optimal TCis 11.5 K, which is much smaller than that of Co doping. Except for the electronic doping,however,there is little research about the hole doping effect on NaFeAs and a hole-doped phase diagram for NaFeAs is still lacking. The doping effect of V has been investigated in LiFeAs,[19]which suggests that V dopants introduce hole carriers. What is more, the V dopants act as strong scattering centers and give rise to the rapid suppression of superconductivity for LiFeAs. In this work, we report the study of V doping effect on NaFe1-xVxAs system. A phase diagram of NaFe1-xVxAs is obtained. It is shown that V doping has a small effect on the structural and SDW transitions,while in a very narrow doping range the TCis enhanced and then suppressed quickly,displaying a small superconducting dome. It is speculated that the strong scattering effect of V impurities dominates the suppression of TC.
2. Experimental details
High-quality single crystals of NaFe1-xVxAs have been grown using the self-flux method. The precursors of Na3As and Fe1-xVxAs were first prepared using the solid state reaction method.Na3As was synthesized by sintering Na and As at about 600◦C for 10 h in a Ti tube filled with Ar atmosphere.Fe1-xVxAs was prepared by mixing Fe, V, and As powders,the mixture was sealed into an evacuated quartz tube and heating to 1100◦C for 20 h. Then the Na3As,Fe1-xVxAs,and As powders were mixed with the ratio of Na3As:Fe1-xVxAs:As=1:0.9:1.1. The mixture was put into an alumina oxide tube and subsequently sealed in a Nb tube and placed in an evacuated quartz tube. The quartz tube was heated to 950◦C for 20 h and then slowly cooled down to 650◦C at a rate of 3◦C/h to grow single crystals.The crystals with typical size of 4×4×0.1 mm3can be obtained. To protect the samples from reacting with air or water,all the synthesis processes were carried out in high-purity Ar atmosphere.
The single crystals were characterized by x-ray diffraction (XRD) in the 10◦–70◦range on a Philips X’pert diffractometer using Cu Kα radiation generated at 40 kV and 40 mA.The actual chemical compositions of NaFe1-xVxAs single crystals were determined by energy dispersive x-ray spectroscopy (EDX). The electrical resistance was measured by a physical property measurement system (PPMS) using the four-probe method. The DC magnetic susceptibility was measured using a superconducting quantum interference device(SQUID). The measurement of specific heat was performed from 2 K to 60 K using PPMS.
3. Results and discussion


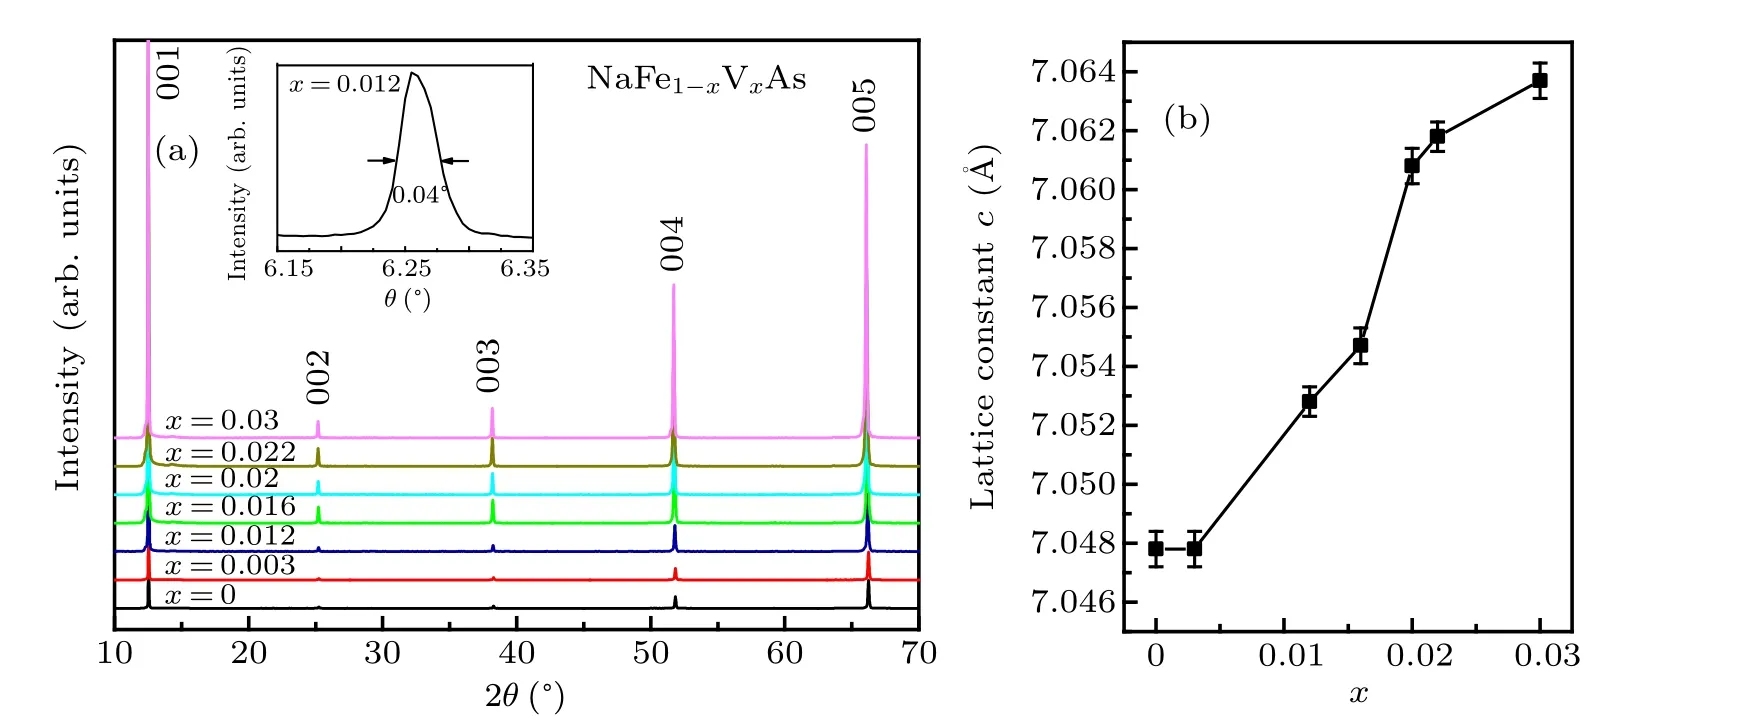
Fig.1. (a)XRD pattern of NaFe1-xVxAs single crystals,the inset shows the FWHM of about 0.04◦. (b)The lattice parameter c plotted as a function of the V concentration x.

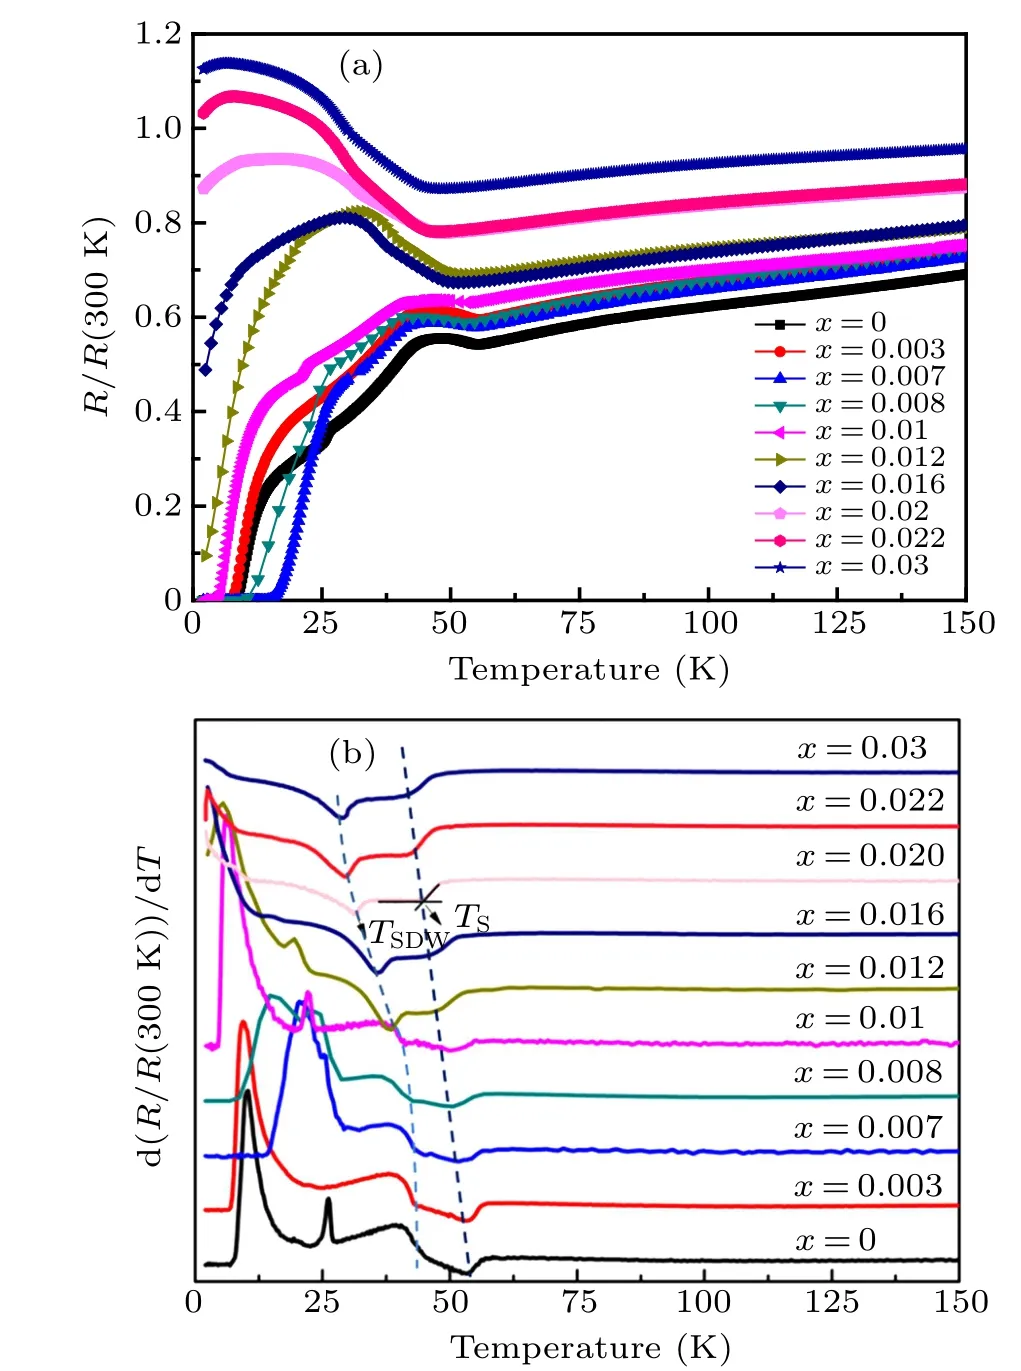
Fig.2. (a)The normalized resistance R/R(300 K)as a function of temperature for the NaFe1-xVxAs single crystals. (b)The derivative resistance for NaFe1-xVxAs single crystals,where TS and TSDW are marked with arrows.

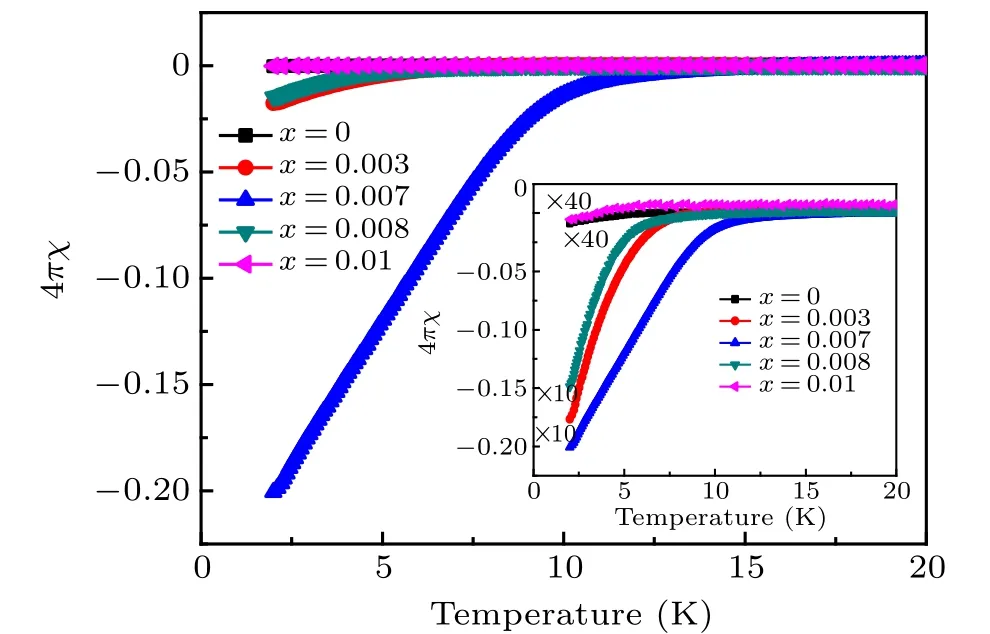
Fig. 3. Magnetic susceptibility taken at 30 Oe in ZFC mode for the superconducting samples. The inset shows the susceptibility data multiplied by some factors.
Beside the superconductivity we can explore the evolution of the structural and magnetic transitions when varying the V-doping level. The temperature derivatives of the resistances for NaFe1-xVxAs samples are plotted in Fig. 2(b).The two distinct features marked by the arrows are used to determine the temperatures of structural transition TSand SDW transition TSDW.[13]It is clearly seen that both TSand TSDWshift towards low temperature when V is doped. When x is 0.03,TSis suppressed to 42 K and TSDWabout 29 K.We can also determine the TSand TSDWvalues from the specific heat data, as seen in Fig. 4. For the 1.2%-V sample there are two kinks at 52 K and 40 K, which correspond to the structural transition and SDW transition,respectively. From the temperature derivative of the specific heat data for 2.2%-V sample we can define TS~45 K and TSDW~31 K, as shown in the inset of Fig. 4. The transition temperatures defined from the specific heat data agree well with the result of the resistance data.

Fig. 4. Temperature dependence of the specific heat C/T of NaFe1-xVxAs with x=0.012 and 0.022 between 2 K and 60 K, the arrows point to the anomalies in the specific heat. The inset shows the derivative of the specific heat for the crystal with x=0.022.
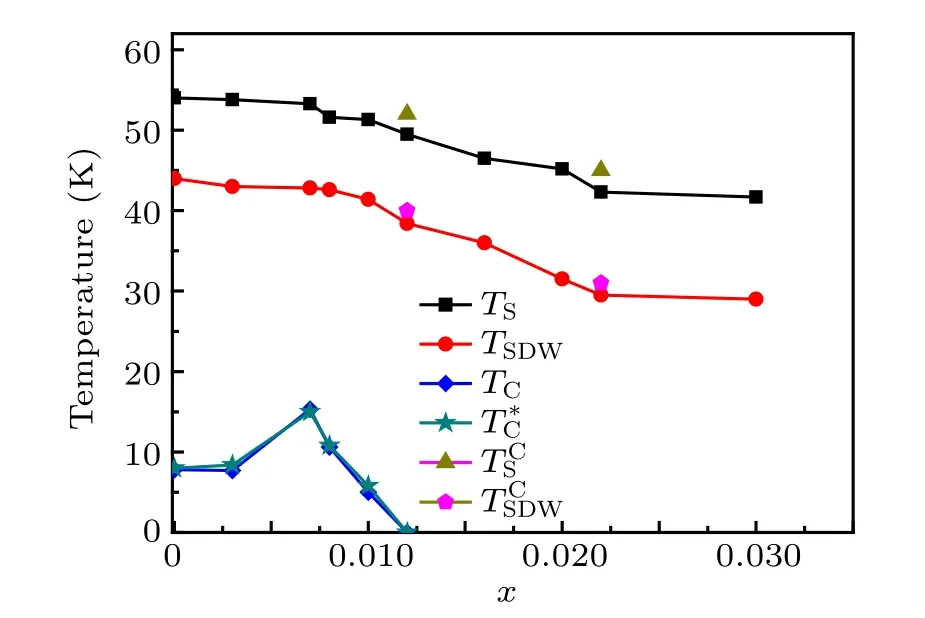
Finally, we plot the phase diagram of NaFe1-xVxAs based on the data of resistance, magnetic susceptibility, and specific heat, as shown in Fig. 5. With the increase of the Vdoping level,both the structural and SDW transitions are gradually suppressed. At the same time,TCincreases to the maximum value of ~15 K at the optimal doping level x=0.007 and then decreases rapidly to zero when x is 0.012. We can make a comparison of V-doping behavior in iron based superconductors with other 3d transition metal doping. The Co-doping and Ni-doping are usually considered to introduce electrons into the system and TCseems to be mainly related to the doped electron count. The substitution of one Fe atom by Co (Ni)atom would introduce one(two)extra electrons,which means that Ni-doping has the doubled effect of Co-doping if the doping level keeps the same. For Cu-doping, although it does introduce electron carriers into the system, the impurity scattering effect plays an important role on TCsuppression. Moderate Cu-doping,such as x ~0.033 for NaFe1-xCuxAs[14]and x ~0.13 for LiFe1-xCuxAs,[20]can cause a crossover from metallic state to semiconducting one due to Anderson localization, which suggests that Cu impurities are strong scattering centers and would suppress TCvia destroying the Cooper pairs. While V-doping effect is only studied systematically in LiFeAs system. Contrast with Co, Ni, and Cu, hope carriers are introduced into LiFeAs by V-doping. In addition, V impurities are proved to be magnetic and have stronger electron scattering ability than Cu impurities, which is the cause that TCis suppressed with a much larger rate of 7 K per 1%-V[19]than the rate of 1 K per 1%-Co[21]and 1.9 K per 1%-Cu[20]in LiFeAs system. Here,both TCand shielding fraction of NaFe1-xVxAs are enhanced when 0.7%-V is doped, suggesting that V-doping introduces hole carriers into NaFeAs.However, TCdecreases rapidly after the optimal doping level of 0.007 and disappears completely at x=0.012,from which the TCsuppression rate can be calculated to be about 30 K per 1%-V in NaFeAs system. For the Co-doped NaFeAs system,the optimal doping level is 3%with the maximum TC~21 K and TCdecreases to zero when the doping level is about 10%.That is, the TCis suppressed with a rate about 3 K per 1%-Co in NaFe1-xCoxAs system. The suppression rate can also be coarsely calculated from the superconducting phase diagram of NaFe1-xCuxAs to be ~5.5 K per 1%-Cu. The large suppression rate of TCby V doping means that the magnetic impurity scattering effect dominates the suppression of TCin NaFeVAs. In addition,the structural and SDW transitions are only slightly suppressed by V-doping if compared with that of Co- or Cu-doping. The effect of V-doping on structural and SDW transitions in NaFeAs is similar to the behavior of Crdoping in BaFe2As2system.[22]

Fig. 5. Phase diagram of NaFe1-xVxAs. TS, TSDW, and TC are determined from the resistance,T*C is determined from the magnetic susceptibility,TCS and TCSDW are determined from the specific heat.
4. Conclusion
In summary, we have grown a series of NaFe1-xVxAs single crystals to study the V-doping effect on the superconductivity of NaFeAs via resistance, magnetic susceptibility, and specific heat measurements. The phase diagram of NaFe1-xVxAs was obtained. V doping has a small effect on the structural and magnetic transitions. TCincreases from~8 K of the parent NaFeAs to the maximum value of ~15 K at the optimal doping level x = 0.007, and then decreases rapidly to zero when x=0.012. TCis suppressed with a large rate about 30 K per 1%-V in NaFeAs system,which suggested that V impurities act as strong scatter centers.
- Chinese Physics B的其它文章
- Two-dimensional finite element mesh generation algorithm for electromagnetic field calculation*
- Stable water droplets on composite structures formed by embedded water into fully hydroxylated β-cristobalite silica*
- Surface active agents stabilize nanodroplets and enhance haze formation*
- Synchronization mechanism of clapping rhythms in mutual interacting individuals*
- Theoretical study of the hyperfine interaction constants,Land´e g-factors,and electric quadrupole moments for the low-lying states of the 61Niq+(q=11,12,14,and 15)ions*
- Ultrafast photoionization of ions and molecules by orthogonally polarized intense laser pulses: Effects of the time delay*

