
Optical conductivity of twisted bilayer graphene near the magic angle*
2021-01-21 02:08:20LuWen文露ZhiqiangLi李志强andYanHe贺言
Chinese Physics B 2021年1期
关键词:志强
Lu Wen(文露), Zhiqiang Li(李志强), and Yan He(贺言)
College of Physics,Sichuan University,Chengdu 610064,China
Keywords: graphene,moir´e superlattice,magic angle,optical conductivity
1. Introduction
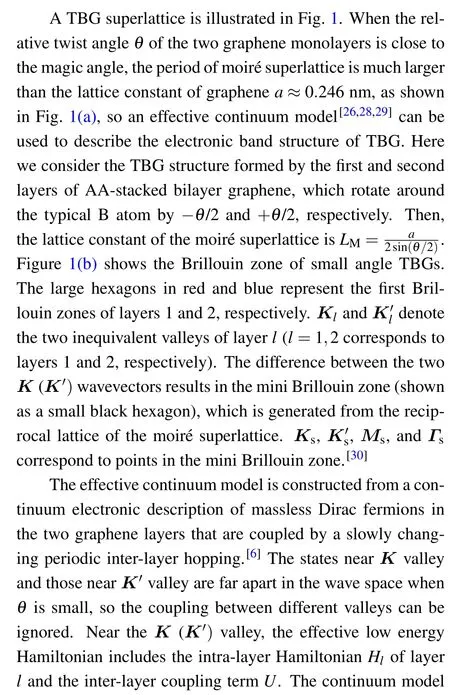
The various van der Waals heterostructures assembled from two-dimensional(2D)materials offer a unique platform combining many novel physical properties.[1–4]The high level of interest in 2D materials, combined with capabilities in device fabrication and experimental techniques, has led to an outburst of activity over the past few years. One of the simplest heterostructures is twisted bilayer graphene (TBG),which consists of two graphene layers rotationally stacked at an arbitrary angle θ to each other. At a small θ, a hexagonal long-period moir´e interference pattern consisting of alternating AA- and AB-stacked regions emerges, owing to a slight difference in the lattice orientation. When the twist angle θ is close to the‘magic’angle near 1.10◦,[5]the electronic band structure becomes flat around the Dirac point at zero energy due to interlayer coupling.[6]The magic angle TBG has gained increased attention in theory and experiment in the last few years owing to its novel electronic properties. Recent studies on magic-angle TBG have discovered correlated insulating phases with similarities to Mott insulator systems,[7]as well as strongly coupled superconducting states in ultra-flat bands close to half-filling.[8,9]Furthermore, other intriguing quantum phenomena have been observed in magic-angle TBG,such as the quantum anomalous Hall effect (QAHE).[10–14]These results make it possible to experimentally investigate both electronic correlations and topological phenomena in 2D van der Waals heterostructures.
Spectroscopic studies of electronic phenomena are critical to explore the physical properties in graphenebased systems.[15,16]Optical spectrum can provide critical information about the electronic band structure,[17,18]many-body interactions,[19,20]quasiparticles,[21]and collective excitations[22]in graphene systems. Moreover,graphene is very promising for applications in optics[23]and optoelectronics[24]due to its unique mechanical,electric,magnetic, and thermal properties. A multitude of exciting applications of graphene, such as novel optical devices and photodetectors, are being vigorously pursued by academia and industry.[25]
Previously, the optical conductivity of TBG heterostructures has also been considered. Koshino et al.[26]systematically investigated the conductivity spectra of TBG with a variety of large rotation angle θ (from 1.47◦to 30◦). Bascones et al.[27]studied the effect of symmetry breaking states on the optical response, focusing on the incident photon energy range below 50 meV(corresponding wavelength λ ≈25 μm).Our results highlight the optical conductivity of magic-angle TBG across a broader spectral range considering the effects of lattice relaxation, which is complementary to previous reports. In addition,another notable disagreement with previous results is that our results are more directly relevant to the experiment. At present, the area with uniform twist angle θ in TBG samples is only 3–5 μm in size or even smaller, due to the constraints of device fabrication and experimental technology, which is about ten times smaller than the wavelength of an incident photon(about 25 μm)in Ref.[27]. Therefore,limited by the size of the TBG samples,it is difficult to compare the theoretical results of Bascones et al. with the experimental measurements in the short term. In this paper,we calculate the conductivity spectrum of TBG in the energy region from 0 to 1.0 eV and discuss in greater detail the very strong peaks in the frequency range from 0 to 0.4 eV(corresponding wavelength λ ≈3 μm)in the optical conductivity spectra. Thus,our calculation results show the optical conductivity with higher incident energy(narrower incident wavelength),which can provide some reliable information for the experimental measurement of real TBG samples with small twist angle.
Here, we study the low-energy band structure of TBGs at a series of small rotation angles θ around the magic angle based on an effective continuum model. The optical conductivity spectra are calculated based on the Kubo formula. At such small angles,the lattice structure of TBG spontaneously relaxes to minimize the energy of the structure, leading to a significant modification in band structures. The dependence of different peaks in the optical conductivity spectrum on the rotation angle θ and lattice relaxation effect is fully explored.We study in detail how the van Hove singularities in DOS are related to different interband transitions. Our results show that optical measurements are essential for studying the band structure and lattice reconstruction in TBG.
2. Theoretical model
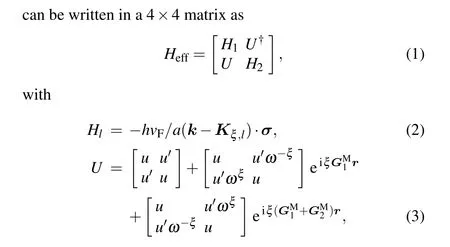
in the Hlterm, vFis the band velocity of the Dirac cone, h is the Planck constant, we take hvF/a=2.1354 eV,[26]σ is the Pauli matrices, k is the two-dimensional Bloch wave vector,taken value from the moir´e Brillouin zone,ξ =±1 labels the K and K′valleys,and Kξ,ldenotes the location of the Dirac cone. In the U term, ω =ei2π/3, GMlis the reciprocal lattice vectors for the moir´e superlattice,r is measured from the center of rotation in real space,u and u′are terms that describe the interlayer coupling.
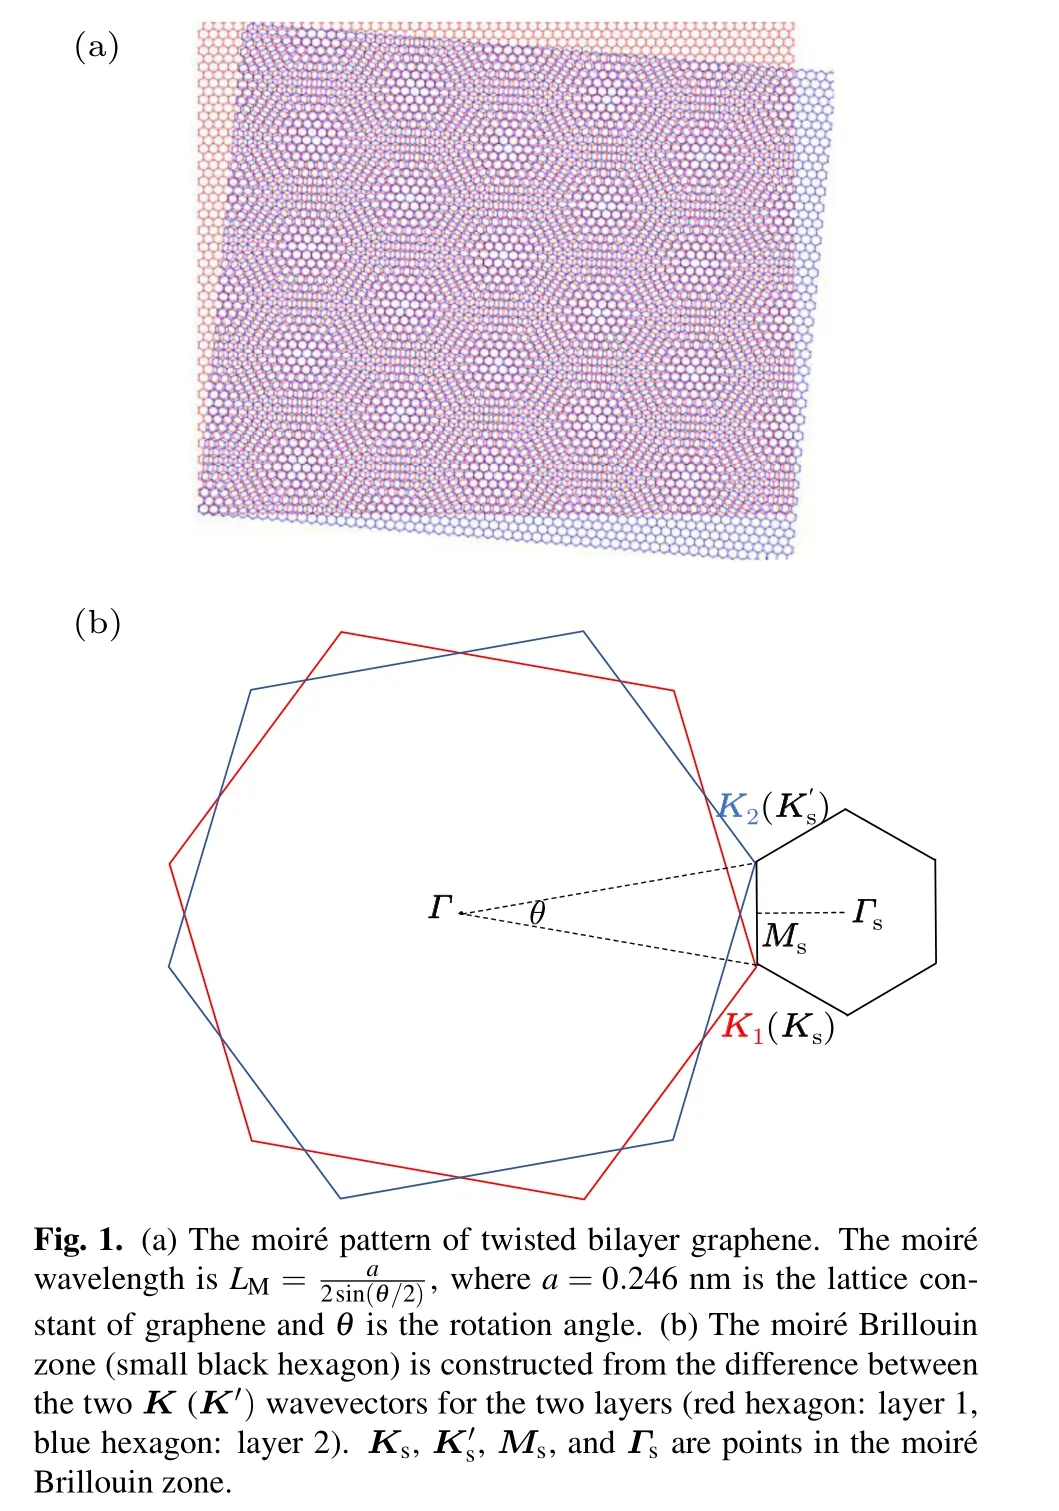
For unrelaxed TBG systems where the two graphene layers are rigidly rotated relative to each other, the atomic registry changes continuously within the moir´e period between four different stacking configurations AA, AB, BA, and saddle point (SP), as illustrated in Fig. 1(a). For this case, one can use u=u′=110 meV[5]in the continuum model. In practice, however, in the small-twist regime, the competition between the van der Waals interlayer interaction and the elastic energy at the interface can lead to a significant relaxation of the lattice structure to reduce the area of the AA region with high stacking energy.[31–37]The relaxed lattice forms an array of triangular domains with alternating AB- and BA-stacking regions.[38,39]Moreover, the lattice relaxation causes corrugation in the out-of-plane direction with increased vertical separation between the AA regions compared to that in AB regions.[31]The effects of the lattice relaxation can be taken into account by using u=0.0797 eV and u′=0.0975 eV[29]in the effective continuum model,as shown previously.
Using the eigen-wave functions obtained from the effective continuum model,Eq. (1),the optical conductivity σ(ω)of TBG can be calculated by the Kubo formula
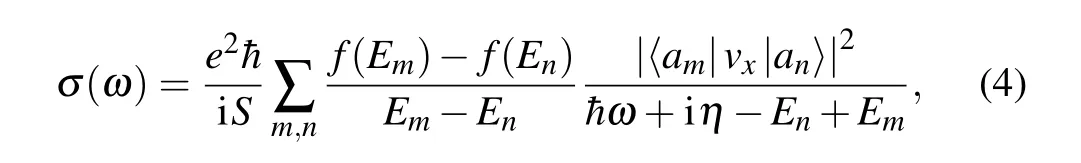
where e represents the elementary charge,is the reduced Planck constant,S is the area of the system in real space, f(E)is the Fermi distribution function, Em(En) and |am〉(|an〉 are the eigenenergy and eigenstate of the system obtained by solving the Hamiltonian, vxrepresents the velocity operator, η is the phenomenological broadening,which is 0.003 eV,[26]andω is the incident photon energy.
3. Results and discussion
Based on the effective continuum model described above,we calculate the electronic band structure of relaxed (black solid lines)and unrelaxed(red dashed lines)TBGs at three rotation angles θ (1.05◦,1.10◦,and 1.16◦,respectively)close to the magic angle, as shown in Fig. 2. Here, the path of band structures is along the line Ks–Γs–Ms–K′sin the moir´e Brillouin zone scheme,and the origin of the band energy axis(the band energy E =0 eV)is set to the charge neutral point. Regardless of lattice reconstruction, a set of flat bands appears at the Dirac point due to the competition between the kinetic energy and the interlayer hybridization energy. For unreconstructed TBG, the flat bands are confined to within about 15 meV, and the bandwidth decreases with the increase of twist angle θ.However,under the influence of lattice relaxation,the flat bands near the Dirac point are obviously gapped from the high energy bands in both the electron side and the hole side.The size of such gaps is dependent on the twist angle θ,which appears to be minimum (about 10 meV)at θ =1.05◦among the three rotation angels(Fig.2(a)). In addition,the lattice reconstruction also has a great influence on the band velocity in the flat bands. The lowest energy bands at the Dirac point in the reconstructed TBGs are significantly flattened compared to the unrelaxed TBGs at the same angle.
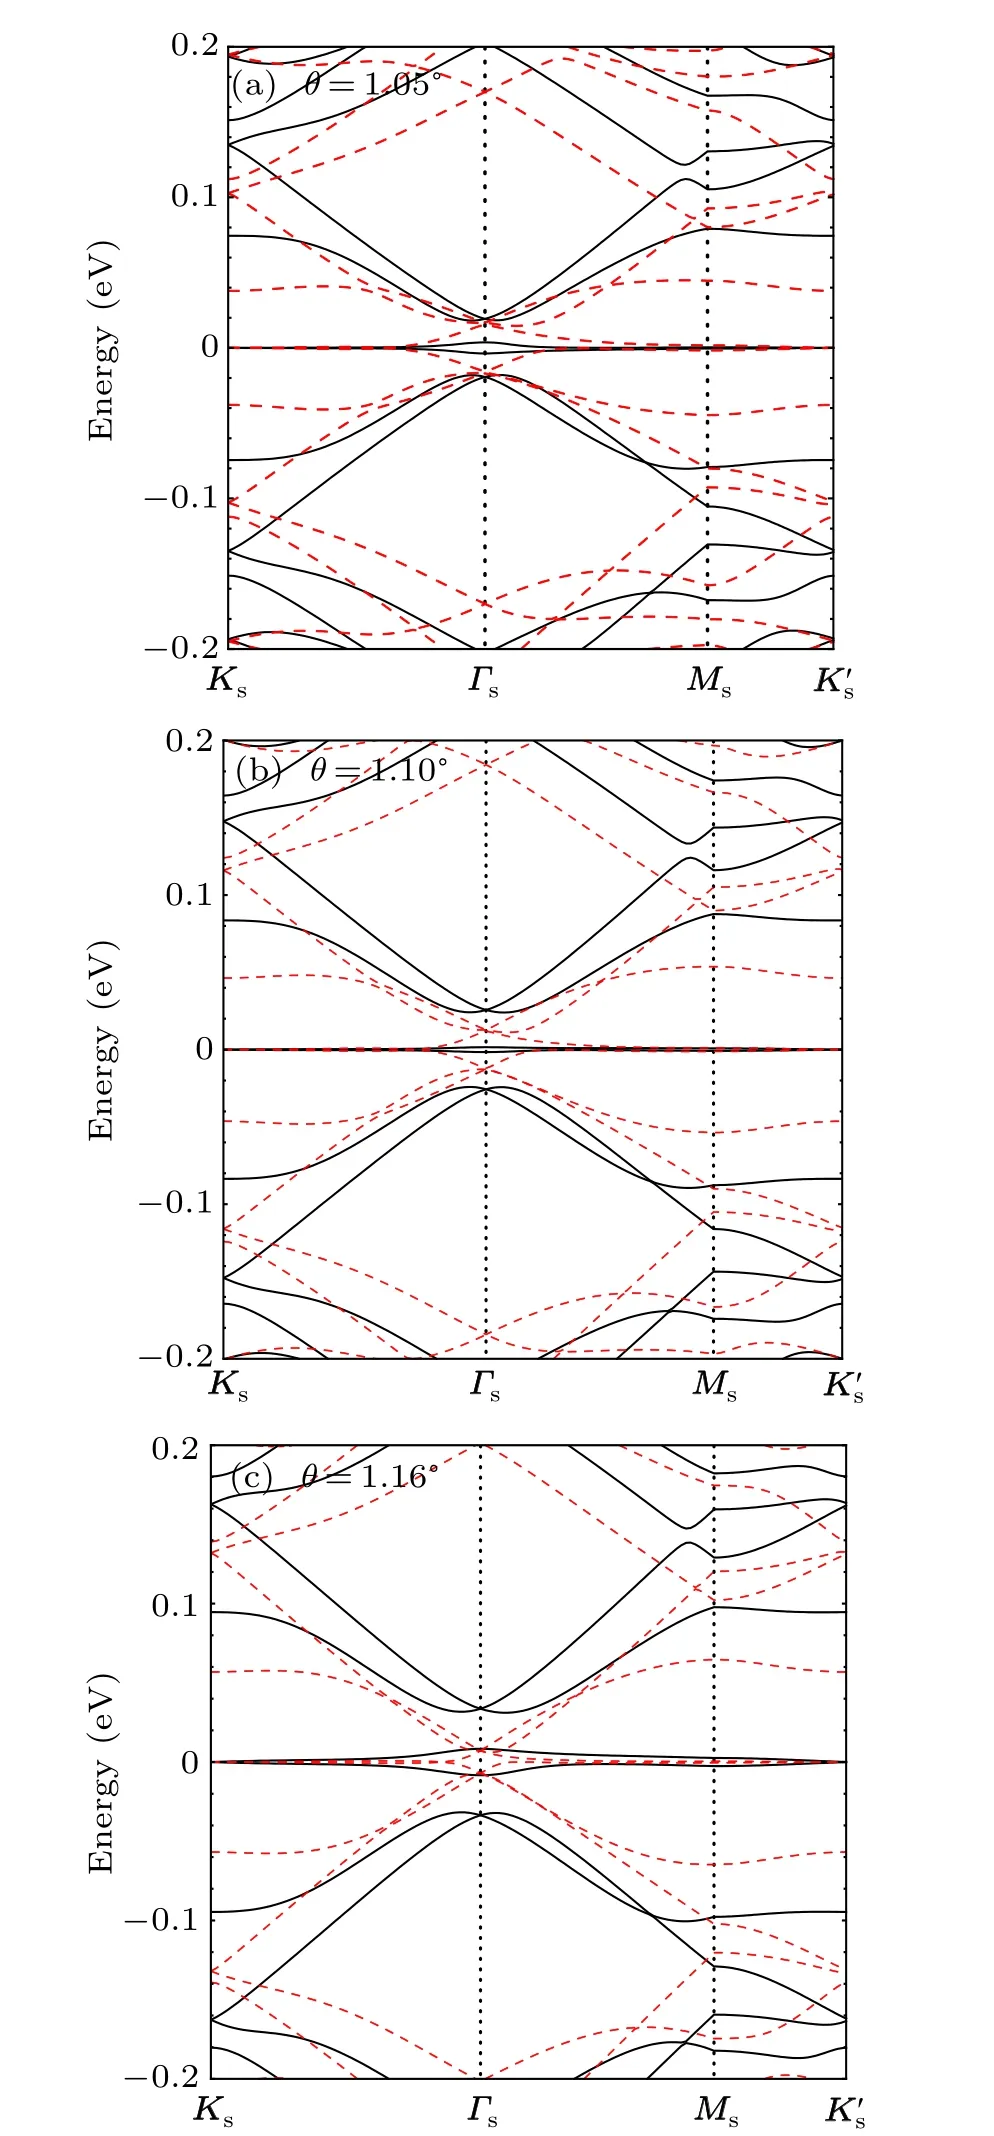
Fig.2. Band structure of relaxed(black solid lines)and unrelaxed(red dashed lines) TBGs at various rotation angles closed to the magic angle(near 1.10◦): (a) 1.05◦, (b)1.10◦, and (c)1.16◦. The path of band structures is along the line Ks–Γs–Ms–K′s in the moir´e Brillouin zone scheme,and the Dirac point energy is set to 0 eV.

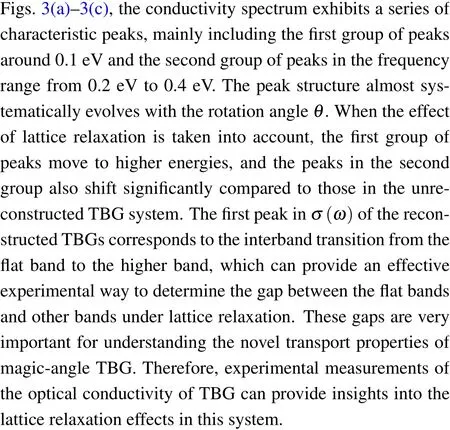

Fig.3. The conductivity spectrum of relaxed(black solid lines)and unrelaxed(red dashed lines)TBGs with(a)θ =1.05◦,(b)θ =1.10◦,and(c)θ =1.16◦.
Figure 4 shows the band structure, DOS, and the optical conductivity of relaxed TBG with θ =1.05◦. The black solid line(red dashed line)represents the energy bands of the K (K′) valleys in Fig. 4(a). In Figs. 4(a) and 4(b), each characteristic saddle point of the band structure is corresponding to a van Hove singularity in the DOS. The sharp peaks in the optical conductivity spectrum(Fig.4(c))are associated with optical transitions involving the van Hove singularities in the DOS (Fig. 4(b)). For instance, a peak numbered 1○near E =0.02 eV in Fig. 4(c) corresponds to the interband transition from the highest valence band to the second conduction band, as indicated by the magenta arrow in Fig. 4(a). Moreover,the major peaks labeled 1○–7○in the optical conductivity in Fig.4(c)can be assigned to transitions between different bands labeled by arrows in Fig.4(a). There are also unmarked interband transitions from the other valence bands to the flat band in Fig.4(a),which are similar to the transitions indicated by red arrows due to the electron-hole symmetry in the effective continuum model.
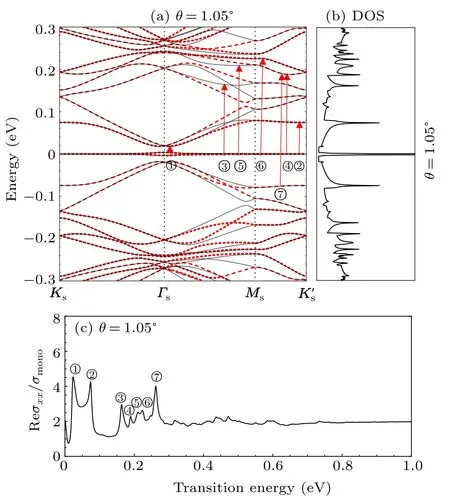
Fig. 4. (a) Band structure, (b) density of states (DOS), and (c) conductivity spectrum of relaxed TBG with θ =1.05◦. The black solid line (red dashed line)represents the energy bands of K (K′)valleys. Red solid arrows labeled 1○– 7○in(a)represent interband transitions corresponding to the major peaks numbered 1○– 7○in the conductivity spectrum in(c).
Figure 5(a) shows the optical conductivity of TBG with rotation angle θ =1.05◦,in the presence of lattice relaxation,for different values of the electronic filling. Figure 5(b)is the enlarged plot of the energy region from 0 to 0.1 eV in Fig.5(a).The black solid line and red dashed line represent the conductivity for the Fermi energy level at the charge neutrality point(CNP)and full(or empty)flat bands, respectively. As shown in Fig. 5(a), at high energies, the peak energies are similar for different values of the electronic filling in the conductivity spectra. Remarkably,in Fig.5(b),the first group of peaks for the full(or empty)flat bands move significantly towards lower energies, and at the same time, the Drude peak at zero frequency disappears compared to the chemical potential of the undoped system μCNP. Next, to fully understand the dependence of the optical conductivity on rotation angle θ,we also calculate the conductivity of the relaxed TBG with rotation angle θ =1.20◦and 0.80◦as shown in Fig. 5(c), and larger angles were described in detail in Ref.[26]. Figure 5(c)shows that the peak energies evolve systematically with the twist angle θ,so they can be used as fingerprints to identify the twist angle.Especially,for the conductivity of TBG with θ =0.80◦,the first group of peaks degenerate into only one strong peak compared to that of TBGs with other larger twist angles.

Fig.5. Fig.5. (a)The optical conductivity of relaxed TBG at θ =1.05◦for the Fermi energy level at the CNP (black solid lines) and full (or empty) flat bands (red dashed lines). (b) The enlarged plot of the energy region from 0 to 0.1 eV in (a). (c) The optical conductivity of relaxed TBGs with various rotation angles. The curves are relatively shifted to make the plot clear.
4. Conclusion
We have theoretically studied the electronic band structure and optical conductivity spectrum of TBGs at various rotation angles in the vicinity of magic angle, and explored the effects of lattice relaxation. We have shown that a series of characteristic peaks in the conductivity spectrum is related to the van Hove singularities in the DOS,which enables us to extract a lot of important information about interband transitions and band structure. When lattice relaxation effects exist, the gaps between the flat bands and other bands in magic-angle TBG can be quantitatively studied according to the lowest energy peak in the conductivity spectrum by optical measurements. Such gaps are very important for understanding the novel transport properties of magic-angle TBG. In addition,the peaks in the conductivity spectrum shift significantly under the effect of lattice reconstruction. Our study paves the way for exploring the physics of TBG with optical techniques.
猜你喜欢
中国图书评论(2022年12期)2022-12-26 09:32:46
关东学刊(2022年5期)2022-10-21 02:28:42
小学生学习指导(中年级)(2021年11期)2021-11-30 02:17:50
延河(下半月)(2021年7期)2021-08-10 02:40:16
江苏安全生产(2020年3期)2020-04-21 05:44:12
海峡姐妹(2019年4期)2019-06-18 10:39:00
宝藏(2018年12期)2019-01-29 01:50:50
Acta Mathematica Scientia(English Series)(2018年3期)2018-07-23 08:41:42
Journal of Meteorological Research(2015年5期)2015-11-21 11:23:19
中华奇石(2014年12期)2014-07-09 18:30:22
- Chinese Physics B的其它文章
- Numerical simulation on ionic wind in circular channels*
- Interaction properties of solitons for a couple of nonlinear evolution equations
- Enhancement of multiatom non-classical correlations and quantum state transfer in atom–cavity–fiber system*
- Protein–protein docking with interface residue restraints*
- Effect of interaction between loop bases and ions on stability of G-quadruplex DNA*
- Retrieval of multiple scattering contrast from x-ray analyzer-based imaging*