Numerical simulation on ionic wind in circular channels*
Gui-Wen Zhang(张桂文), Jue-Kuan Yang(杨决宽), and Xiao-Hui Lin(林晓辉)
School of Mechanical Engineering and Jiangsu Key Laboratory for Design and Manufacture of Micro-Nano Biomedical Instruments,Southeast University,Nanjing 211189,China
Keywords: corona discharge,ionic wind,numerical simulation,wind velocity
1. Introduction
Corona discharge is one of the most interesting natural phenomena in plasma science, often accompanied by a faint light purple halo, hissing noise, and ozone generation. The air jet can be excited near the location where the corona discharge occurs, but it is not easy to observe because the air jet velocity is very small. The air jet caused by corona discharge is generally called ionic wind.It is generated molecules near according to the following process: when a high potential difference is applied, the air near the corona electrode is ionized to generate an electron avalanche if the applied voltage reaches the inception voltage, furthermore, the ionized gas travel towards the collector electrode,colliding with neutral air molecules resulting in transferring momentum to the surrounding molecules,thus forming the ionic wind.[1–3]The phenomenon of ionic wind is well known as electrohydrodynamic (EHD) effect due to its low power consumption, low noise emission, and lack of moving parts. EHD phenomena have attracted considerable attention for their various applications,such as EHD flow control,[4]EHD cooling,[5,6]EHD drying,[7]EHD gas pump,[8–10]and the EHD thrust.[11–13]
During the past several years, there has been a growing interest in increasing ionic wind velocity. As the mechanism of ionic wind in simple geometries has been well understood,researchers began to find new approaches either in the electrode geometry or the discharge generation to maximize ionic wind performance and wind velocity. That is, the challenge in the field is no longer one of understanding the physics but of investigating configuration parameters such as electrodes,geometry and so on to get better ionic wind performance.
There are several different configurations used in ionic wind generators such as needle-to-ring, wire-to-plate, wireto-mesh,needle-to-mesh,etc.[1]For single emitting electrode configuration, Rickard et al.[14]designed a needle-to-ring electrode system with a converging nozzle, with an intention to accelerate the gas flow under the downstream of the collector electrode. However,the maximum velocity only increased slightly from 1.6 m/s to 2.4 m/s when attaching a converging nozzle, and as the shape of the nozzle got smaller, the maximum velocity was almost maintained at about 2.4 m/s.A wire-non-parallel-plate EHD gas pump was investigated by Tsubone et al.[15]This system achieved a maximum velocity of 1.9 m/s and volumetric flow rate of 44 L/min. Moreau[16]found that the most efficient electrode gap G depends on the tuber diameter D. Their results indicate that the optimized configuration was that G/D must be between 0.5 and 0.75.However,the maximum wind velocity at the tube center is still less than 10 m/s.
Compared to a single emitting electrode, one of the hot topics in ionic wind field is to increase the ionic wind velocity and flow rate using multiple emitting electrodes. For instance, multi-needle-to-mesh and multi-wire-to-mesh configurations were investigated and their ionic wind velocity performances were experimentally assessed by Fylladitakis, et al.[17]They found that multi-wire-to-mesh configuration can give a higher wind velocity than multi-needle-to-mesh,but the multi-needle-to-mesh configuration produced flows at applied voltages ~1.5 kV lower than the multi-wire-to-mesh configuration. Kim[8]investigated an ionic wind blower with multineedle-to-ring electrodes disposed on inner wall of the cylindrical, and multiple corona electrodes were disposed in ring form. The results indicated that the maximum ionic wind capacity of the proposed electric discharge system is approximately 131 cc/s and the energy consumption is 2.5 W.
However, the incorporation of additional emitters is not purely additive,the interactions can be favorable or detrimental. For instance,experiments with multi-needle-to-plate ionic wind generators have been performed by Huang et al.[18]They found that a dense needle arrangement can incur electric field interference between adjacent electrodes. Therefore, for a given electrode height,there is an optimal electrode array below which the required area exposed to the corona wind is apparently insufficient, and beyond which the flow interference caused by adjacent electrodes offsets the effective performance. Lee et al.[19]fabricated an array of 36 point-toring corona discharges on a single circuit board. However,their work highlighted some of the inherent challenges in this approach. When run in parallel, the ionic wind jets interfered with each other causing the individual discharges to produce smaller flow speeds relative to the discharges operating individually. They reduced the interference effect by introducing a shielding layer between the emitter and collector electrodes. Feng[20]reported ionic wind devices with multi-needle-to-mesh and multi-needle-to-fin configurations,in which the needle electrodes were fixed in the pinholes on the conductive strip, and the interval between each adjacent needle was 10 mm. He confirmed that 2.5 mm and 5 mm were the preferred electrode gaps for multi-needle-to-mesh and multineedle-to-fin configurations and increasing the number of needle electrodes can improve the outlet average velocity. but reduce the maximum velocity because the interaction between adjacent corona electrodes of the multi-needle structure weakened the electric field of each other.
Besides the experimental investigation, various numerical investigations are carried out by researchers to investigate the ionic wind. The ions generated by the ion wind produce a certain error in the speedometer measurement. In addition,due to the low spatial resolution of the velocity sensor,experimental measurements cannot provide changes in ionic wind velocity in a small spatial range.Therefore,compared with experiments, numerical simulations can provide a substantially detailed analysis of the electrical and flow characteristics of the ionic wind,so numerical model of EHD flow has become essential for the development and optimization of technologies in the EHD field. For example, Jewell-Larsen et al.[21]presented a numerical couple physics model for EHD flow using COMSOL Multiphysics. Numerical model results were compared with experimental results for the same configuration and agreed well with each other, including corona onset voltage, average output airflow, and output airflow profile. Zhang[9,10]adopted a numerical model to optimize the configuration parameters,including needle electrode configuration,needle diameter,grid size,gap between electrodes and the distribution of the needle electrodes to obtain a considerably high outlet average velocity. Chen[22]numerically investigated electro aerodynamic driven aero plane,in this study,a two-dimensional (2D) unipolar ion drift model coupled with Naive–Stokes equations is developed and validated by experiments. The electric field,space charge distribution,ionic wind velocity and body force are obtained. The flight velocity, the lift, and distance of the ionic wind-based aero plane in the experiment and in an extreme case are analyzed theoretically based on the modeling results.
Although numerous configuration parameters of ionic wind have been reported, so far few of them investigate the arrays of emitting electrode based on the shape of the channel,which directly influences the characteristics and development of velocity field. In this article, we study a multi-needle-tomesh ionic wind generator. In this generator,the needle electrodes are arranged on a circle which is concentric with the circular channel.This configuration is different to that reported in the references where the needle electrodes were attached to the inner wall of the channel. To aid the investigation,numerical simulations have been conducted. Mesh gap, the distribution of needle electrodes,the number of needle electrodes,and the radius of the circular channel are regarded as adjustable parameters to investigate their influences on the ionic wind. Accordingly,the best configuration parameters of the ionic wind generator can be selected to obtain the optimal velocity of the ionic wind. This article is structured as follows: Section 2 introduces the numerical modeling of the ionic wind;Section 3 gives the results of numerical simulations and discussions on the results;and Section 4 summarizes the work of this paper.
2. Numerical modeling
2.1. Physical model
The basic configuration parameters of the ionic wind generator are shown in Table 1.Figure 1 shows the physical model of the ionic wind, air enters from the circular channel inlet,ionic wind is generated between needle electrodes and mesh electrodes and flows out from the circular channel outlet. Air is considered as dry air,atmospheric pressure is considered as standard pressure, the reference temperature is 293.15 K and the influence of humidity is ignored in this numerical simulation.
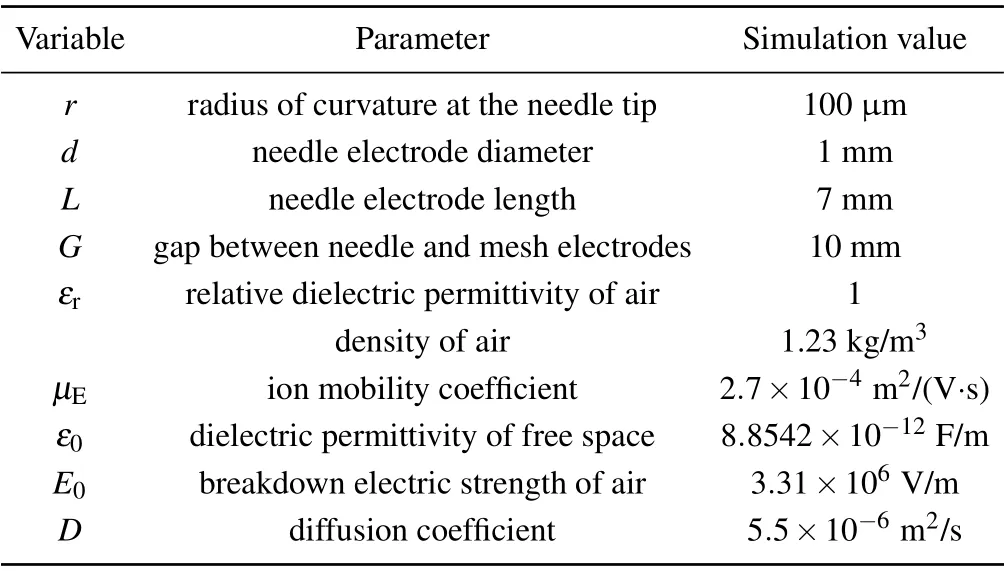
Table 1. Basic configuration parameters.
The values of εr,μE,ε0,E0,and D come from Ref.[23].

Fig.1. Physical model of the ionic wind.
2.2. Governing equations
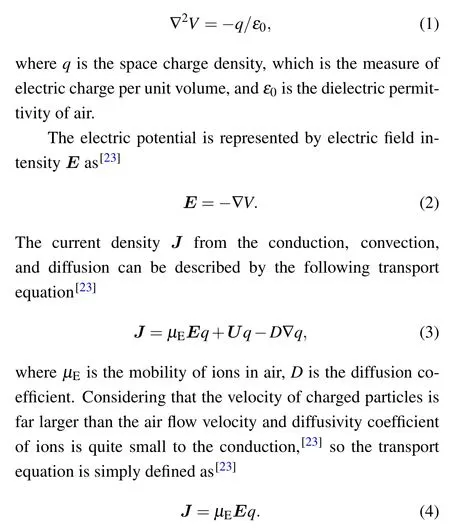
Ionic wind induced by corona discharge under directcurrent voltage is described by the following equations. The electric potential V is governed by Poisson’s equation[23]
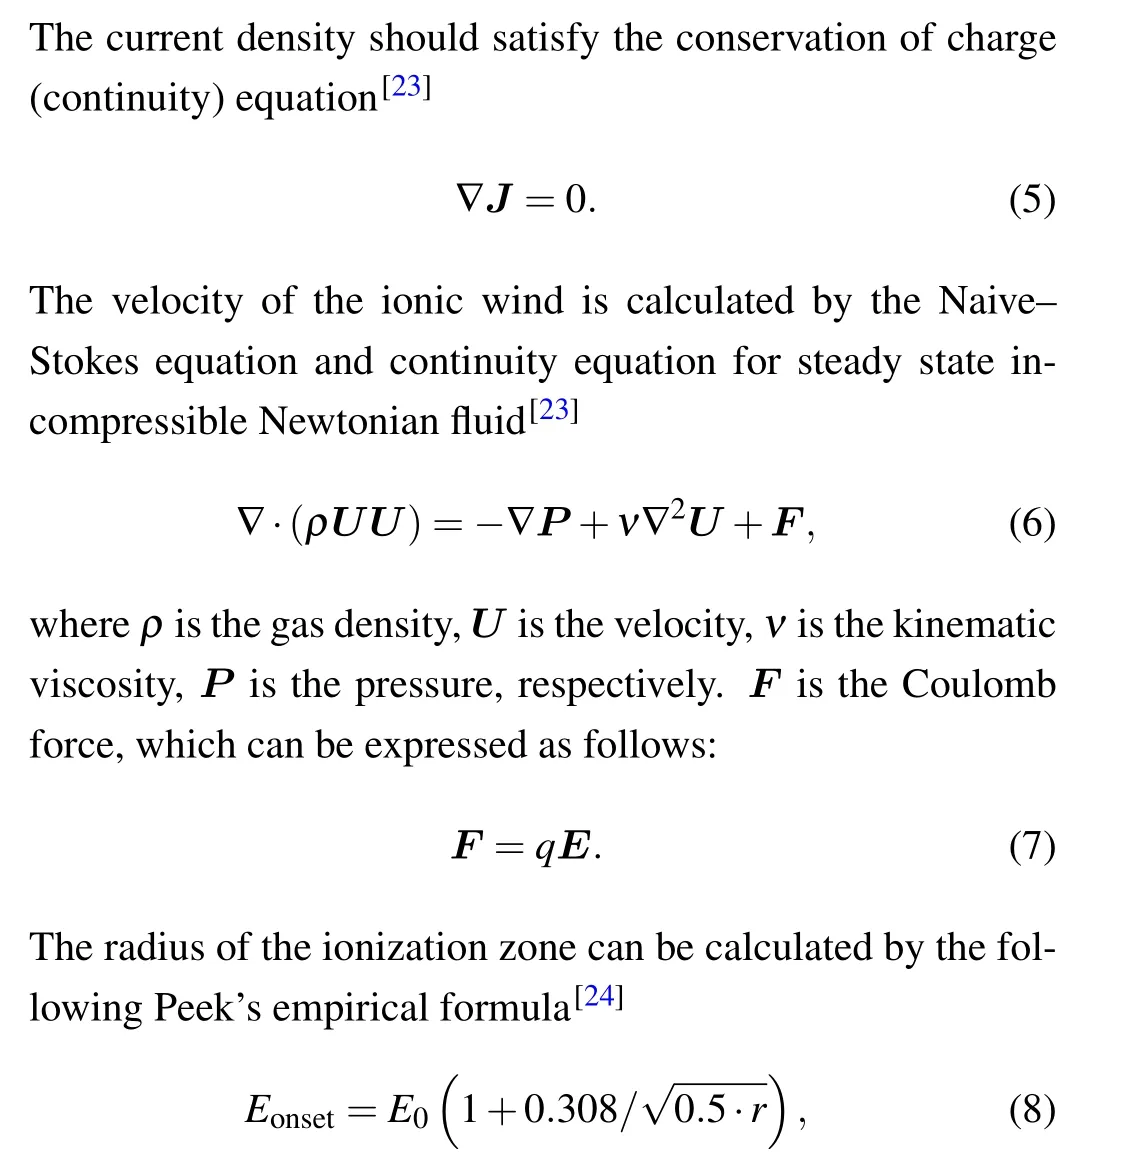
where r is the needle electrode’s radius and E0is the breakdown electric strength of air. In the present work,r is equal to 0.01 cm,then the Peek value Eonsetis approximately equal to 1.66×10⁷V/m.
2.3. Solution method and boundary conditions
To calculate the velocity characteristics of the ionic wind according to the different conditions, three modules, such as electrostatic module,transport of diluted species module,and laminar flow module,in COMSOL MULTIPHYSICS are used to calculate the velocity. First of all,to calculate the Poisson’s equation,a constant high positive DC voltage is applied to the needle electrodes,and the mesh electrodes are grounded,zero charge is set as boundary condition on the other surfaces. For charge motion, the initial space charge density is applied to the needle electrodes. The Katpzov hypothesis was adopted to calculate the initial space charge density. It is assumed that the electric field will remain its corona onset value after the corona discharge is initiated, and the Peek’s law determines the value of electric field. The other surfaces are assumed to be zero flux. Finally,the velocity field is simulated in the laminar flow. The no-slip condition is applied to the surfaces of the needle electrodes, mesh electrodes, and the channel, and pressure condition is applied to the inlet and outlet to calculate the velocity characteristics of the ionic wind. Figure 2 shows the mesh of the model and detailed boundaries conditions. Regular tetrahedral mesh sets are generated for the simulation process. The mesh around the needle and collector electrodes has been densified to improve the calculation accuracy. The mesh is divided smaller with the minimum element size of 0.1 μm in the area near the needle tip and the surface of the mesh electrodes. In other surfaces the minimum element size is 0.03 mm, which can grow to 2.81 mm with a growth rate of 1.15. This mesh is used to determine three interdependent variables: electric field distribution,space charge density distribution,and velocity distribution.
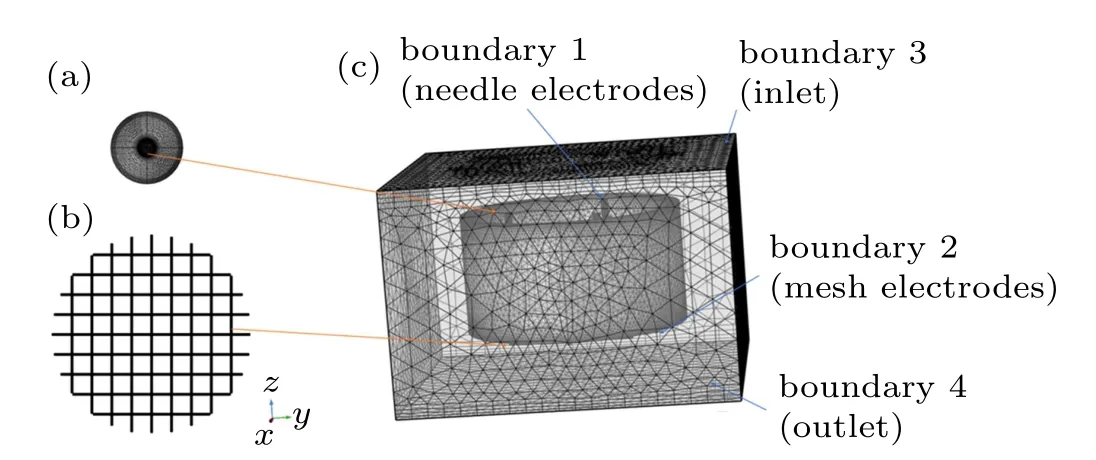
Fig.2. The mesh of the model: (a)mesh for the needle electrodes;(b)mesh for the mesh electrodes;and(c)mesh profile for the whole geometry.
2.4. Numerical model validation
In order to verify the reliability of the simulation method,a numerical simulation model is established,which was similar to the experimental model conducted by Chen.[26]Regular tetrahedral mesh sets are generated for the simulation process.The mesh around the needle and collector electrodes has been densified to improve the calculation accuracy. Five mesh sets(i.e., 664, 880; 1016, 654; 1296, 126; 1864, 267; and 2174,984) are generated in the mesh independence analysis. The evaluation index is the average outlet velocity,which increases by only 1.5%between the fourth and fifth mesh sets when the mesh number increases by 117%. Therefore,the fourth mesh set (i.e., 1,864, 267) is chosen for the numerical simulation.Then the simulation values of the outlet velocity are compared with the reference experimental results.The results of the simulation validation are presented in Fig. 3, it shows that simulation results are in good agreement with the experimental results, and the maximum relative deviation of the outlet velocity is 8.57%under an applied voltage of 10 kV.Therefore,the simulation method is reliable.
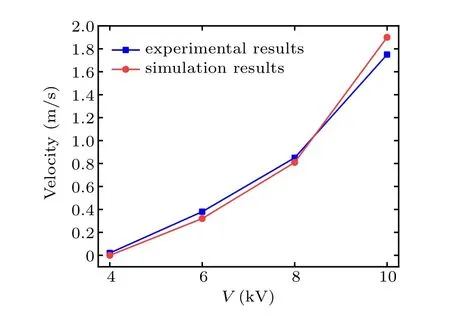
Fig.3. Verification of the simulation method.
3. Numerical parametric studies on velocity of ionic wind
In the following sections, the influence of the mesh gap,the distribution of needle electrodes, the number of needle electrodes,and the radius of the circular channel on the ionic wind velocity performance are investigated.
3.1. Influence of mesh gap
As it can be seen in Fig.4,the mesh gap is a vital parameter of the mesh size,which can significantly affect the velocity of the ionic wind.In the investigation of the mesh size,various parameters were set as follows:the number of needle electrode is 1,which is placed in the center of the channel; the gap between needle electrodes and mesh electrodes is 10 mm; the radius of the circular channel is 15 mm. Owing to the velocity of the ionic wind under positive DC voltage performing better than negative DC voltage under the same voltage amplitude,[1]the positive DC voltage is set as 10 kV.
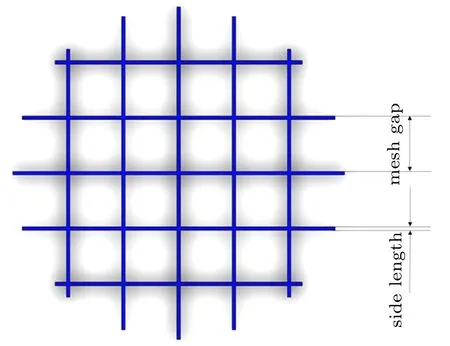
Fig.4. The schematic diagram of the mesh size.
The influence of the mesh gap on the maximum velocity and average outlet velocity is illustrated in Fig. 5. It can be seen that average velocity increases with the increase of mesh gap and slowly declines after maximum value. However, maximum velocity decreases with the increase of mesh gap, and slowly rises after minimum value, the declines after maximum value. The maximum value of average velocity is 2.56 m/s when the mesh gap is 12 mm; and the maximum value of maximum velocity is 5.93 m/s when the mesh gap is 2 mm. When the mesh gap is 2 mm, average velocity is low,but maximum velocity is high.
Figure 6 clearly illustrates the velocity distributions for different mesh gaps, it can be inferred that the mesh electrode becomes too dense, thereby average velocity is greatly decreased owing to the resistance of mesh electrodes, on the other hand, when the mesh gap is getting bigger, the velocity will also decrease slightly,because the available collector area for the mesh electrode becomes smaller as the mesh gap becomes larger, thereby possibly reducing the outlet velocity in this case. Thus,12 mm could be chosen as the optimal value of mesh gap for subsequent investigations.
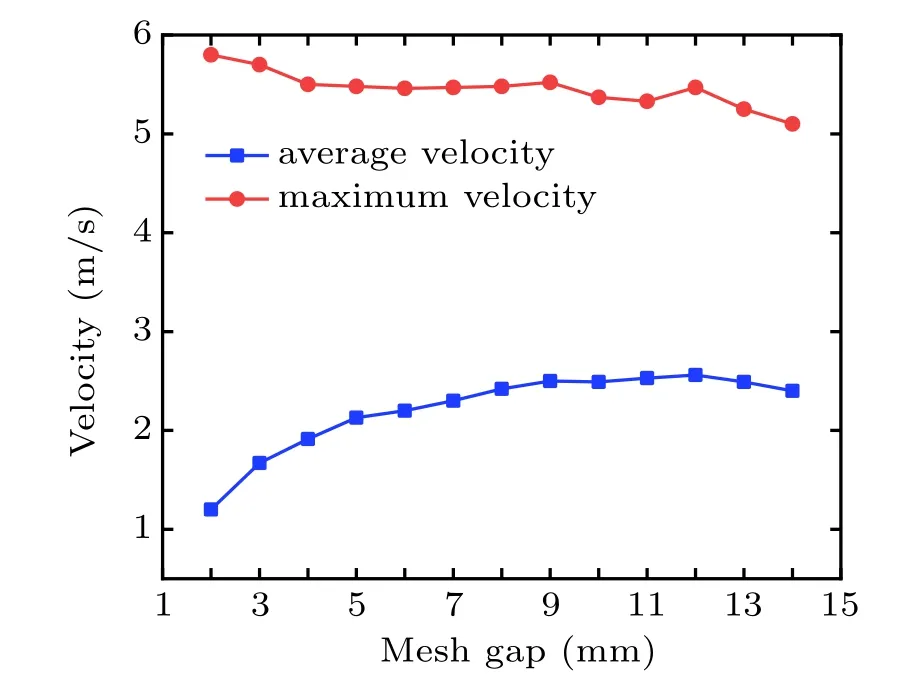
Fig.5. The velocity characteristics with the mesh gap.
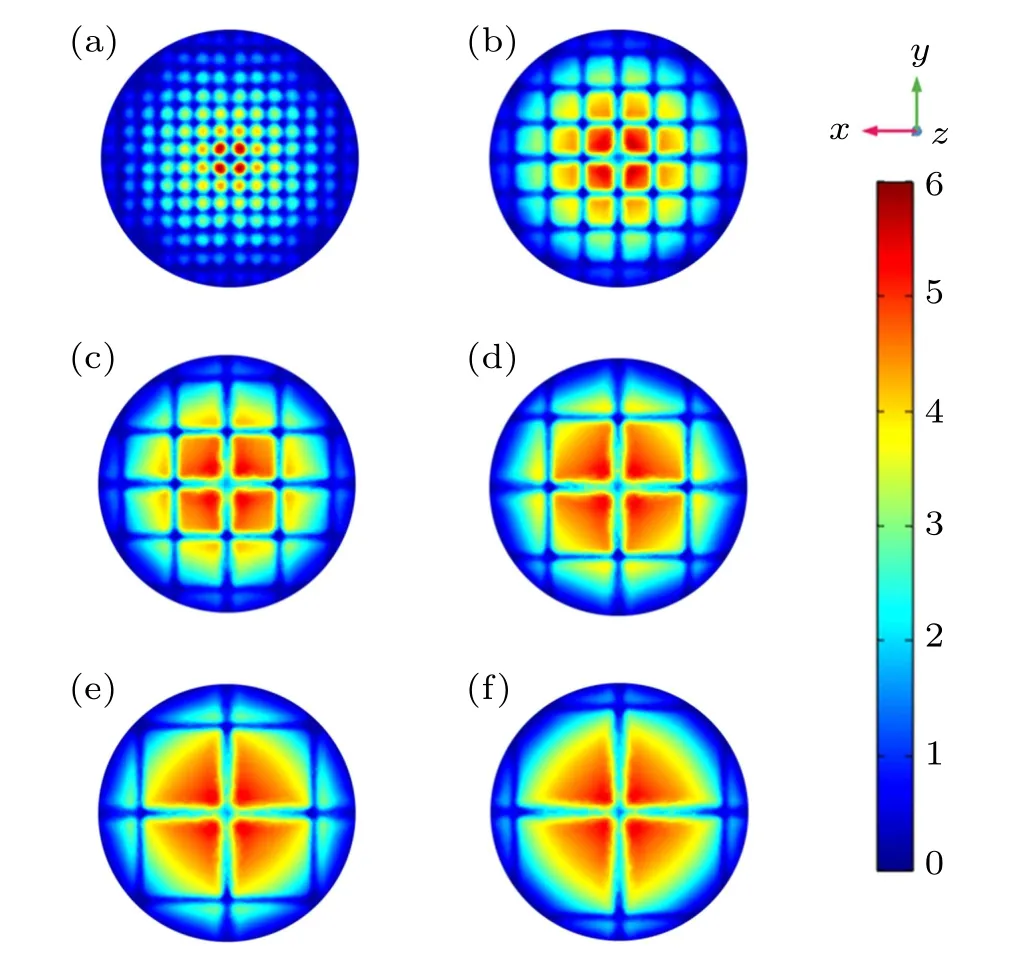
Fig.6. Velocity distribution for different mesh gaps: (a)mesh gap=2 mm,(b) mesh gap =4 mm, (c) mesh gap =6 mm, (d) mesh gap =8 mm, (e)mesh gap=10 mm,(c)mesh gap=12 mm.
3.2. Influence of distribution of needle electrodes
To investigate the influence of the distribution mode of needle electrodes on performances of the ionic wind velocity,figure 7 shows the distribution of needle electrodes when the numbers of needle electrodes were set as 3. As is shown in this figure,the circle formed by the needle electrodes and the circular channel are concentric circles.In this situation,r1represents the radius of the circular,which is composed of needle electrodes, and r2represents the radius of the circular channel. Dimensionless parameter α(α =r1/r2) is regarded as a crucial parameter to investigate the effect of the distribution of needle electrodes on the working performances of the ionic wind,with α =1 referring to the channel walls,α =0 referring to the center of the wall. On condition that the number of needle electrodes is 3,the applied voltage is 10 kV;the gap between needle electrode and mesh electrodes is 10 mm; the radius of the circular channel is 15 mm.
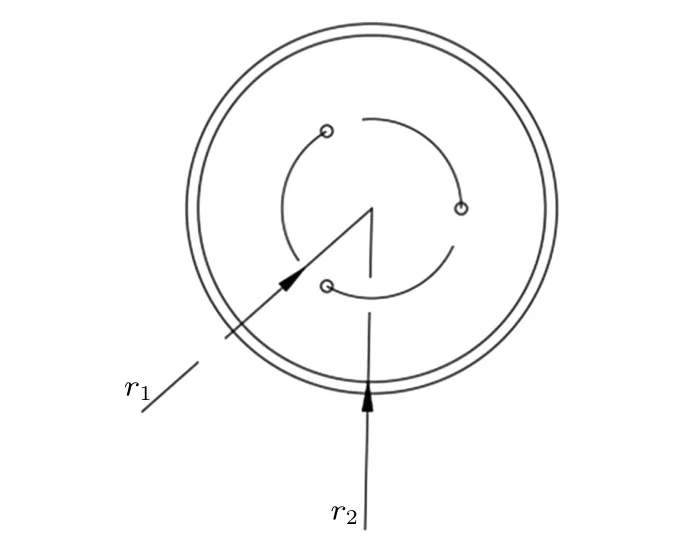
Fig.7. Distribution of three needle electrodes.
Figure 8 shows the influence of α on maximum velocity and average velocity. As can be seen from this figure, maximum velocity and average velocity increase with the increase of α and decline after maximum value. The maximum velocity achieves maximal value, which is 7.7 m/s, the average velocity achieves maximal value,which is 4.2 m/s,when α is 0.7.
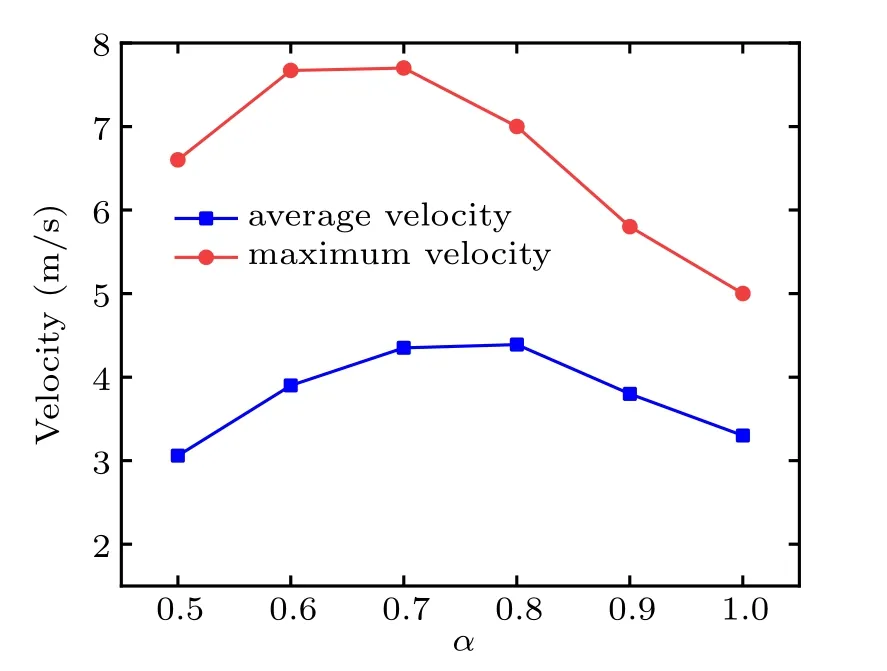
Fig. 8. The ionic wind velocities for different distributions of the needle electrodes.
Figure 9 illustrates the velocity distributions at crosssection (z=-5) for six configurations, it can be concluded that when the needle electrodes are closer to the center or the wall of the tube,both maximum velocity and average velocity do not perform better than other conditions. On the one hand,if the needle electrodes are closer to the center of the tube,the electric field between them will become more and more intense,then velocity close to the wall will rapidly decline. On the other hand, if the needle electrodes are close to the wall of the tube,it will have negative impacts on the velocity close to the center of the circular channel. But the velocity distribution of the circular channel becomes more uniform. By comprehensively considering the velocity, the α =0.7 is selected under the condition that the number of the needle electrodes is 3.
3.3. Influence of the number of needle electrodes
To explore the influence of the number of needle electrodes on the working properties of the ionic wind velocity characteristics. Figure 10 shows the distribution of needle electrodes when the numbers of needle electrodes were set as 3, 4, 5, and 6. In our study, the number of needle electrodes is chosen as 3, 4, 5, and 6; the applied voltage is 10 kV; the gap between needle electrode and net electrodes is 10 mm;the radius of the circular channel is 15 mm.

Fig.10. Distribution for different number of needle electrodes.
It can be concluded that different needle electrodes have different optimum α,and with the increase of the needle electrode number, the optimal α is getting bigger, which are 0.7,0.8, 0.83, and 0.9 respectively when the number of needle electrodes is 3, 4, 5, and 6. Figure 11 shows the influence of needle electrodes on maximum velocity and average velocity, when the number of needle electrodes is 3, 4, 5, and 6,the maximum average velocity is 4.2 m/s, 4.4 m/s, 4.46 m/s,and 4.57 m/s,maximum velocity is 7.6 m/s,7.75 m/s,7.2 m/s,and 7.1 m/s respectively. Figure 12 shows the velocity distributions when needle number is 3, 4, 5, 6. It is noticed that the velocity under the mesh electrodes is much smaller than other positions because of the resistance of mesh electrodes.In spite of increasing the number of needle electrodes,the average wind speed only increases slightly, and the maximum wind speed decreases instead. We conjecture that the interference between the adjacent needle electrodes may primarily cause a reduction in ionic wind velocity. Figure 13 shows peak space charge density under different numbers of needle electrodes, when α is 0.7. It is observed that as the number of needle electrodes increases, the value of space charge density decreases, and the peak space charge density value of the 3 needles is much larger than other conditions. This clearly demonstrates that when the needle electrode number increases, the interaction between different electrode needles becomes stronger and stronger,thus resulting in the weakness of the space charge density. The space charge distributions(x–y plane,z=-1)inside the channels are shown in Fig.14 under the condition α =0.7. The influence of the needle electrodes can be clearly seen from the cross-section. As the number of needle electrodes increases,the radius of influence from each needle decreases. It is also noticed that in this situation, the configuration with 6 needle electrodes has the lowest value of the space charge density, while the configuration with 3 needle electrodes has the highest space charge density value. As demonstrated in Refs. [18,19], this interference will have a negative effect on the ionic wind performances.

Fig.11. The change in ionic wind velocity when increasing the number of needle electrodes.
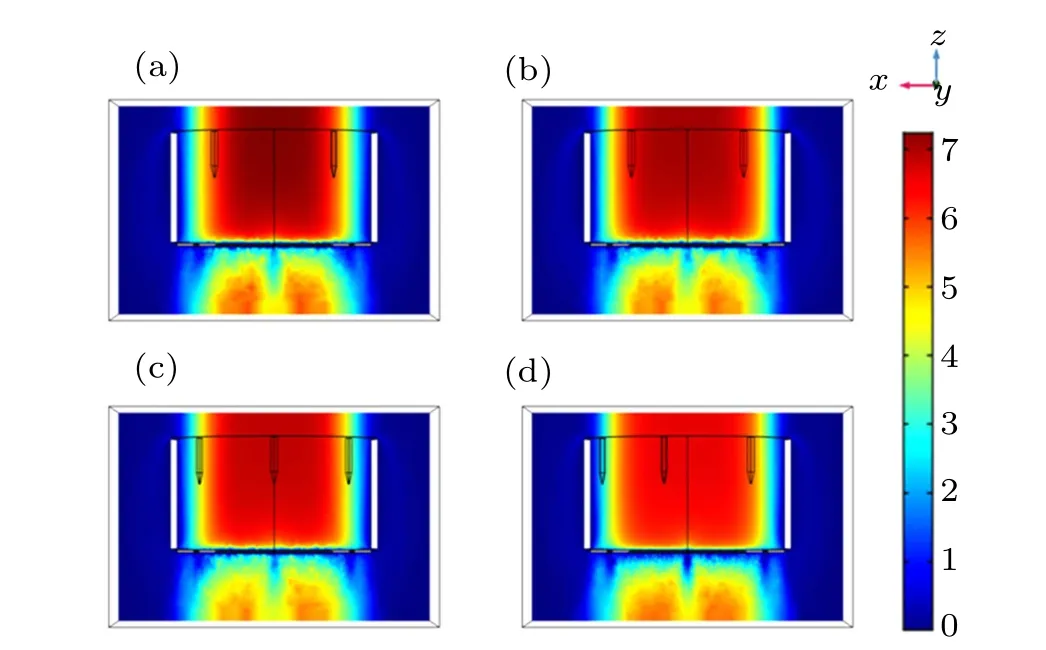
Fig. 12. Velocity distributions for different numbers of needle electrodes:(a)3 needle electrodes;(b)4 needle electrodes;(c)5 needle electrodes;(d)6 needle electrodes.
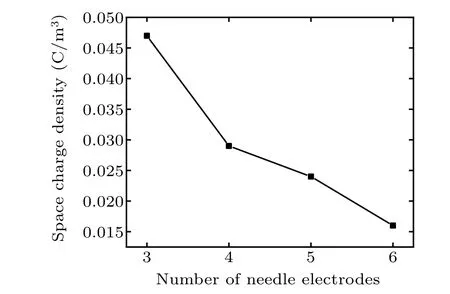
Fig.13. The peak of space charge density under different needle electrode numbers.
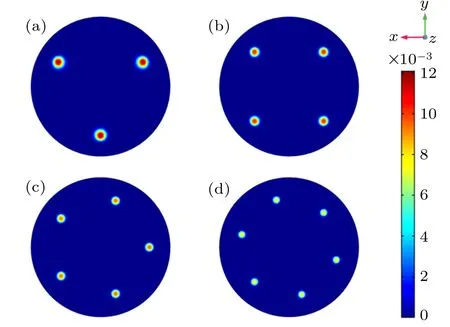
Fig.14.Space charge distribution for different numbers of needle electrodes(x–y plane, z=-1): (a) 3 needle electrodes; (b)4 needle electrodes; (c) 5 needle electrodes;(d)6 needle electrodes.
3.4. Influence of radius of circular channel
Evidently, the radius of the circular channel is a crucial configuration factor which directly determines the development of the ionic wind. To investigate the radius of the circular channel on performances of the ionic wind, the applied voltage is taken as 10 kV,mesh gap is 12 mm,the number of needle electrodes is 6,furthermore,α is 0.9.
For a single needle electrode, both maximum velocity and average velocity decline with the increase of the radius of the circular channel. However,for multi-needle electrodes,as shown in Fig. 15, maximum velocity and average velocity increase with the increase of the radius of the circular channel and decline after maximum value. The maximum value of maximum velocity is 6.7 m/s when the radius of the circular channel is 15 mm,and the maximum value of average velocity is 4.7 m/s when the radius of the circular channel is 16.5 mm.Figure 16 illustrates peak space charge density under different radiuses of the circular channel,when α is 0.9. It can be seen that as the radius of the circular channel increases, the value of space charge density increases, and the peak space charge density value of 13.5 mm is much smaller than that under other conditions,which obviously indicates that when the radius of the circular channel decreases,the interaction between different electrode needles becomes stronger and stronger, thus resulting in the weakness of the space charge density. When the channel radius is bigger than 16.5 mm,the peak space charge density does not rise as fast as before,which indicates that as the channel radius increases,the interference between the needle electrodes is not as intense as before. The space charge distributions(x–y plane,z=-1)inside the channel are shown in Fig.17 for five radius configurations under the condition of α =0.9. The influence of radius can be clearly seen from the cross-section. For the configuration with radius of 13.5 mm,the charge density is weaker than any other cases. It is concluded that when the radius of the circular pipe gets smaller,the interaction between different electrode needles becomes stronger and stronger, thus resulting in the weakness of the space charge density. On the other hand,with the increase of the radius,the distribution of air jet sources is more scattered,and the average velocity will decrease accordingly. Thus, a bigger circular channel could get an inferior velocity performance, the improvement of the radius of the circular channel is conducive to enhance the velocity and improve the velocity distribution, when the number of needle electrodes is 6,the optimum radius of the circular channel is 16.5 mm,which performs better than other conditions in our investigations.
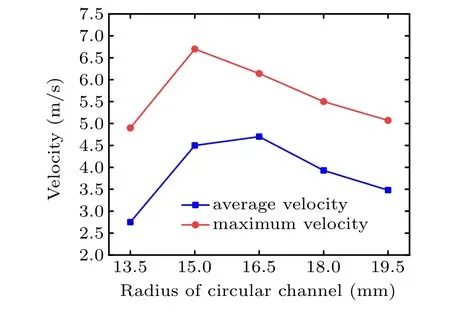
Fig. 15. The ionic wind velocities under different radiuses for circular channels.
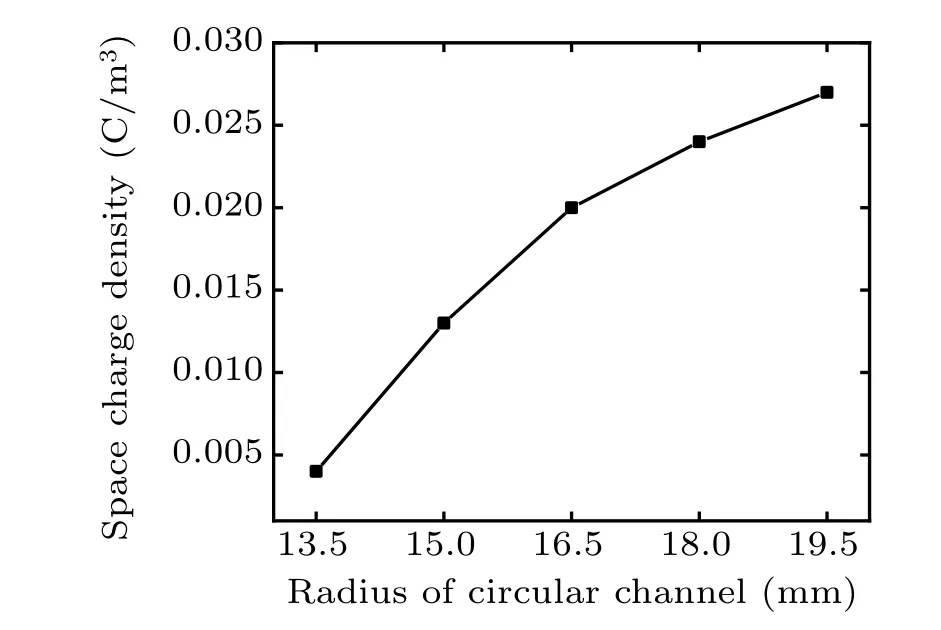
Fig.16.The peak of space charge density under different radiuses of circular channels.
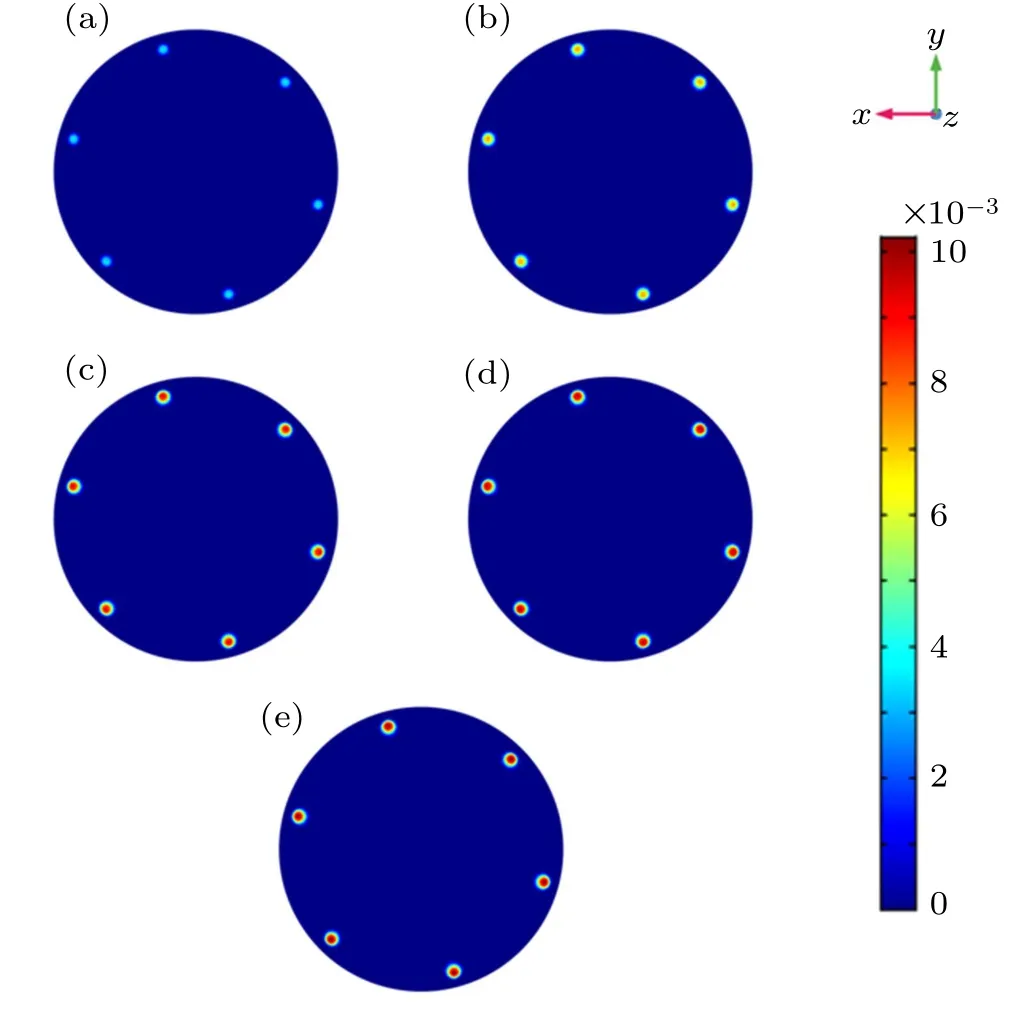
Fig.17. Space charge distribution for different radiuses of the circular channel(x–y plane,z=-1):(a)R=13.5 mm;(b)R=15 mm;(c)R=16.5 mm;(d)R=18 mm;(e)R=19.5 mm.
4. Conclusion
In this paper, the influence of the mesh gap, the distribution of needle electrodes, the number of needle electrodes,and the radius of the circular channel on the performance of the ionic wind have been investigated numerically. Specific conclusions are drawn as follows:
(i) On the condition of the same other configuration parameters,there is an optimal gap of meshes: too large,or too small, a mesh size will inhibit the development of the ionic wind. The optimum value of the mesh gap is 12 mm in this study.
(ii) The distribution of needle electrodes has significant impact on the velocity. In this investigation,the more uniform the needle electrode distribution,the greater the velocity of the ionic wind. The optimum α is 0.7–0.9,which greatly increase the velocity of the ionic wind.
(iii)The number of needle electrodes affects velocity significantly. However, if the radius of the circular pipe is not suitable for the needle electrode number,increasing the number of needle electrodes cannot increase the velocity of the ionic wind effectively in our investigations. Thus, the radius of circular channel is most important for improving the performance of the ionic wind.
- Chinese Physics B的其它文章
- Interaction properties of solitons for a couple of nonlinear evolution equations
- Enhancement of multiatom non-classical correlations and quantum state transfer in atom–cavity–fiber system*
- Protein–protein docking with interface residue restraints*
- Effect of interaction between loop bases and ions on stability of G-quadruplex DNA*
- Retrieval of multiple scattering contrast from x-ray analyzer-based imaging*
- Numerical research on effect of overlap ratio on thermal-stress behaviors of the high-speed laser cladding coating*

