Glass formation and physical properties of Sb2S3–CuI chalcogenide system*
Qilin Ye(叶旗林), Dan Chen(陈旦), and Changgui Lin(林常规),†
1Laboratory of IR Materials and Devices,The Research Institute of Advanced Technologies,Ningbo University,Ningbo 315211,China
2Key Laboratory of Photoelectric Detection Materials and Devices of Zhejiang Province,Ningbo University,Ningbo 315211,China
Keywords: chalcogenide glass,infrared(IR)transparency,Sb2S3,SbSI,Raman spectra
1. Introduction
Chalcogenide glass (ChG) is well known for its feature properties, including wide infrared (IR) transmission window, low phonon energy, fast ionic conduction, and large linear/nonlinear optical refractive index.[1,2]To facilitate the glass-forming ability of ChG, the incorporation of halogens is an efficient and feasible method and produces a new kind of glass,i.e.,chalcohalide glass.Compared to ChG,chalcohalide glass not only retains the excellent IR-transmitting property of ChG, but also possesses better thermal stability, higher rareearth ion solubility, and stronger glass-forming ability.[3–5]Various chalcohalide glasses have been investigated extensively, including As–Sb–S–I,[6]GeS2–Sb2S3–CsCl,[7]Ge–Te–Ga–CuI glass,[8]etc. The glass network of ternary or quasi-ternary systems are very complicated, which was difficult to clarify the effect of halides on the structural and physical properties of ChGs. It requires a simple glass system for clarifying the role of halogens in ChGs.
Amorphous Sb2S3composed by the basic structural units of [SbS3] pyramids, has received a remarkable technological and theoretical interest because of its intriguing photophysical properties.[9,10]Amorphous Sb2S3is normally obtained through film deposition.[11,12]Sb2S3acts as intermediate phase in glassy network,and cannot form as glass through traditional melt-quenching.[13,14]It is essential to introduce trivalent or tetra-valent atoms, such as Ge and Ga, which act as glassy network former and increase the dimensionality of the structure and the glass forming ability of the Sb2S3.[8,15]Alloying with halides is another strategy to obtain Sb2S3-based chalcohalide glass.[6,14]Halogen (Cl, Br, I) in glass systems is monovalent, which forms non-bridging structural motif with the free electrons.[16,17]High atomic-mass halogens bonding with Sb increases the complexity and randomness of the network connectivity, thus inhibiting the crystal formation of Sb2S3. Consequently,stable bulk glasses of Sb–S–I system can be fabricated, whose microstructure is built by a weak interaction among [SbS3], [SbS3-xIx], and [SbI3]pyramids.[16,18]Nevertheless, iodine sublimation occurs easily during glass preparation, especially in vacuum extraction process,which would destroy the vacuum pump. Thus,metal iodide is a good choice for exploring the role of halogens in ChGs.
In this work,we report novel ChGs based on Sb2S3–CuI system. CuI was introduced to facilitate the glass formation of Sb2S3. The present work aims to study the effect of CuI on the glass-forming and physical properties of Sb2S3-based glasses, and to explore the role of halogens in chalcogenide glassy structure. In addition,fast Cu-ion conduction was also investigated in this glassy system,which is of guiding significance for future designing solid glassy electrolytes.[19–22]
2. Experimental
The samples of (100-x)Sb2S3–xCuI (x = 20, 30, 40,45, 50, and 55 mol%) were prepared by traditional meltquenching method. High-purity Sb,S,and CuI were weighed and placed into silica tubes that sealed under ~10-3Pa,the inner diameter of the quartz tube is 9 mm,and the wall thickness is 2 mm.After melting at 920◦C for 6 h,rod samples were obtained by quenching the melts into cold water 3 seconds. The as-quenched samples were annealed at 150◦C for 2 hours.The rods were cut and polished to obtain Φ9 mm×2 mm disks.
All samples were analyzed by x-ray diffraction (XRD,Bruker D2 Phaser, DE) to identify the amorphous nature of samples or the presence of crystalline phases. Glass characteristic temperatures,including glass transition temperature(Tg)and crystallization temperature(Tx), were measured by using DSC (TA Q2000, USA) by heating 10-mg powdered sample at a rate of 10◦C/min. Density was measured according to Archimedes principle which consists in comparing the difference of sample weights in air and alcohol. Vickers hardness(Hv) was determined by Hengyi MH-3 micro-indenter with a static load of 50 g. IR transmission spectra were obtained through using a Nicolet 381 FTIR spectrometer. Visible and near-IR spectra were recorded using a PerkinElmer Lambda 950 spectrophotometer. A Renishaw InVia Raman spectrometer equipped with an excitation wavelength at 785 nm was employed to obtain Raman spectra. Gold films were sputtered on the surfaces of the studied samples as electrodes for electrical measurements. Electrical conductivity was measured using complex impedance technique with electrochemical platform (Shanghai Chenhua CHI800D series). Ac impedance was measured from 30◦C to 200◦C.
3. Results and discussion
According to previous investigations of Sb2S3-based glass systems,[12,14,23]pure Sb2S3is difficult to form glass.CuI here acts as network modifier to improve the glassforming ability. Figure 1 shows the XRD patterns of (100-x)Sb2S3–xCuI samples. Glassy samples were obtained when CuI content (x) are 30 mol% and 40 mol%. Sharp and different diffraction were observed in 80Sb2S3·20CuI samples,the main diffraction peaks belonging to Sb2S3(JCPDS card No. 73-0393) and the several indistinct diffraction peaks (as marked by dotted frame) belonging to SbSI (JCPDS card No. 74-2246). It indicates that Sb2S3crystallites would be formed spontaneously at a low CuI content (x <20 mol%),together with SbSI. The increasing CuI improves their glass forming ability when 30 mol%<x <40 mol%. With the further addition of CuI, iodine-related crystal phase of SbSI was phase-separated out. Thus, the glass formation region of (100-x)Sb2S3–xCuI is ranging from x = 30 mol% to 40 mol%.
Figure 2 presents the transmission spectra of 70Sb2S3·30CuI and 60Sb2S3·40CuI glasses. Although Sb2S3–CuI glasses are black and visible opaque as displayed by the inset photos in Fig.2,they possess a wide transmission window ranging from near-IR(0.8 μm)to mid-IR(~14 μm),which normally can not be achieved in sulfide glasses. IR absorption bands at about 2.9,4.1,and 6.1 μm are assigned to the OH-,S–H,and H2O impurities,respectively.[24]Glass distillation purification is needed to eliminate these hydroxide contaminations. The maximum transmittance of 70Sb2S3·30CuI and 60Sb2S3·40CuI is about 70%and 40%,respectively. The transmission drop might be due to the occurrence of amorphous phase separation in 60Sb2S3·40CuI glass.[5]
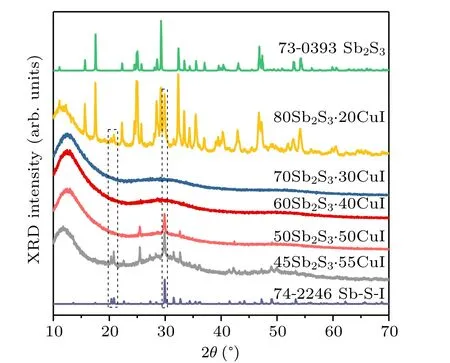
Fig. 1. XRD patterns of (100-x)Sb2S3–xCuI (x =20, 30, 40, 50, and 55 mol%)samples. The standard JCPDS cards of No. 79-0393 Sb2S3 and No.74-2246 SbSI are also included for comparison.
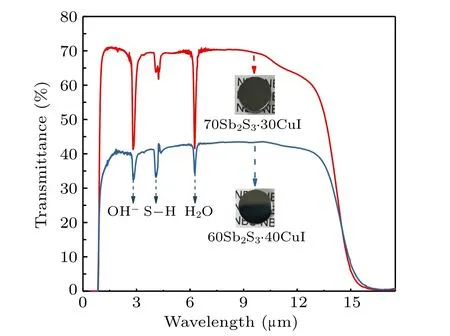
Fig. 2. Transmission spectra of (100-x)Sb2S3–xCuI glasses. The inset shows the sample photos.
The scanning electron microscope (SEM) was employed to observe the microstructure of the Sb2S3–CuI samples. As shown in Fig. 3(a), the freshly cracked surfaces of 60Sb2S3·40CuI as-prepared sample present a clean and smooth structure. After etching in 10% NaOH solution for 3 s, irregular particles were formed on its surface(Fig.3(b)).Due to the different solubility of the Sb2S3and SbSI phases in the NaOH solution,protrusions with different heights were formed during the etching process. It suggests amorphous phase separation occurs in the 60Sb2S3·40CuI sample,which might be responsible for the nearly 30%drop of transmittance as shown in Fig. 2. A large number of unevenly distributed crystal particles appeared in the SEM image of 45Sb2S3·55CuI(Fig.3(c)), with sizes between 50 nm–150 nm. According to the XRD pattern(Fig.1),these particles are belonging to SbSI crystal phase. Interestingly, the crystal grains show a phenomenon of regional aggregation, further indicating the possible amorphous phase separation. Such large phase-separated structure results in that the 45Sb2S3·55CuI sample is opaque.
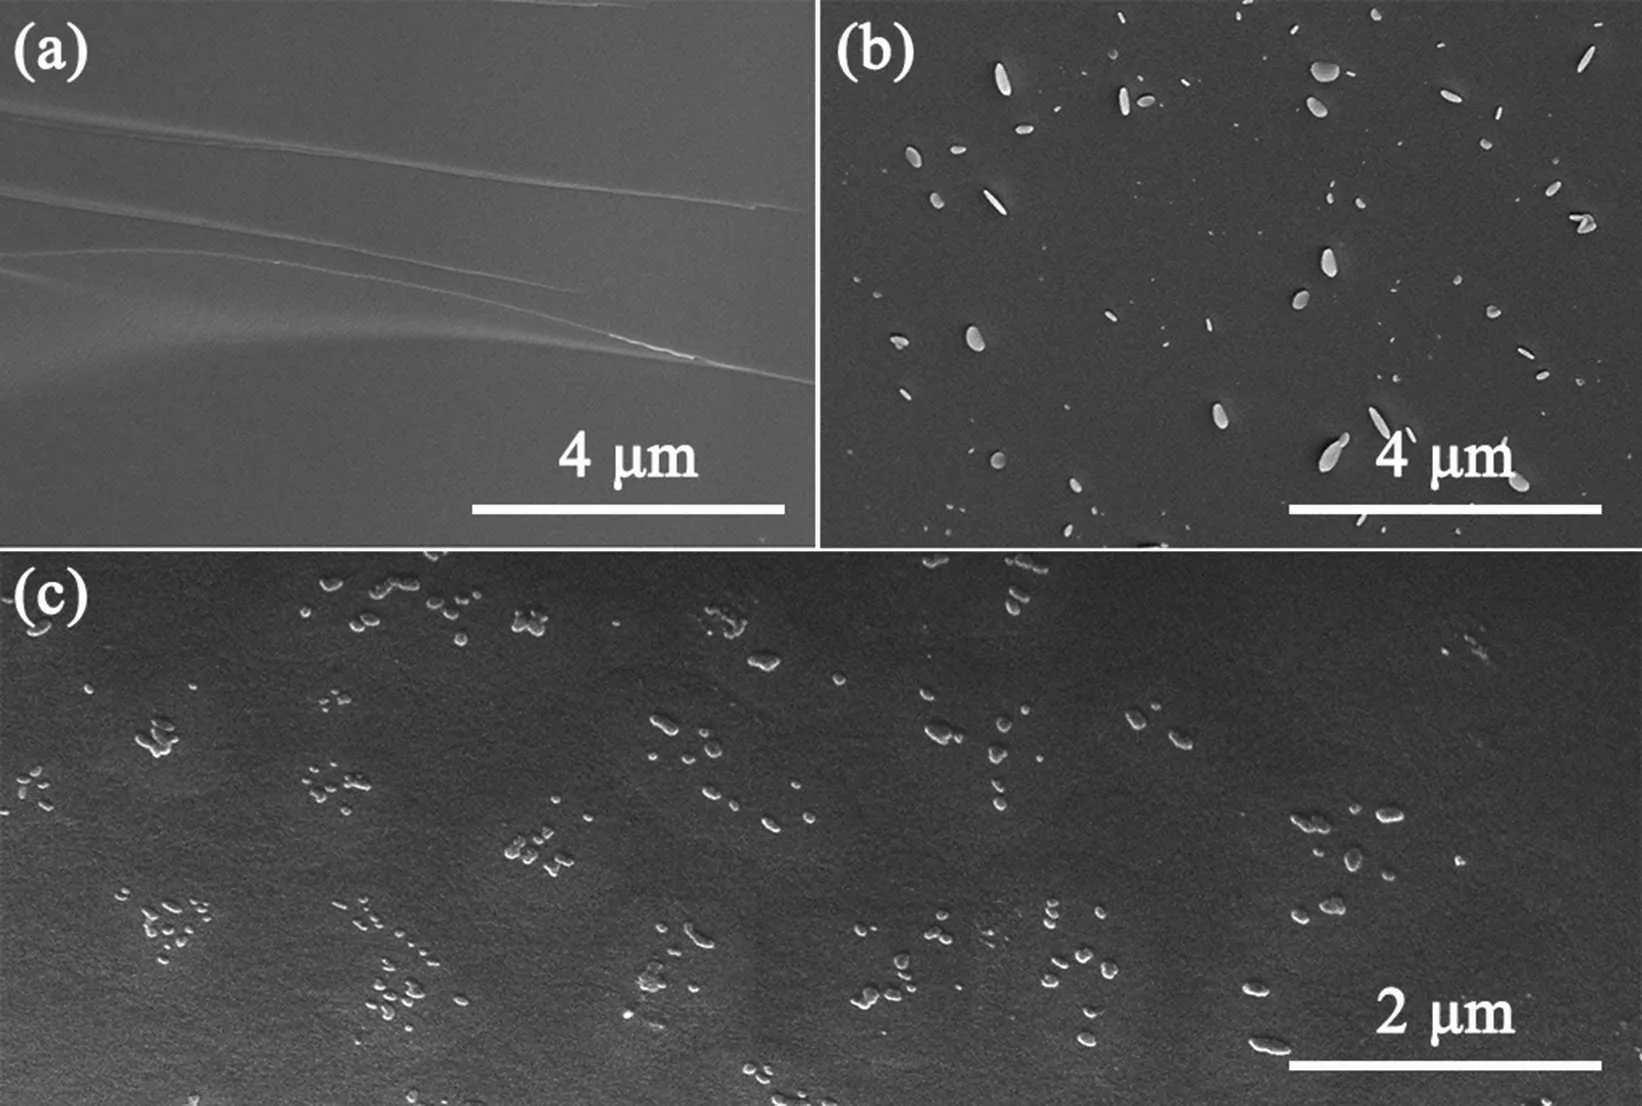
Fig. 3. The SEM image of 60Sb2S3·40CuI (a), etched samples by 10%NaOH solution(b),and 45Sb2S3·55CuI(c).
The detailed Vickers hardness(Hv),density(ρ),and glass characteristic temperatures of (100-x)Sb2S3–xCuI samples are enumerated in Table 1. The density (ρ) values increase as CuI content increases. It is easy to understand the evolution of density because CuI has a relatively large atomic mass. The typical DSC analysis curves of (100-x)Sb2S3–xCuI samples are displayed in Fig. 4. Notably, since several samples were crystallized as shown in Fig. 1, the Tgof these samples were actually the measurement results of the residual glass matrix.[2]For the Sb2S3–CuI system, the Tgvalues are ranging from 185◦C to 209◦C, showing a negative correlation with CuI concentration as shown in the inset of Fig. 4.The iodine acts as a non-bridging modifier in Sb2S3–CuI system, which would impair the glass network connectivity of glass networks in ChGs.[5,8,22]For the same reason, the Hvalso decreases with the increasing CuI as listed in Table 1.The crystallization temperature(Tx)also shows a negative correlation with CuI content, except for the 80Sb2S3·20CuI sample.It could be attributed the 80Sb2S3·20CuI sample was nearly ceramic-like.[25]A large number of Sb2S3crystals were precipitated in the 80Sb2S3·20CuI sample,which makes the sample network structure loose. Thus, it leads to the decrease of the Hvof 80Sb2S3·20CuI sample.[7,26]
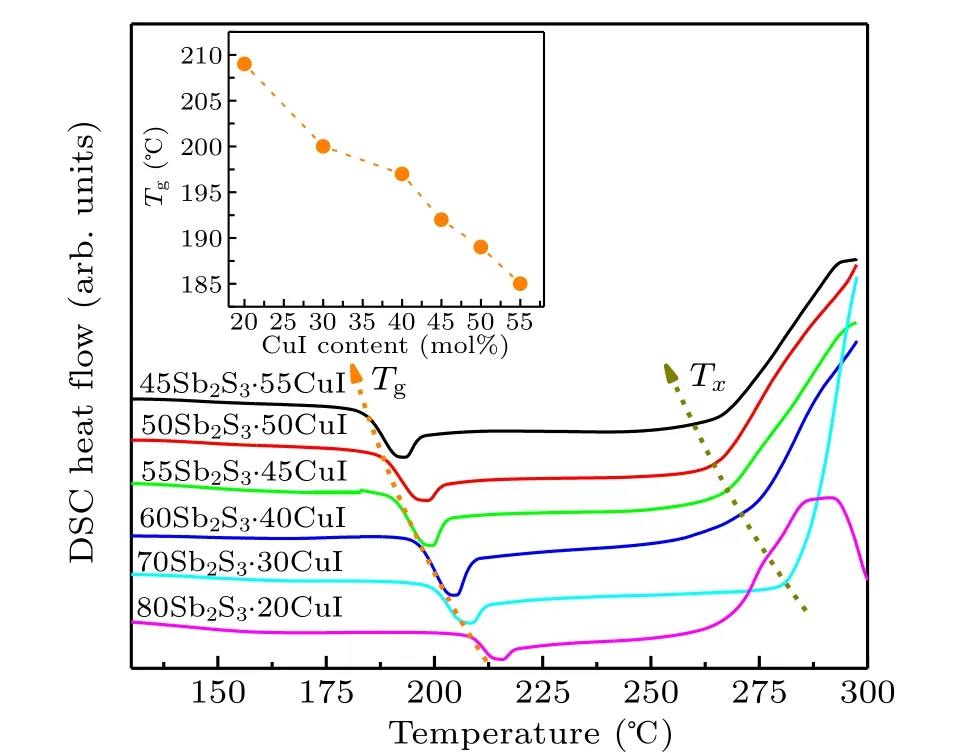
Fig. 4. DSC curves of (100-x)Sb2S3–xCuI (x=20, 30, 40, 45, 50, and 55 mol%) samples. The inset presents the function of Tg as a function of CuI content.

Table 1. Physical properties of(100-x)Sb2S3–xCuI(x=20,30,40,45,50,and 55 mol%)samples.
Figures 5(a) and 5(b) display the typical Nyquist plot of bulk 70Sb2S3·30CuI and 45Sb2S3·55CuI sample at 30◦C,respectively. The intersection point (Z′0) with the real axis is considered to be the specific value of the bulk resistance.[22,27]The resistance values of the 70Sb2S3·30CuI sample is 4.79×10⁷Ω,and the resistance values of 45Sb2S3·55CuI samples is decreasing two orders of magnitude (8.45×10⁵Ω).Conductivity of (100-x)Sb2S3–xCuI samples can be calculated according to σ = L/(SZ′0) (L: the thickness of asprepared samples; S: electrolyte–electrode surface area; Z′0:specific value of the bulk resistance).[21,22]Figure 5(c)shows the temperature-dependence (between 30◦C to 200◦C) of conductivities for the(100-x)Sb2S3–xCuI samples.The conductivity of glass ceramics is dependent on the composition and structure of glass ceramics. For example,45Sb2S3·55CuI glass ceramics contain SbSI crystal which with an high electronic conductivity at room temperature.[28]The SEM of the 45Sb2S3·55CuI sample is shown in Fig. 3(c), and the SbSI crystal size is in a range of 50 nm–150 nm. However, SbSI crystal does not contribute the ionic conductivity of the studied samples. The glass matrix still acts as the ion transport channel in the Sb2S3–CuI system.[29,30]Therefore(100-x)Sb2S3–xCuI sample ion conductance behavior shows a typical glass conduction behavior. According to the corresponding Arrhenius plots the room-temperature ionic conductivities (30◦C)and activation energy of (100-x)Sb2S3–xCuI samples were listed in Table 2. The highest ionic conductivity (σ) of glasses and glass–ceramics calculated from the total resistance is σ =3.68×10⁻⁴mS/cm at 30◦C, which shows obvious Cu+ion conducting behavior.[31–33]In addition,Cu has two chemical valences. CuI is stable in the Cu+oxidation state, while in other halide salts of copper, the Cu2+oxidation state is favored.[34]Therefore, it is reasonable that Cu+plays a dominant role in the Sb2S3–CuI system. The linear dependence of logσ versus (1/T) follows the Arrhenius law and indicates phase stability over the given temperature range.[20,27]The ionic conductivity of 45Sb2S3·55CuI glassceramic is more than two order of magnitude higher than that of 70Sb2S3·30CuI glass. Activation energy(Ea)of Cu+conduction was determined by using the Arrhenius equation and listed in Table 2. Eaincreased with the increase of Cu+ions concentration. Yet,the Eaof 45Sb2S3·55CuI sample is lower than that of 50Sb2S3·50CuI.It can be attributed the SbSI crystal were precipitated in the 45Sb2S3·55CuI sample,which hindered the transportation of Cu+ions.
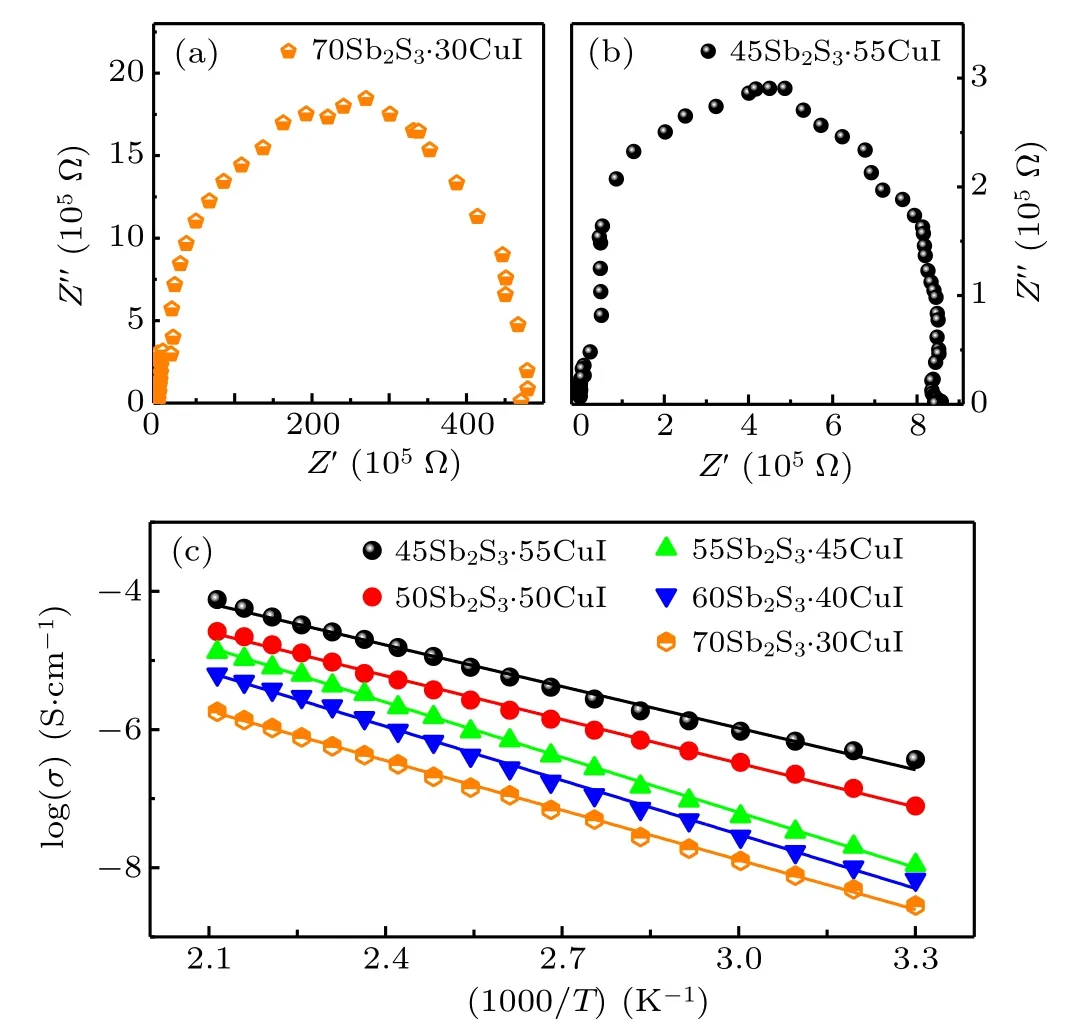
Fig.5. (a)and(b)Representative Nyquist plots at 30 ◦C of 70Sb2S3·30CuI sample and 45Sb2S3·55CuI sample. (c) (100-x)Sb2S3–xCuI (x=30, 40,45,50,and 55)ionic conductivity from 30 ◦C to 200 ◦C.
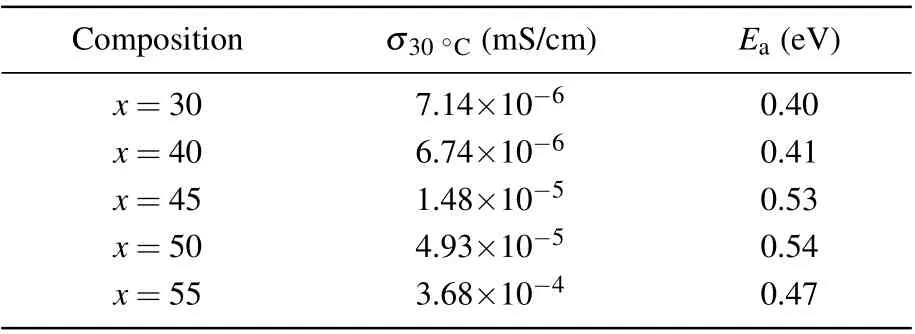
Table 2. Activation energy of ion conduction and ionic conductivities at room temperature(30 ◦C)of(100-x)Sb2S3–xCuI(x=30, 40, 45,50,and 55)samples.
To further get insight into the evolution of structural modifications, the Raman spectra of (100-x)Sb2S3–xCuI samples were obtained at room temperature as shown in Fig. 6.The most intense peaks 280 and 310 cm-1–319 cm-1could be assigned to the asymmetric stretching vibrations of[SbS3]pyramids and Sb-I stretching vibrations of [SbSI] pyramid units,[16,22,35,36]the ascription of other Raman bands have been marked in Fig.6.[35,37–39]When the CuI incorporated of 20 mol%,the several sharp Raman bands and small bump situated at 310 cm-1were observable in the 80Sb2S3·20CuI sample. Combine with the XRD result(Fig.1), excessive[SbS3]units caused a large number of Sb2S3crystals uncontrolled precipitated,and the[SbSI]units were disconnected from the glass network, and the continuous aggregation led to the nucleation and crystallization of SbSI crystals.
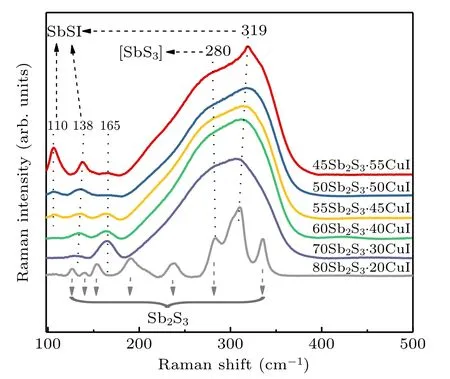
Fig.6. Raman spectra of(100-x)Sb2S3–xCuI(x=20,30,40,45,50,and 55 mol%)at room temperature.
According to the previous studies,the sulfur in structural units is readily replaced by iodine,[21,22]thus the[SbSI]units were easily formed. It results in the sustained increasing of Raman peaks at 110 cm-1and 138 cm-1as CuI concentration increases. On the other hand, a large amount of [SbSI] units were formed to impair the connectivity of glass network structure, which is responsible for the decreasing of Tg(Fig. 4).Meanwhile, the [SbSI] units would act as the structural similarity for the nucleation and growth of SbSI crystals.[6,25]Thus, the SbSI crystallites were precipitated when CuI concentration reached 55 mol%. The network structure of the Sb2S3–CuI system should be composed mainly by[SbS3]and[SbSI] pyramids, and Cu+ions dispersed randomly among those structural units.[20,22]Therefore, the conductivity increases linearly with the increasing CuI content. In addition,the Raman peaks located at 165 cm-1was vanished, which might belong to [SbI3] units or Sb–I bonds.[15,40]In a word,the introduction of iodine with a suitable content (30 mol%–40 mol%) could transform the [SbS3] pyramids into [SbSI]units,improving the glass-forming ability of Sb2S3–CuI.
4. Conclusions
We alloyed simple binary ChG system of Sb2S3–CuI to investigate the effect of halogen on their glass formation and physical properties. XRD results indicate the glass formation region of Sb2S3–CuI glass ranges from x=30 mol% to 40 mol%. All glassy samples have a wide IR optical transmitting window from 0.8 μm to 14 μm, which is the rare wide transparency range obtained in sulfide glass. Moreover,45Sb2S3·55CuI sample exhibits a high ionic conductivity of 3.68×10⁻⁴mS/cm at room temperature.The structural results suggest that the introduction of appropriate iodine(30 mol%–40 mol%) could facilitate the formation of [SbSI] units, improving the glass-forming ability of Sb2S3–CuI. These findings would offer important guidance to further development of novel ChG for IR transmitting materials and high-performance solid electrolytes.
- Chinese Physics B的其它文章
- Numerical simulation on ionic wind in circular channels*
- Interaction properties of solitons for a couple of nonlinear evolution equations
- Enhancement of multiatom non-classical correlations and quantum state transfer in atom–cavity–fiber system*
- Protein–protein docking with interface residue restraints*
- Effect of interaction between loop bases and ions on stability of G-quadruplex DNA*
- Retrieval of multiple scattering contrast from x-ray analyzer-based imaging*

